
Abstract
Colon cancer represents one of the most common cancers in the world. Despite improved treatment, mortality remains high. In order to improve the assessment of prognosis for colon cancer patients, identifying new prognostic markers remains necessary. We analyzed preoperative serum samples from 148 colon cancer patients surgically treated at Helsinki University Hospital from 1998 through 2002 using a multiplex proximity extension assay (Oncology II panel, Olink Bioscience, Uppsala, Sweden), a panel constituting 92 immunological and oncological markers. We performed univariate and multivariate analyses on these patients and calculated the disease-specific survival among patients using the log-rank test for Kaplan–Meier estimates. In the univariate survival analysis of 92 biomarkers, 26 resulted in p < 0.1. Among these, eight biomarkers emerged as statistically significant (p < 0.05). Patients with low levels of kallikrein 13 had a poor prognosis. Moreover, patients with high levels of amphiregulin, carcinoembryonic antigen-related adhesion molecule 5, interleukin 6, mucin 16, syndecan 1, transforming growth factor alpha, and vimentin also had a poor prognosis. In the multivariate analysis, kallikrein 13 and mucin 16 emerged as independent prognostic markers. The role of kallikrein 13, a member of the serine protease kallikrein biomarker family, in tumorigenesis remains unclear. Mucin 16 is also known as carbohydrate antigen 125, a well-known ovarian cancer biomarker. Patients with low levels of kallikrein 13 (hazard ratio: 0.36; 95% confidence interval: 0.14–0.92; p = 0.033) and high levels of mucin 16 (hazard ratio: 3.15; 95% confidence interval: 1.68–5.93; p < 0.005) had a poor prognosis. Mucin 16 and kallikrein 13 represent independent prognostic markers for colon cancer. Furthermore, the clinical utility of mucin 16 and kallikrein 13 serum tests warrants additional investigation.
Introduction
Colorectal cancer (CRC), the third most common cancer with the second highest mortality rate in the world, 1 consists of colon cancer (CC) and rectal cancer. These divisions result from differences in their pathophysiology and histology. In the Nordic countries, CRC has a 5-year overall survival of 65%. 2
Serum carcinoembryonic antigen (CEA) is routinely used in patient follow-up. 3 Other tumor markers, such as IL-8, prolactin, and carbohydrate antigen 19-9 (CA19-9), are comparable to CEA, but fall short in terms of adding value to prognostics.4,5 However, an elevated CA19-9 level in CRC patients with lymph node invasion serves as an independent prognostic marker and may carry further prognostic value alongside an elevated CEA level.5,6
We continue to need new and accurate blood-based biomarkers. Proximity ligation assay (PLA) and proximity extension assay (PEA) represent homogeneous immunoassays with demonstrated sensitivity and specificity.7,8 In PEA, upon binding to the target protein, antibodies linked to oligonucleotides are pair-bound and quantified using real-time quantitative polymerase chain reaction (PCR). 8 A promising prognostic algorithm for CRC patients emerged in a recent study using the Proseek Multiplex Oncology I v296×96 immunoassay (Olink Bioscience, Uppsala, Sweden). 9 Furthermore, by means of Olink technology, metabolic syndrome patients with low levels of hepatocyte growth factor and endothelial cell-specific molecule-1 carried an increased risk of developing CRC. 10
Thus, in this study, we aimed to screen for biomarkers that can be used to evaluate CC prognosis using the Proseek Multiplex Oncology II panel.
Patients and methods
Patients
The cohort constituted 148 consecutive CC patients operated on at Helsinki University Hospital between 1998 and 2002. The mean age of the patients reached 67.8 (range: 31.7–92.6), and 85 (57%) were women. Comorbidities of the patients were recorded and corresponded to that of their age group (Supplementary Table 1). None of the patients received neoadjuvant chemotherapy. According to the Dukes stage classification, 21 patients had stage A disease, 54 had stage B, 51 had stage C, and 22 had stage D disease. For the subgroup analysis, we combined stages A and B (n = 75 patients) and C and D (n = 73 patients; Table 1). In total, tumor histology for 131 (89%) patients indicated non-mucinous adenocarcinoma, while for 16 (11%) patients, it indicated mucinous.
Patient characteristics in 148 colon cancer patients.

IQR: interquartile range.
Serum samples
Serum samples were drawn after one night’s fasting according to the hospital’s routine procedures, a median of 1 day prior to surgery (range: 27 days) alongside other laboratory tests. Without delay, samples were transported to the laboratory, centrifugated, aliquoted, and stored at −80°C until assayed.
Protein profiling
We determined 92 oncology-associated protein biomarker levels involved in tumorigenesis using the Proseek Multiplex Oncology II immunoassay panel (Olink Bioscience; Table 2, Supplementary Table 2). The selected biomarkers mirror different biological mechanisms, such as angiogenesis, cell signaling, cell cycle control, and inflammation. Patient information was blinded to the Olink Bioscience personnel who processed the samples according to their manual, checked the quality of the output data, and normalized the measurement results.
List of biomarkers analyzed using the proximity extension assay with the Olink Oncology II© panel.

Bold-faced values have a p value of <0.1. IQR: interquartile range; HR: hazard ratio using a continuous value; 95% CI: 95% confidence interval.
The false discovery rate was used for multiple test correction.
U/mL.
In PEA, 1 µL of the sample was incubated with oligonucleotide-marked antibodies pair-bound to the fitting targets. 8 In brief, pairs of oligonucleotide-labeled antibody probes bind to their targeted protein, and if the two probes are brought in close proximity, the oligonucleotides will hybridize in a pair-wise manner. The addition of a DNA polymerase leads to a proximity-dependent DNA polymerization event, generating a unique PCR target sequence. The resulting DNA sequence is subsequently detected and quantified using a microfluidic real-time PCR instrument (Biomark HD, Fluidigm Corporation, San Fransisco, USA).
Data normalization of protein profiling
The concentrations of the biomarkers were determined as the relative quantification using the normalized protein expression (NPX). Normalization was performed by subtracting extension control Ct values and interplate control Ct values from the analyte Ct values. A run time specific correction factor was used to correct for normal background level. NPX is an arbitrary unit on a log2 scale, inverted to that of the raw quantification scale. Accordingly, the calculated relative NPX values are not comparable, as they are calculated differently for separate analytes. An NPX measurement allows us to identify changes for individual protein levels across a unique sample set, thus allowing the use of data to establish protein signatures.
Statistics
The endpoint for the prognostic evaluation was disease-specific survival (DSS), defined as the period of time from surgery until death from disease. We used the biomarkers as continuous variables in the univariate Cox regression analyses, and the false discovery rate (FDR) was used for multiple test adjustment. 11 For the Kaplan–Meier analyses, we dichotomized the variables using the median as the cut-off point. Biomarkers with p < 0.1 in univariate Cox regression after FDR adjustment were included in the multivariate forward-stepping Cox regression (enter criterion p < 0.05, removal p > 0.1) with age, gender, and the Dukes stage as the background variables. Estimates for the time-dependent receiver operating characteristic (ROC) curves and area under the curves (AUC) were calculated using the timeROC package in R.
The linearity of the hazard ratios (HRs) over the biomarker concentration was examined by transforming the concentration to restricted cubic splines and analyzing the nonlinearity in R with analysis of variance. Only three biomarkers showed some indication of nonlinearity (syndecan 1 (SYND1), CD48, and hk8); we then split these into three categories (cut-off at the local minimum or maximum) in the multivariate selection process, while others were used as continuous variables. Survival time was estimated using the Kaplan–Meier method according to the biomarker levels. We used the Mann–Whitney U test to test differences between groups for continuous variables.
We calculated two-sided p values and considered p < 0.05 as statistically significant. Statistical evaluations were completed using IBM’s statistical software (IBM SPSS Statistics©, version 25, International Business Machines Corp., Armonk, NY, USA) and R version 3.4.3 (Foundation for Statistical Computing, Vienna, Austria).
Results
Univariate survival analysis
Out of the 92 biomarkers analyzed, 11 yielded p < 0.1 in the univariate Cox regression analysis after FDR correction (Table 2). We also calculated the serum levels as continuous values. Among these, eight biomarkers were statistically significant (p < 0.05). Patients with low levels of kallikrein 13 (KLK13) and high levels of the following biomarkers had a poor prognosis: amphiregulin (AREG), carcinoembryonic antigen-related adhesion molecule 5 (CEACAM5), interleukin 6 (IL6), mucin 16 (MUC-16), SYND1, transforming growth factor alpha (TGF-alpha) and vimentin (VIM).
Multivariate survival analysis
In the multivariate analysis with the conditional forward-step Cox regression model, two biomarkers remained as independent prognostic markers: KLK13 and MUC-16. A multivariable Cox regression model that included the clinical pathological variables gender, age over 67, and the Dukes stage served as the baseline model for 6–48 months following primary surgery, yielding integrated time-dependent AUC at 36 months of 0.763 (95% CI: 0.669–0.856). Retaining the baseline model variables as the reference with a conditional forward-step model, only MUC-16 (HR: 2.11; 95% confidence interval (CI): 1.52–2.92; p < 0.001) and KLK13 (HR: 0.37; 95% CI: 0.23–0.60; p < 0.001) served as independent prognostic markers, numerically increasing time-dependent AUC at 36 months to 0.860 (95% CI: 0.786–0.934).
MUC-16 association analysis
The MUC-16 levels were significantly lower in patients with stage A–B disease when comparing patients with stage C–D disease (Mann–Whitney U test, p = 0.037, Supplementary Table 3). We observed no other associations between MUC-16 and clinicopathological variables.
MUC-16 univariate survival analyses
In the survival analyses, we dichotomized the MUC-16 levels using the median for the Kaplan–Meier survival analysis and the continuous values in the Cox regression analysis. Patients with high MUC-16 had a poor prognosis (HR: 1.91; 95% CI: 1.45–2.53; p < 0.001; Figure 1). Patients with right-sided disease had a poor prognosis when the MUC-16 level was high (HR: 2.89; 95% CI: 1.75–4.76; p < 0.001; Figure 2(a), Table 3). Among patients with left-sided disease, prognosis was poor for those with high MUC-16 levels (HR: 1.48; 95% CI: 1.02–2.15; p = 0.041; Figure 2(b), Table 3). Patients with stage A–B had a poor prognosis when the MUC-16 level was high (HR: 2.95; 95% CI: 1.46–5.95; p = 0.003; Figure 2(c), Table 3). Furthermore, patients with stage C–D had a poor prognosis with high MUC-16 levels (HR: 1.66; 95% CI: 1.20–2.29; p = 0.002; Figure 2(d), Table 3). Among patients with non-mucinous adenocarcinoma–type tumors, those with high MUC-16 had a poor prognosis (HR: 2.00; 95% CI: 1.50–2.68; p < 0.001; Figure 2(e), Table 3), but we found no difference among patients with mucinous tumors (HR: 1.32; 95% CI: 0.56–3.13; p = 0.522; Figure 2(f), Table 3).

Disease-specific survival according to the MUC-16 levels based on the log-rank test (Kaplan–Meier).

Disease-specific survival according to MUC-16 subgroup analyses (Kaplan–Meier). The cohort was dichotomized using the median MUC-16 values. (a) Subgroup analysis for right-sided disease, with the division based on the splenic flexure. (b) Subgroup analysis for left-sided disease. (c) MUC-16 levels for Dukes stages A–B. (d) MUC-16 levels for Dukes stages C–D. (e) MUC-16 levels in patients with non-mucinous adenocarcinoma tumors. (f) MUC-16 levels in patients with mucinous tumors. p values reported for the log-rank test.
Univariate hazard ratio for disease-specific survival for colon cancer patient subgroups according to the MUC-16 levels. a

HR: hazard ratio using the continuous value; 95% CI: 95% confidence interval.
MUC-16 dichotomized using the median value.
p value for the log-rank test.
KLK13 association analysis
We observed no associations between KLK13 and clinicopathological variables (Mann–Whitney U test; Supplementary Table 2).
KLK13 univariate survival analyses
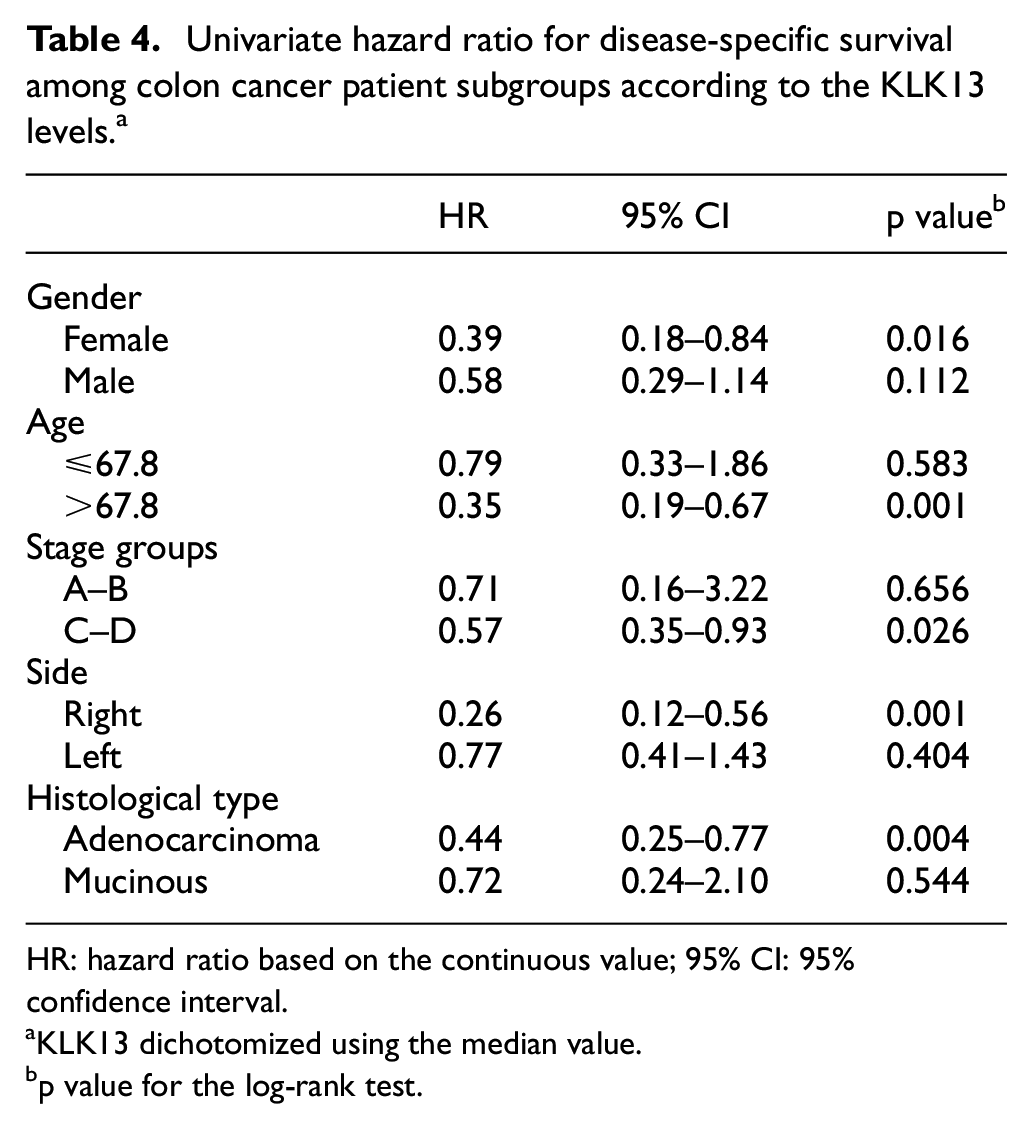
In the survival analyses, we dichotomized the KLK13 levels using the median for the Kaplan–Meier survival analysis and the continuous values used in the Cox regression analysis. Patients with low levels of KLK13 had a poor prognosis (HR: 0.48; 95% CI: 0.29–0.79; p = 0.004; Figure 3). Table 4 lists the subgroup analyses. Among patients with right-sided disease, low levels of KLK13 served as a poor prognostic factor (HR: 0.26; 95% CI: 0.12–0.56; p = 0.001; Figure 4(a)), but we observed no difference among patients with left-sided disease (HR: 0.77; 95% CI: 0.41–1.43; p = 0.404; Figure 4(b)). Among patients with stage A–B disease, we found no difference in prognosis based on the KLK13 levels (HR: 0.50; 95% CI: 0.11–2.24; p = 0.498; Figure 4(c)), whereas patients with stage C–D had a poor prognosis when the KLK13 level was low (HR: 0.55; 95% CI: 0.34–0.88; p = 0.013; Figure 4(d)). Patients with non-mucinous adenocarcinoma tumors had a poor prognosis when the KLK13 level was low (HR: 0.44; 95% CI: 0.25–0.77; p = 0.004; Figure 4(e)), whereas we observed no difference in mucinous tumors according to the KLK13 level (HR: 0.72; 95% CI: 0.24–2.10; p = 0.544; Figure 4(f)).
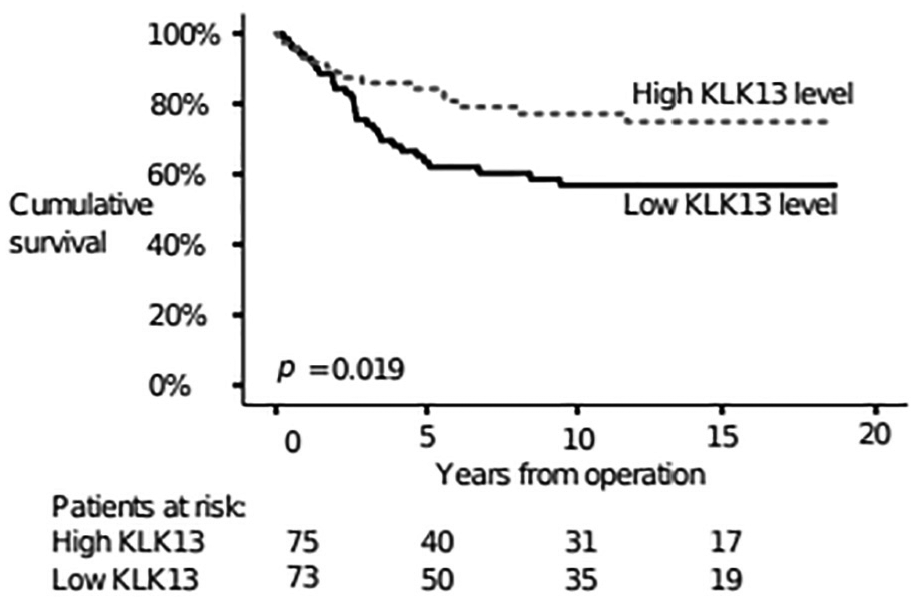
Disease-specific survival according to KLK13 levels using the log-rank test (Kaplan–Meier).
Univariate hazard ratio for disease-specific survival among colon cancer patient subgroups according to the KLK13 levels. a
HR: hazard ratio based on the continuous value; 95% CI: 95% confidence interval.
KLK13 dichotomized using the median value.
p value for the log-rank test.

Disease-specific survival according to the KLK13 subgroup analyses (Kaplan–Meier). KLK13 was dichotomized using the median value. (a) KLK13 levels for right-sided disease. (b) KLK13 levels for left-sided disease. (c) KLK13 levels for Dukes stages A–B. (d) KLK13 levels for Dukes stages C–D. (e) KLK13 levels in patients with non-mucinous adenocarcinoma tumors. (f) KLK13 levels in patients with mucinous tumors.
Discussion
This study aimed to screen for better biomarkers for CC prognosis using the Proseek Multiplex Oncology II panel. Using this tool, we studied 92 potential biomarkers in 148 CC patients and identified two independent prognostic biomarkers: MUC-16 and KLK13.
Patients with high levels of MUC-16 and low levels of KLK13 had a poor prognosis, which we also observed in subgroups of patients with right-sided disease and those with an adenocarcinoma histology. Furthermore, prognosis remained poor in the subgroups of patients with low KLK13 levels and right-sided disease or an adenocarcinoma-type tumor. The difference in the expressions of MUC-16 and KLK13 between right- and left-sided diseases agrees with results indicating differences in survival, gene expression, marker levels, and tumor size. 12 Specifically, right-sided disease obtained a poorer survival, lower expression of endothelial growth factor receptor (EGFR), and larger tumors than left-sided disease.12,13 Because the molecular and histological subtypes of right- and left-sided CRC differ conspicuously, more so than between rectal cancer and CC, this finding underlines this difference even further. 13
Mucins are a glycoprotein family constituting a major component of the mucosal cell lining, thought to serve as a protective and lubricating barrier against infectious agents and other particles. 14 One member of the mucin family, MUC-16, is also known as carbohydrate antigen 125 (CA 125), a tumor marker in clinical use in ovarian cancer patients for follow-up and monitoring. 15 Mesothelial cells of the peritoneum, pleura, pericardium, and endometrium, among others, emit CA 125. When these epithelia are damaged and change through the peritoneal dissemination of CRC, CA 125 levels tend to rise. 16 In the tumorigenesis of adenocarcinomas of the lung, pancreas, and breast, MUC-16 plays an active role in cell proliferation and migration, as well as in the inhibition of apoptosis and resistance to cispalatin both in vivo and in vitro. 17 However, in their systematic review, MUC-16 did not play a role in CRC, contradicting the findings we report here. This may be partly explained by the refined PEA method used in this study, which detected even small changes in marker levels.
In a study among 853 CRC patients with peritoneal dissemination, those with high levels of serum CA 125 at the time of diagnosis had a poor prognosis. 16 Giessen-Jung et al. 6 studied CA 125 from preoperative serum samples in 472 CC patients by electrohemiluminescent immunoenzymometric assays, where CA 125 did not present any prognostic value. The reason to the difference in our results could be in different assay analyzation methods. In serous ovarian cancer diagnosis and follow-up, high or rising levels of CA 125 indicate pathology, relapse, or disseminated disease. 18 Expression of MUC-16 differs also in tumor histology in ovarian cancer. 19 We are not able to conclude if there is a difference in MUC-16 expression between non-mucinous and mucinous colon adenocarcinomas, as our mucinous tumor sample is quite small. Since the results in our multiplex immunopanel are relative, the NPX ratios for MUC-16/CA 125 are not directly comparable to the absolute CA 125 values. Furthermore, since the glycosylation conformation of MUC-16/CA 125 originating from benign sources or ovarian cancer cells varies, it remains unknown if the glycosylation conformation change impacts the determination of MUC-16/CA 125 in CRC. 20 Thus, the next step will consist of validating our results using enzyme-linked immunosorbent assay (ELISA) for MUC-16 and comparing the results with CA 125 determinations from the same patient cohort.
Kallikreins are hormone-regulated serine proteases with both tumor-promoting and tumor-suppressive effects.21,22 KLK3, the most well-established kallikrein, is known as a prostate-specific antigen (PSA). PSA is used in prostate cancer follow-up, whereby elevated levels indicate activation of disease. Talieri et al. 23 investigated KLK13 in the cytosolic extract of 122 CC patients using immunofluorimetry finding that high levels of KLK13 carried a poor prognosis. However, the patients in our study with high levels of KLK13 had a good prognosis. Furthermore, our methods differed, since we analyzed KLK13 levels using PEA rather than immunofluorimetry. Thus, KLK13 levels and results may vary.
In oral squamous carcinoma cells, downregulation of KLK13 facilitates tumor invasiveness and metastasis. 24 In 88 malignant esophageal squamous cell carcinoma tumor patients, those showing a high expression of KLK13 had a poor prognosis. 25 Therefore, the role of KLK13 differs depending on cancer type, perhaps due to its central role in the KLK signal cascade, although its role in carcinogenesis remains unclear.26,27
Previously, White et al. 28 proposed using the KLK13 and MUC-16 markers concurrently to detect early stage ovarian cancer after finding elevated levels of KLK13 and MUC-16/CA 125, as well as elevated KLK13 and MUC-16 mRNA levels, in immunohistochemistry staining among 106 ovarian cancer patients. In our study on CC patients, the KLK13 levels were low and the MUC-16/CA 125 levels were high in patients with a poor prognosis. In particular, we note that the MUC-16 mRNA levels and MUC-16/CA 125 protein levels are not directly comparable.
One specific advantage of the PEA method is the small amount of serum needed, as well as the ability to analyze a large number of biomarkers in a short period of time. Furthermore, due to its oligonucleotide overlapping features, the sensitivity and specificity of PEA remains superior to conventional PCR. 8 However, the values determined using the PEA multiarray analysis are relative and, therefore, cannot be directly compared to the absolute values of different biomarkers or values obtained from another panel. Chen et al. 9 used the same multiarray PEA method to detect early stage CRC in a screening setting with good results. Alas, since we used a different panel of markers, the results cannot be directly compared.
Furthermore, the ratio between cases and variables is rather larger, representing a major limitation to this study. In addition, the Olink panel lacks established oncological biomarkers, such as CEA and CA19-9.
We included 148 patients in our sample, consisting solely of CC patients, in order to obtain a more homogeneous material. Screening can be carried out on a small patient cohort, for which PEA represents a remarkable tool. In order to elaborate upon the role of MUC-16/CA 125 and KLK13 in clinical practice, further validation on a larger sample of patient materials using specific immunoassays determining absolute concentrations are needed.
Conclusion
To conclude, we used PEA as a screening method for potential prognostic biomarkers in CC. In this preliminary study, we found that MUC-16/CA 125 and KLK13 served as independent prognostic markers of CC, whereby patients with elevated levels of MUC-16 and those with low levels of KLK13 had a poor prognosis. Our results must be validated in larger patient cohorts and compared with CEA and CA19-9, which are not included in the panel we used.
Supplemental Material
Supplementary_table_1 – Supplemental material for Mucin 16 and kallikrein 13 as potential prognostic factors in colon cancer: Results of an oncological 92-multiplex immunoassay
Supplemental material, Supplementary_table_1 for Mucin 16 and kallikrein 13 as potential prognostic factors in colon cancer: Results of an oncological 92-multiplex immunoassay by Kajsa Björkman, Harri Mustonen, Tuomas Kaprio, Caj Haglund and Camilla Böckelman in Tumor Biology
Supplemental Material
Supplementary_Table_2 – Supplemental material for Mucin 16 and kallikrein 13 as potential prognostic factors in colon cancer: Results of an oncological 92-multiplex immunoassay
Supplemental material, Supplementary_Table_2 for Mucin 16 and kallikrein 13 as potential prognostic factors in colon cancer: Results of an oncological 92-multiplex immunoassay by Kajsa Björkman, Harri Mustonen, Tuomas Kaprio, Caj Haglund and Camilla Böckelman in Tumor Biology
Supplemental Material
Supplementary_table_3 – Supplemental material for Mucin 16 and kallikrein 13 as potential prognostic factors in colon cancer: Results of an oncological 92-multiplex immunoassay
Supplemental material, Supplementary_table_3 for Mucin 16 and kallikrein 13 as potential prognostic factors in colon cancer: Results of an oncological 92-multiplex immunoassay by Kajsa Björkman, Harri Mustonen, Tuomas Kaprio, Caj Haglund and Camilla Böckelman in Tumor Biology
Footnotes
Acknowledgements
The authors thank Päivi Peltokangas for the excellent technical assistance.
Author contributions
C.B. and C.H. conceived the study topic and design. C.H. collected the sera, while C.H., C.B., and T.K. collected and processed the data. K.B., C.B., H.M., and C.H. analyzed and interpreted the data. K.B. and C.B. drafted the manuscript. All authors agreed to the content of the manuscript and revised and provided their final approval to the current version of the manuscript.
Data access
The data can be obtained upon request from the corresponding author.
Declaration of conflicting interests
The author(s) declared no potential conflicts of interest with respect to the research, authorship, and/or publication of this article.
Ethical approval
The Ethics Committee at the University of Helsinki approved the study protocol (226/E6/2006, extension 17.4.2013). The National Supervisory Authority of Welfare and Health approved the retrospective study (Valvira Dnro 10041/06.01.03.01/2012). Furthermore, patients provided their written informed consent upon inclusion in the study.
Funding
The author(s) disclosed receipt of the following financial support for the research, authorship, and/or publication of this article: The study was financially supported by the Faculty of Medicine at the University of Helsinki (C.B.), the Competitive State Research Financing of the Expert Responsibility of Helsinki University Hospital (C.H.), the Finnish Cancer Foundation (C.H. and T.K.), Finska Läkaresällskapet (K.B. and C.H.), and the Sigrid Jusélius Foundation (C.H.). The funders played no role in the design of the study, analysis, the interpretation of data, or in writing the manuscript.
Supplemental material
Supplemental material for this article is available online.
References
Supplementary Material
Please find the following supplemental material available below.
For Open Access articles published under a Creative Commons License, all supplemental material carries the same license as the article it is associated with.
For non-Open Access articles published, all supplemental material carries a non-exclusive license, and permission requests for re-use of supplemental material or any part of supplemental material shall be sent directly to the copyright owner as specified in the copyright notice associated with the article.