
Abstract
Prostate cancer represents a major cause of cancer death in men worldwide. Novel non-invasive methods are still required for differentiation of non-aggressive from aggressive tumors. Recently, changes in prostate-specific antigen glycosylation pattern, such as core-fucosylation, have been described in prostate cancer. The objective of this study was to evaluate whether the core-fucosylation determinant of serum prostate-specific antigen may serve as refined marker for differentiation between benign prostate hyperplasia and prostate cancer or identification of aggressive prostate cancer. A previously developed liquid chromatography–mass spectrometry/mass spectrometry–based strategy was used for multiplex analysis of core-fucosylated prostate-specific antigen (fuc-PSA) and total prostate-specific antigen levels in sera from 50 benign prostate hyperplasia and 100 prostate cancer patients of different aggressiveness (Gleason scores, 5–10) covering the critical gray area (2–10 ng/mL). For identification of aggressive prostate cancer, the ratio of fuc-PSA to total prostate-specific antigen (%-fuc-PSA) yielded a 5%–8% increase in the area under the curve (0.60) compared to the currently used total prostate-specific antigen (area under the curve = 0.52) and %-free prostate-specific antigen (area under the curve = 0.55) tests. However, our data showed that aggressive prostate cancer (Gleason score > 6) and non-aggressive prostate cancer (Gleason score ≤ 6) could not significantly (p-value = 0.08) be differentiated by usage of %-fuc-PSA. In addition, both non-standardized fuc-PSA and standardized %-fuc-PSA had no diagnostic value for differentiation of benign prostate hyperplasia from prostate cancer. The %-fuc-PSA serum levels could not improve the differentiation of non-aggressive and aggressive prostate cancer compared to conventional diagnostic prostate cancer markers. Still, it is unclear whether these limitations come from the biomarker, the used patient cohort, or the imprecision of the applied method itself. Therefore, %-fuc-PSA should be further investigated, especially by more precise methods whether it could be clinically used in prostate cancer diagnosis.
Keywords
Introduction
Prostate cancer (PCa) is the second most frequently diagnosed cancer and the fifth leading cause of cancer death in men, representing a major public health concern worldwide. In 2012, globally 1.1 million estimated new cases were reported and approximately 307,500 men died from PCa. 1 These counts are expected to increase to nearly 1.7 million new PCa cases and 500,000 deaths until 2030. 2 Incidence rates of PCa vary by more than 25-fold worldwide, in which approximately 75% of the registered cases occur in developed countries, largely due to the broad use of prostate-specific antigen (PSA) testing and subsequent biopsy in those regions. 3 The risk to develop PCa increases with advanced age, Black race, familial predisposition, and certain genetic changes. 3
First indications of PCa can be obtained by digital rectal examination (DRE) and screening of PSA serum levels. The increase of total PSA representing abnormalities in prostate gland structure and vascularization has been associated with PCa since the mid-1980s. 4 Today, PSA serum levels are known to be elevated as well in situations including benign prostate hyperplasia (BPH), prostatitis, or extrinsic manipulations of the prostate, for example, by bicycling or catheterization. 5 As a consequence, PSA testing lacks in specificity and results in an alarming number of false-positive readings, especially when PSA values fall within the critical “gray area” ranging from 4 to 10 ng/mL leading to the risk of overdiagnosis and overtreatment with adverse side effects. 6 On the other hand, low non-diagnostic PSA serum concentrations were detected in men with aggressive PCa. 7 Several authors actually proposed to lower the PSA cut-offs to 1.5 or 2.6–4 ng/mL to enhance the likelihood for early detection of curable PCa (Early Warning PSA-zone, EWP Zone).8–10 Still, there is no clear PSA cut-off with simultaneous high sensitivity and high specificity for differentiation of benign from cancerous conditions or non-aggressive from aggressive PCa forms. 11 Only aggressive PCa need immediate treatment, while observation might be sufficient for patients with non-aggressive PCa. Thus, new or refined biomarkers detecting clinically significant and aggressive PCa are highly demanded.
In the past, numerous approaches have been proposed in order to tackle the limitations of PSA testing such as using of age-specific PSA cut-offs, normalizing PSA to the prostate volume (PSA density), and monitoring PSA kinetics in serum including PSA velocity (PSAV) and PSA doubling time (PSA-DT).12–14 However, only small improvements in predictive value have been found among these efforts. Improvements in the analysis of various molecular forms of PSA in serum have allowed the measurement of free PSA and its distinct cleavage isoforms pro-PSA and BPH-associated PSA (BPSA).15–17 Other forms include complexed PSA which is bound to serum proteins mainly to α1-antichymotrypsin and α2-macroglobulin. 18 The ratio of free PSA to total PSA (%-free PSA), which was shown by Catalona et al. to be decreased in PCa compared to BPH, has been approved by the Food and Drug Administration (FDA) as an adjunct to total PSA in men with total PSA serum concentrations between 4 and 10 ng/mL. 19 Although %-free PSA slightly improved the ability to distinguish between PCa and BPH, the most appropriate %-free PSA cut-off value remains debatable and the identification of non-aggressive and aggressive PCa is still not feasible. From a medical point of view, it means that the final decision in PCa diagnosis still necessitates histopathological verification of adenocarcinoma in prostate cores derived from transrectal ultrasound (TRUS)-guided biopsy or in specimens obtained from transurethral resection of the prostate (TURP) or prostatectomy for benign prostatic enlargement. 20 These techniques are invasive and cause embarrassment or discomfort to patients. 2 An important part of the decision-making process concerning the need for active treatment or surveillance alone is the Gleason score (GS) grading system in which GS ≤ 6 are regarded as low-risk cancer and GS > 6 as intermediate/high-risk cancer. 21 However, early-stage PCa detection is challenging as the majority of prostatic cancers are slow growing and asymptomatic. 22 Besides GS, the reproducibility of which is not optimal, and PSA testing, a few new prognostic tests are now commercially available for PCa management.23,24 An urinary assay for Prostate Cancer Antigen 3 (PCA3), a prostate-specific, non-coding messenger RNA (mRNA) biomarker obtained after prostatic massage during DRE, appears to be useful for detection in men with elevated PSA but its usefulness for differentiation between non-aggressive and aggressive PCa is uncertain.25,26 The Prostate Health Index (PHI) test combines free, total, and the (-2)pro-PSA into a single score. The 4Kscore test measures a panel of four kallikreins (free PSA, total PSA, intact PSA, and kallikrein-like peptidase 2 (hK2)) Both tests are intended to reduce the number of unnecessary prostate biopsies in PSA-tested men and demonstrated to outperform PCa detection by %-free PSA.27,28 These examples reveal that new markers in combination with conventional PSA are providing promise to aid in PCa diagnosis.
The focus in the research community currently has been on discovering non-invasive markers derived from proteins, tumor cells, or nucleic acids in the blood or urine of patients with PCa.22,29–33 Among these targets, glycosylated proteins play an emerging role as it was shown that altered glycosylation patterns can be linked to oncologic malignancies such as breast, liver, colon, or prostate cancer.34–37 PSA also known as human kallikrein 3 (KLK3) is a 28- to 32-kDa glycoprotein approximately containing 8% (m/m) carbohydrates attached to a single N-glycosylation site at asparagine-69.38,39 Changes in glycosylation of PSA associated with PCa development and progression have been analyzed in several foundational studies focusing on human samples of different origin including prostate tissue, cell lines, seminal fluid, urine, and serum.40–44 These studies span the breadth from whole glycoform profiling to targeted analysis of single glycan modifications such as terminal sialylation or site-specific core-fucosylation.6,45 With regard to the evaluation of glycosylation changes of PSA in human serum as prognostic and diagnostic marker for PCa, some of these assays lack in sensitivity for usage in the critical gray area ranging from 4 to 10 ng/mL total PSA or have not been tested using statistically significant sample numbers. In summary, currently there is no non-invasive diagnostic tool that can distinguish non-aggressive from aggressive tumors which would be of particular importance as recently shown by Wilt et al. after 20 years follow-up for PIVOT (Prostate Cancer Intervention versus Observation Trial).40,46 Among men with localized PCa of different risk, surgery did not demonstrate significantly higher overall or PCa survival than observation, but was associated with higher frequency of adverse side effects such as urinary incontinence and erectile dysfunction.
The aim of this study is to assess the potential diagnostic value of core-fucosylated PSA (fucPSA) as biomarker for differentiation of BPH and PCa and for identification of aggressive PCa. For this purpose, we used a patient cohort comprising 150 samples categorized into three groups: (1) BPH, (2) non-aggressive PCa (GS ≤ 6), and (3) aggressive PCa (GS > 6). In order to analyze the above specimens, we applied an endoglycosidase-assisted liquid chromatography–mass spectrometry/mass spectrometry (LC-MS/MS)-based strategy for the analysis of fuc-PSA in the low ng/mL range in human serum which was previously developed. 47
Materials and methods
Reagents and materials
Streptavidin-coated magnetic particles (Ref. 11641786001), biotinylated monoclonal antibody PSA36 against total PSA (= free + complexed PSA) binding to epitope 6b, 48 total PSA CalSet II (Ref. 04485220190), and PC TM1 control solution of the PreciControl Tumor Marker set (Ref. 11776452122) were obtained from Roche Diagnostics GmbH (Mannheim, Germany). Phosphate-buffered saline (PBS), trypsin from porcine pancreas, tween 20, and ammonium bicarbonate (ABC) were purchased from Sigma-Aldrich (St. Louis, USA). Endoglycosidase F3 (Endo F3) from Elizabethkingia meningoseptica was obtained from Ludger Ltd (Oxfordshire, UK). Anhydrous sodium acetate and glacial acetic acid were from Merck (Darmstadt, Germany). Acetonitrile (ACN) and formic acid (FA) both ULC/MS grade were purchased from Biosolve (Dieuze, France).
Preparation of calibrators and control samples
Calibrator solutions were prepared using total PSA CalSet II, which contains calibrator 1 and 2 consisting of human PSA in female serum matrix at 0 and 60 ng/mL total PSA, respectively. The fucosylation degree of PSA spiked in calibrator 2 was determined to be 78% by in-house LC-MS Nglycan analysis at Roche Diagnostics GmbH (Penzberg, Germany). Based on the two stock calibrators 1 and 2, five calibrator solutions Cal A, B, C, D, and E were prepared at total PSA concentrations of 1, 3, 6, 9, and 12 ng/mL. Taking the fucosylation degree of 78% into account, the fuc-PSA concentrations of Cal A-E were calculated to be 0.78, 2.34, 4.67, 7.02, and 9.36 ng/mL. The PC TM1 control solution of the PreciControl Tumor Marker set served as a control sample during the entire study. Both calibrator solutions and the control sample were aliquoted and stored at 20°C until analysis.
Patient samples
Serum samples were obtained from 50 BPH patients and 100 PCa patients provided by the HELIOS Klinikum Berlin-Buch, Charité Berlin, Urologische Klinik and Klinikum Ludwigshafen (all located in Germany), following the standard operating procedures of their Ethics Committee. Informed written consent was obtained from all subjects participating in the study. Total PSA serum levels of all samples were between 2 and 10 ng/mL (Table 1). Serum samples were collected before any diagnostic procedure was started and stored at −80°C until analysis. Repeated freezing and thawing was avoided. PCa diagnosis was verified using TRUS-guided biopsy and/or adenomectomy/radical prostatectomy followed by histopathological analysis.
Clinical and pathological characteristics of 150 patient samples.

BPH: benign prostate hyperplasia; PCa: prostate cancer; GS: Gleason score (used from pathology, if not available from biopsy); SD: standard deviation; tPSA: total PSA serum level; fPSA: free PSA serum level.
BPH patients (age range, 47–80 years) had total PSA serum levels ranging from 2.03 to 9.13 ng/mL (average of 5.12 ng/mL) and free PSA serum levels ranging from 0.18 to 2.52 ng/mL (average of 1.03 ng/mL). PCa patients were classified according to the GS grading system following the general guidelines of the European Association of Urology. GS were used from pathological examination or if not available from biopsy. Patients with GS ≤6 were assigned to the non-aggressive PCa group and patients with GS >6 were assigned to the aggressive PCa group as reported previously. 49 Hence, out of the 100 PCa patients, 50 patients (age range, 49–78 years) were classified as non-aggressive PCa with total PSA serum levels ranging from 2.49 to 9.95 ng/mL (average of 5.82 ng/mL) and free PSA serum levels ranging from 0.28 to 1.86 ng/mL (average of 0.80 ng/mL) and 50 patients (age range, 52–75 years) were classified as aggressive PCa with total PSA serum levels ranging from 2.90 to 9.92 ng/mL (average of 5.86 ng/mL) and free PSA serum levels ranging from 0.21 to 1.95 ng/mL (average of 0.76 ng/mL). In nine patients of the non-aggressive PCa group (n = 50) and in six patients of the aggressive PCa group (n = 50), cell patterns associated with both BPH and PCa were observed in tissue samples derived from different regions of the prostate.
Quantification of total and free PSA by ECLIA
Total and free PSA levels of patient samples, calibrator solutions, and the control sample were measured using commercially available Elecsys® total PSA electro-chemiluminescence immunoassay (ECLIA) on the
LC-MS/MS-based analysis of total PSA and core-fucosylated PSA (fuc-PSA)
The method used for quantification of total PSA and its core-fucosylated subpopulation applying immunoaffinity enrichment, two enzymatic steps, and LC-MS/MS analysis is described in detail in a related manuscript. 47 Briefly, biotinylated anti-PSA antibody PSA36 was bound to streptavidin-coated magnetic particles. Afterward, 100 µL of serum sample was added to the antibody-bound magnetic particles to enrich total PSA from the complex serum matrix. By means of a magnet separator (DynaMag™-2 Magnet), the supernatant was removed and magnetic particles were washed to remove non-specifically bound serum contaminants. Enriched PSA, still captured by the immunoaffinity complex, was partially deglycosylated using Endo F3 in order to reduce glycosylation complexity which greatly simplified subsequent tryptic digestion for generating surrogate peptides. The supernatant was transferred to a new vial, dried in a vacuum concentrator (Eppendorf concentrator 5301), and re-dissolved for LC-MS/MS analysis. Finally, total PSA and fuc-PSA were analyzed by measuring peptide LSEPAELTDAVK and glycopeptide N(GlcNAc + Fuc)K, respectively, using an Infinity 1290 UHPLC from Agilent Technologies (Santa Clara, USA) connected to a QTRAP 6500 MS instrument equipped with TurboV™ Ion Source from AB Sciex (Darmstadt, Germany). This method allows for quantification of fuc-PSA and total PSA down to 1 and 0.5 ng/mL, respectively. The interday precision of the method is 9.7%–23.2% for fuc-PSA and 10.3%–18.3% for total PSA depending on the PSA level.
Study design
In this study, up to 36 samples were analyzed per day, including calibrator solutions, control samples, and patient samples. On each of the 19 study days, samples were measured in the following sequence order: two blanks (ACN containing 0.1% FA), sample for system suitability pre-test (neat PSA-derived peptide solution), blank, calibrator solutions Cal A-D, control sample, patient samples, calibrator solutions Cal A-D, control sample, blank, sample for system suitability post-test, and two blanks. Three replicates of each patient sample were randomly distributed on the 19 study days and individually analyzed. In total, 678 single measurements consisting of 190 calibrator solutions, 38 control samples, and 450 patient samples were performed.
Data analysis and statistics
Total PSA and fuc-PSA were analyzed by peak integration of their respective surrogate peptides LSEPAELTDAVK and N(GlcNAc + Fuc)K using Analyst software (Version 1.6.2, AB Sciex). Automatic peak integration was performed by the IntelliQuant integration algorithm. Peaks were integrated manually, if peak assignment was incorrect or peak integration was inadequate. Using calibrator solutions Cal A-E, calibration curves for total PSA and fuc-PSA were generated by plotting peak areas of their respective surrogate peptides LSEPAELTDAVK and N(GlcNAc + Fuc)K (y) against respective analyte concentrations (x). As described before, on each study day, one set of calibrator solutions Cal A-E was analyzed at the beginning and one set at the end of a LC-MS/MS sequence (calibrator bracketing) giving two calibration curves for total PSA and two for fuc-PSA. Both calibrator sets were taken together, resulting in average calibration curves for total and fuc-PSA, which were used for calculation of total and fuc-PSA concentrations of patient samples and control samples. Method comparison using total PSA serum levels measured by LC-MS/MS and ECLIA was performed by Deming Regression using software JMP 12.1.0. The %-core-fucosylated PSA of each patient was calculated as the median of fuc-PSA serum levels divided by the median of total PSA serum levels obtained from three LC-MS/MS replicates (%-fuc-PSA-MS). The median of fuc-PSA serum levels obtained by LC-MS/MS analysis was also standardized to total PSA serum levels measured by ECLIA (%-fuc-PSA-ECLIA). Patients were divided into three groups: (1) BPH, (2) non-aggressive PCa, and (3) aggressive PCa. Receiver-operating characteristic (ROC) curves and box plot diagrams were prepared using the free software R 3.2.2 available at https://www.R-project.org in order to evaluate the diagnostic value of fuc-PSA for differentiation of PCa patients from participants with BPH. ROC curves were also used to investigate the diagnostic value of fuc-PSA with regard to the aggressiveness of PCa according to the GS which were used as the boundary between non-aggressive (GS ≤ 6) and aggressive PCa (GS > 6). Standardized (%-fuc-PSA) and non-standardized core-fucosylated PSA (fuc-PSA) were compared to free PSA, total PSA, and %-free PSA (= free PSA standardized to total PSA). Differences in clinical groups were tested using the Wilcoxon rank-sum test. Confidence levels for the area under the ROC curve were calculated by the DeLong method. 51
Results
A previously described LC-MS/MS-based method was applied on a patient cohort consisting of 150 specimens in order to evaluate the potential value of core-fucosylated PSA (fuc-PSA) as biomarker for discriminating between BPH and PCa or for identification of aggressive PCa in the low ng/mL concentration range. Total PSA serum levels of patient samples ranged from 2 to 10 ng/mL clearly covering the critical gray area in PCa diagnosis. Each patient sample was measured in triplicate resulting in average coefficients of variation (CV) of 13.9% for fuc-PSA and 8.7% for total PSA. CV values > 20% were observed in 21 out of 150 patient samples for fuc-PSA and in 7 out of 150 patient samples for total PSA. These samples were not excluded from the statistical analysis as we used the median of fuc-PSA and total PSA for data analysis which showed good robustness to outliers.
As mentioned before, all LC-MS/MS measurements were monitored by a control sample which was analyzed in duplicate on each of the 19 study days. The average fuc-PSA concentration over all study days was 3.41 ng/mL with a CV value of 11.4% and the average total PSA concentration was 4.77 ng/mL with a CV value of 7.0%. The measured total PSA concentration was in excellent accordance with results previously determined by ECLIA giving a total PSA concentration of 4.72 ng/mL. The average %-fuc-PSA-MS was 71.5% with a CV value of 9.8%. Comparison of total PSA concentrations of 150 patient samples measured by LC-MS/MS and ECLIA performing a Bland-Altman analysis showed a good agreement between the two methods with a mean bias of 1.9% and a 2S agreement range of ±16.1% (Figure 1). Method comparison using the Deming Regression procedure assuming equal error variances resulted in a regression equation of y = 0.88 x + 0.52. The Spearman’s rank correlation coefficient ρ was 0.98 (Figure 2). As shown in control charts of fuc-PSA, total PSA, and %fuc-PSA-MS, no specific trends could be observed within the 19 study days (Figure 3).

Relative Bland Altman plot for the comparison of total PSA serum concentrations of 150 patients measured by ECLIA and LC-MS/MS. The comparison of results showed a good agreement between the two methods with a mean bias of –1.9% and a 2S agreement range of ±16.1%.
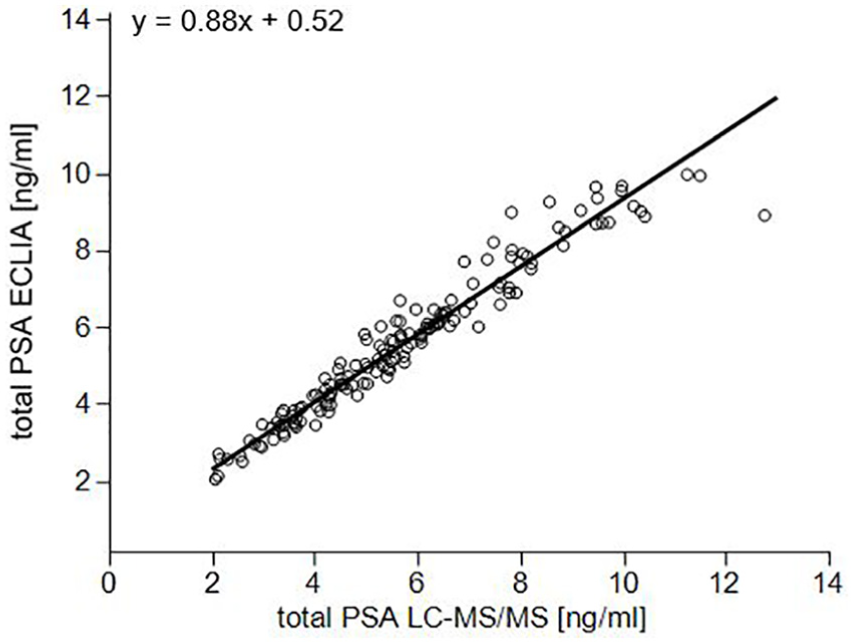
Method comparison using Deming Regression assuming equal error variances obtained by quantitative ECLIA and LC-MS/MS analysis of total PSA serum concentrations of 150 patient samples. The Spearman’s rank correlation coefficient ρ was 0.98.

Control charts of serum levels of (a) core-fucosylated PSA (fuc-PSA), (b) total PSA, and (c) %-core-fucosylated PSA standardized by total PSA from LC-MS/MS (%-fuc-PSA-MS) obtained by repetitive analysis of a control sample at 19 study days. Blue line = mean.
ROC curve analysis was performed using all 150 patient samples in order to investigate the diagnostic value of fuc-PSA for differentiation of BPH (n = 50) from PCa (n = 100) (Table 2). Initially, ROC curve analysis was performed using several serum parameters including non-standardized fuc-PSA (area under the curve (AUC) = 0.58) and standardized %-fuc-PSA-MS (AUC = 0.54) or %-fuc-PSA-ECLIA (AUC = 0.51). These results were compared to the AUC values of free PSA (AUC = 0.63), total PSA (AUC = 0.60), and %-free PSA (AUC = 0.74) measured by ECLIA and revealed that both non-standardized and standardized fuc-PSA had no diagnostic value for differentiation of BPH from PCa compared to conventional diagnostic PCa markers. ROC curves were also used to investigate the predictive power of fuc-PSA in the identification of aggressive PCa (Table 3). The GS was used as a cut-off point between non-aggressive PCa (GS ≤ 6) and aggressive PCa (GS > 6). Results from serum samples of 100 patients diagnosed with PCa showed an AUC = 0.57 for %-fuc-PSA-MS and an AUC = 0.60 for %-fuc-PSA-ECLIA. The AUC values of non-standardized fuc-PSA (AUC = 0.53), free PSA (AUC = 0.52), total PSA (AUC = 0.52), and %-free PSA (AUC = 0.55) were slightly inferior to AUC values obtained by using %-fuc-PSA (Figure 4). As shown in Figure 5, the aggressive PCa group showed slightly decreased %-fuc-PSA values (Q1–Q3: 71%–84%) than non-aggressive PCa patients (Q1–Q3: 74%–90%). This trend could also be observed in Figure 6 illustrating the correlation of %-fuc-PSA from PCa serum samples with their GSs. However, the difference between non-aggressive PCa (GS ≤ 6) and aggressive PCa (GS > 6) using %-fuc-PSA-ECLIA was not statistically significant indicated by the Mann–Whitney–Wilcoxon test (p value = 0.08). The PSA core-fucosylation ratio did not correlate with their total PSA levels and was therefore independent of the total PSA level in each of the patient groups (Figure 7).
AUC values obtained by ROC curve analysis of 50 BPH and 100 PCa patients.

CI: confidence interval; AUC: area under the curve; ROC: receiver-operating characteristic curve; BPH: benign prostate hyperplasia; PCa: prostate cancer; PSA: prostate-specific antigen; MS: mass spectrometry; ECLIA: electro-chemiluminescence immunoassay.
AUC values obtained by ROC curve analysis of 50 non-aggressive PCa (GS ≤ 6) and 50 aggressive PCa (GS > 6) patients.

CI: confidence interval; AUC: area under the curve; ROC: receiver-operating characteristic curve; PCa: prostate cancer; PSA: prostate-specific antigen; GS: Gleason score; MS: mass spectrometry; ECLIA: electro-chemiluminescence immunoassay.

Comparison of ROC curves for free PSA, total PSA, %-free PSA, and %-core-fucosylated PSA standardized to total PSA determined by ECLIA (%-fuc-PSA-ECLIA). The %-fuc-PSA-ECLIA gave the highest AUC value (AUC = 0.60) for differentiation of non-aggressive (GS ≤ 6) and aggressive PCa (GS

Box-plot of %-core-fucosylated PSA standardized by total PSA from ECLIA (%-fuc-PSA-ECLIA) used for differentiation of non-aggressive (GS ≤ 6) and aggressive PCa (GS

Box-plot diagram showing the correlation of %-core-fucosylated PSA standardized by total PSA from ECLIA (%-fuc-PSA-ECLIA) from PCa serum samples with their Gleason score (GS). The center line represents the median. The bottom (Q1) and the top (Q3) of the box represent the 25th and 75th percentiles, respectively.
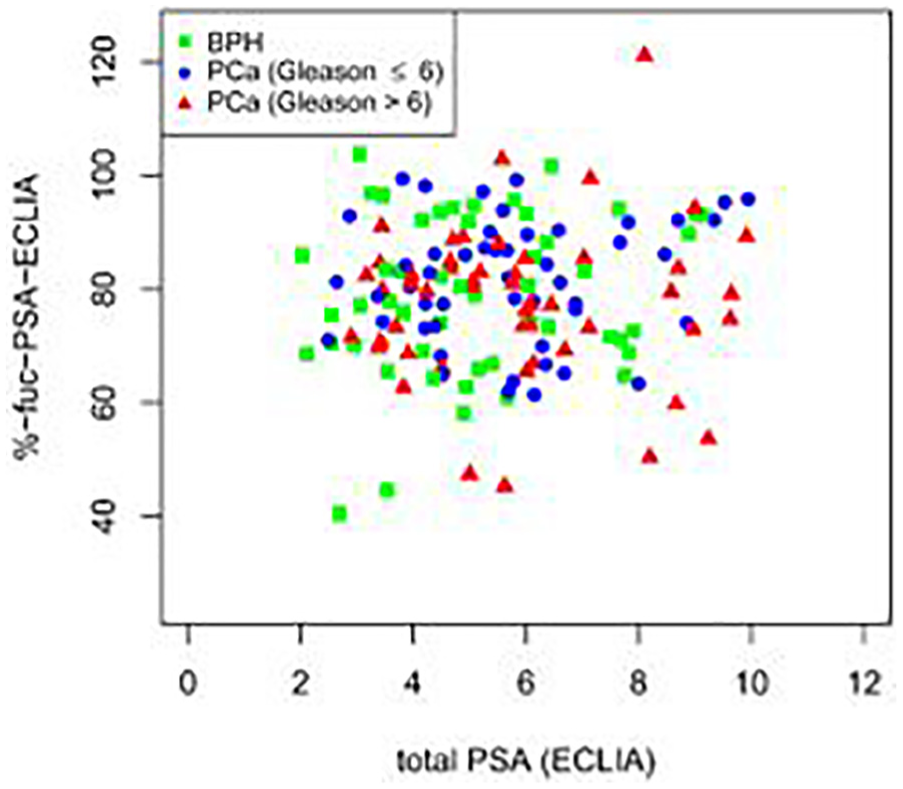
Scatter plot of %-core-fucosylated PSA standardized by total PSA from ECLIA (%-fuc-PSA-ECLIA) against total PSA serum levels measured by ECLIA (n = 150). The PSA core-fucosylation ratio did not correlate with their total PSA levels in none of the patient groups (BPH, non-aggressive PCa, and aggressive PCa).
Discussion
In a cohort of 150 patient samples, measurement of fuc-PSA showed no significantly better diagnostic differentiation between aggressive and non-aggressive PCa in comparison to standard free- and total PSA tests. Several studies, mostly based on enzyme-linked lectin assays (ELLA), have been applied to assess whether differences in terminal or core-fucosylation of PSA in urine, seminal fluid, blood, or tissue enable discrimination of BPH from PCa or identification of aggressive PCa.18,42,52,53 These lectin immunoassays have the same basic format as a standard enzyme-linked immunosorbent assay (ELISA), in which one antibody is replaced by a lectin recognizing carbohydrate moieties. However, reports with contradictory results have been described which might be due to the use of different sample matrices or different lectins (Table 4). For example, a significant decrease of core-fucosylated PSA with an AUC = 0.94 was recently reported by Llop et al. in GS > 6 PCa serum samples using Pholiota squarrosa lectin (PhoSL), while Li et al. found an increase in PSA core-fucosylation in serum of high-risk PCa patients with an AUC = 0.86 using Aleuria aurantia lectin (AAL).6,49
Overview of previous case studies on terminal and core-fucosylated PSA in different sample matrices using ELLA-type approaches.

PSA: prostate-specific antigen; ELLA: enzyme-linked lectin assay; PCa: prostate cancer; BPH: benign prostate hyperplasia; GS: Gleason score; AUC: area under the curve; PhoSL: Pholiota squarrosa lectin (recognizes core α(1,6)-linked fucoses); UEA-1: Ulex europaeus agglutinin (recognizes terminal α(1,2)-linked fucoses); AAL: Aleuria aurantia lectin (recognizes core α(1,6)- and α(1,3)-linked fucoses); TJA-II: Trichosanthes japonica agglutinin-II (recognizes terminal α(1,2)-linked fucoses and β-N-acetylglucosamine residues); n/a: not applicable.
In order to expand the field, this work describes an LC-MS/MS-based study for evaluation of site-specific core-fucosylation changes of PSA in human sera derived from patients diagnosed with BPH and PCa of different degrees of aggressiveness. This method allows for the first time to measure fuc-PSA in the low ng/mL range in patient samples by LC-MS/MS. Total PSA serum concentrations of patient samples ranged from 2 to 10 ng/mL and thus did not exceed the critical gray area of PCa diagnosis. In former lectin-based studies, patient samples with higher serum concentrations (up to 110 ng/mL) or urine samples with very high total PSA levels by nature (µg/mL range) were analyzed.6,42,53 This is largely because of the lack in sensitivity of these assays as lectins possess 100–10,000-fold lower binding affinities than antibodies. 54 In addition, low specificity of lectins toward glycan structures and their unspecific binding to glycoproteins from human matrix is an inherent problem of lectins resulting in high background signals obscuring the analyte signal of interest and worsening the limit of detection. Considering the low amount of core-fucosylated PSA in the critical gray area compared to the immense amount of other glycoproteins in blood, analysis of serum or plasma samples by lectin-based assays is challenging. In this study, these limitations could be tackled by combining the sensitivity of immunoassays with the specificity of mass spectrometric detection taking into account that the extensive process for handling the LC-MS/MS and limited throughput precludes the application in the clinical routine. 47 We used a high number of patient samples (n = 150) equally distributed into three groups: (1) BPH, (2) non-aggressive PCa (GS ≤ 6), and (3) aggressive PCa (GS > 6) in which classification was performed according to the GS as reported previously. 49 Method comparison showed a good agreement between total PSA levels obtained by LC-MS/MS and ECLIA with approximately 10% bias which seems to be correctable by proper calibration. The %-core-fucosylated PSA variation (%-fuc-PSA-MS) in a control sample monitored over all 19 study days was lower than 10% indicating the feasibility of the applied method for measuring fuc-PSA in the critical gray area.
The diagnostic power of fuc-PSA was assessed by ROC curve analysis and revealed two major findings. First, fuc-PSA (AUC = 0.58), %-fuc-PSA-MS (AUC = 0.54), and %-fuc-PSA-ECLIA (AUC = 0.51) had no diagnostic value for differentiation of BPH from PCa compared to conventional diagnostic PCa markers in which %-free PSA gave the highest AUC value (AUC = 0.74). Decreased %-free PSA serum levels in PCa compared to BPH patients have been also reported in a comprehensive study including 773 men. 19 Second, the highest AUC for differentiation of non-aggressive and aggressive PCa was obtained using %-fuc-PSA standardized by total PSA determined by ECLIA (%-fuc-PSA-ECLIA, AUC = 0.60) which was slightly better than standardization to total PSA obtained by LC-MS/MS (%-fuc-PSA-MS, AUC = 0.57). This could probably be due to the higher imprecision of the LC-MS/MS method compared to the routinely used ECLIA workflow. Both %-fuc-PSA values performed slightly better than conventional markers such as free, total, and %-free PSA (all AUC ≤ 0.55). The %-fuc-PSA-ECLIA tended to be decreased in the aggressive PCa group which is in agreement with reported results from serum, seminal fluid, and urine.6,39,55,56 However, our results were not statistically significant (p-value = 0.08) compared to previous studies which might be due to different reasons. First, we used a subset of patient samples which might possess only small differences in core-fucosylation degree of serum PSA. These changes would not be detectable by the method used in this study due to the relatively high assay imprecision. At present, there is little information about how pronounced differences in native serum samples actually are. Second, in previous studies, patient samples with higher total PSA serum levels ranging from 8 to 110 ng/mL or 2 to 55 ng/mL were analyzed and total PSA values alone already identified high-risk PCa with AUC values of 0.89 or 0.81, respectively.6,49 Finally, selected patient panels in those studies were rather small (40 and 47 samples), which is why large-scale studies might be necessary to further validate these findings. Although it was the first time such a high number of patient samples (n = 150) were used for studying site-specific core-fucosylation changes of serum PSA, increasing number of patient samples could help to consolidate our results as well. As shown in this and previous studies, a single biomarker (e.g. core-fucosylated PSA alone) might only unlikely possess diagnostic strength to indicate the likelihood of aggressive PCa. On the other hand, a combination of several complimentary biomarkers (e.g. ratio of core-fucosylated PSA to total PSA) may have potential for improvement of both clinical sensitivity and specificity.
In summary, a previously developed endoglycosidase-assisted LC-MS/MS-based approach was used to analyze serum core-fucosylated PSA from BPH and PCa patients of different degrees of aggressiveness (n = 150). Our data revealed that %-fuc-PSA standardized to total PSA could not significantly differentiate between aggressive (GS > 6) and non-aggressive PCa (GS ≤ 6) and thus had no better diagnostic power than conventional total PSA. On the basis of our findings, it is still uncertain if these limitations come from the biomarker, the patient cohort, or the high imprecision of the used method itself. Hence, the usage of improved methods regarding assay imprecision, possibly in combination with larger patient cohorts, seem to be required for a valid clarification in the future.
Footnotes
Acknowledgements
We thank Dr Heike Wegmeyer for providing clinical and pathological information of patient samples.
Declaration of conflicting interests
The author(s) declared the following potential conflicts of interest with respect to the research, authorship, and/or publication of this article: R.L., V.R., A.L., J.K., M.S.-d.L., and U.K. are all employees of Roche Diagnostic GmbH. M.V. receives research grants and speaker’s honoraria from Roche Diagnostics GmbH. H.K., M.M., and M.S. declare no conflicting interests.
Funding
The author(s) received no financial support for the research, authorship, and/or publication of this article.