
Abstract
Macrophages play an important role in the immune response and in the maintenance of tissue homeostasis. It is well known that many tumors recruit monocytes from circulation and influence their differentiation, mainly into suppressive M2-like subsets. Since there are contradictory data concerning the importance of macrophages for colon cancer progression, we used in our experiments four colon cancer cell lines representing different stages of tumor development (HT29, LS180, SW948, SW620). An acute monocytic leukemia cell line THP-1 was used as a human model of monocytes. Our work revealed that conditioned medium from the tumor cell lines induced activation and differentiation of THP-1 cells. The changes involved increased expression of CD68, a macrophage differentiation marker. Moreover, we also observed increased expression of CD206 and CD163, which are widely considered as markers of tumor-associated macrophages. The tumor-derived conditioned medium decreased the proliferation of THP-1 cells and blocked their cell cycle at the G1 stage. The tumor-conditioned medium also upregulated the production of several cytokines and chemokines characteristic of both M1 and M2 subsets and induced the expression of important pro-angiogenic factors, vascular endothelial growth factor, and matrix metalloproteinase-9 in THP-1 cells. Moreover, the tumor-conditioned medium induced the expression of galectin-3, which is implicated in malignant transformation, and indoleamine 2,3-dioxygenase, that is, a key enzyme of the kynurenine pathway. Our data suggest that tumor cells can actively influence the phenotype of monocytes and switch their differentiation into a population of non-adherent mixed M1 and M2 cells. These preliminary studies suggest that colon cancer cells produce soluble factors that influence monocyte differentiation, most probably into suppressive subsets. These data provide a better understanding of the influence of colon cancer on polarization of monocytes.
Keywords
Objectives
It is well known that many tumors recruit monocytes from circulation by producing various chemoattractants and transform them into an immunosuppressive subset called tumor-associated macrophages (TAMs). 1 TAMs are composed of several distinct populations that share features of both M1 and M2 macrophages; however, most studies have shown that TAMs have anti-inflammatory properties and correlate with a poor prognosis.2,3 Human TAMs express a series of markers characteristic of M2 subsets, such as CD163, CD206, and CD204. They also secrete large amounts of interleukin (IL)-10, tumor necrosis factor (TNF)-α, chemokine (C–C motif) ligand (CCL)-17 and CCL-22 chemokines, matrix metalloproteinases (MMPs), vascular endothelial growth factor (VEGF), and heat shock proteins.4,5
It has been proved that TAMs influence various aspects of cancer progression. TAMs stimulate cancer cell proliferation, activate tumor stem cells, and promote metastasis. 6 Moreover, TAMs induce vascularization of tumor tissue by producing MMPs and VEGF 7 and make a significant contribution to immunosuppression by producing cytokines, chemokines, and other proteins such as transforming growth factor (TGF)-β, IL-10, CCL-2, CCL-17, CCL-22, arginase 1, and galectin-3. 3
In our work, we showed that conditioned medium (CM) collected from four colon cancer cell lines strongly influenced the phenotype of monocytes. Tumor CM induced the expression of macrophage differentiation markers as well as surface markers characteristic of TAMs. Moreover, increased production of many chemokines and cytokines characteristic of both the M1 and M2 subsets was observed. Our data suggest that products of tumor cells can actively influence the phenotype of monocytes and switch their differentiation into a non-adherent immunosuppressive population of mixed M1 and M2 cells.
Method
Cell lines
Four human colorectal cell lines representing different stages of tumor development were obtained from the American Type Culture Collection (ATCC, USA): HT29 (no. HTB-38), LS180 (no. CL-187), SW948 (no. CCL-237), and SW620 (no. CCL-227). HT29, LS180, SW948, and SW620 were grown in a 1:1 mixture of Dulbecco’s Modified Eagle’s Medium (DMEM)/F12 culture medium (Sigma, USA) supplemented with 10% fetal bovine serum (FBS; Gibco, UK), 100 U/mL penicillin, and 100 μg/mL streptomycin (Sigma). Human skin fibroblasts (HSFs) used as control cells were a primary cell line isolated from freshly excised fragments of human skin. 8 The HSF cell line was cultured in DMEM medium (Sigma) supplemented with 10% FBS and antibiotics. Human peripheral blood acute monocytic leukemia cells THP-1 (ATCC; no. TIB-202) were used as a model of human monocytes. The THP-1 cells were cultured in RPMI 1640 medium supplemented with 10% FBS and antibiotics.
Preparation of CM
Colon cancer or control HSF cells were seeded into 75 cm2 flasks at the density of 4 × 10⁶ cells/flask (HT29, LS180, SW948, SW620) or 1 × 10⁶ (HSF) and were cultured for 72 h. After the incubation time, the culture medium was collected, centrifuged, and stored at −80°C for further experiments.
Cell proliferation assessment
The THP-1 cells growing on 96-well plates at a density 2 × 10⁴ cells/well were allowed to proliferate under exposure to the culture medium (RPMI), 50% of the control or tumor CM for 72 h. After incubation, the cell growth was assessed by means of an MTT assay. Shortly, the THP-1 cells were incubated for 3 h with a 0.5 mg/mL MTT solution (Sigma). The produced formazan crystals were solubilized overnight in 10% sodium dodecyl sulfate (SDS) and 0.01 N HCl. The amount of the color product was determined by spectrophotometric measurement (EL800, Universal Microplate Reader; Bio-Tec Instrument, Inc., USA). Cell proliferation was also assessed by means of the BrdU assay with the use of a Cell Proliferation ELISA BrdU kit (Roche Diagnostics, Germany) according to the manufacturer’s instructions. All experiments were performed in triplicate.
Cell cycle measurement
The THP-1 cells growing on a 24-well plate (1 × 10⁵ cells/well) were preincubated with 50% CM for 72 h and stained with propidium iodide (PI) using the PI/RNase staining buffer (BD Biosciences, USA) according to the manufacturer’s instructions. The stained cells were analyzed using a FACSCalibur™ flow cytometer (BD Biosciences) and at least 10,000 events were measured per sample. FlowJo software (FlowJo LLC, USA) was used to analyze the distribution of the cells in the various cell cycle compartments: G0–G1, S, and G2–M, based on the amount of PI incorporated into DNA. All experiments were performed in triplicate.
Reactive oxygen species production measurement
The THP-1 cells treated with 50% of the control or tumor CM for 72 h were incubated with 2′,7′-dichlorodihydrofluorescein diacetate (H2DCF-DA; Sigma) for 30 min at 37°C in the presence of 5% CO2. After the incubation, the cells were analyzed using a FACSCalibur flow cytometer (BD Biosciences). The intensity of fluorescence was measured in at least 10,000 events per sample and FlowJo software (FlowJo LLC) was used to analyze the results. All experiments were performed in triplicate.
Flow cytometry analysis of the expression of surface markers
The following fluorescence-conjugated monoclonal mouse anti-human antibodies were used for cell surface staining: anti-CD14, anti-CD163, anti-CD206, anti-CD11b, anti-B7H1, anti-CD40, and anti-HLA-DR (all from BD Biosciences). Isotype-matched negative controls were used throughout the investigations. The THP-1 cells (1 × 10⁵ cells/well in a 24-well plate) treated with 50% of the control or tumor CM for 72 h were incubated with monoclonal antibodies for 45 min in the dark at 4°C. For intracellular staining (CD68; BD Biosciences), the THP-1 cells were fixed with Cytofix and permeabilized with Perm/Wash buffer (both from BD Biosciences) according to the manufacturer’s instructions. The stained cells were analyzed using a FACSCalibur flow cytometer (BD Biosciences) and at least 10,000 events were measured per sample. FlowJo software (FlowJo LLC) was used to analyze the expression of surface markers. All experiments were performed in at least triplicate.
Enzyme-linked immunosorbent assay
After incubation of the THP-1 cells with 50% of the tumor or control CM for 72 h, the culture medium was collected, centrifuged, and stored at −80°C. The concentrations of monocyte chemoattractant protein (MCP)-1 (CCL-2), MMP-9, VEGF, and TGF-β were measured by means of enzyme-linked immunosorbent assay (ELISA) kits (R&D Systems, Inc., USA), while IL-6, TNF-α, IL-12, IL-1β, and IL-10 were measured by ELISA kits from BD Biosciences. The tests were performed according to the manufacturer’s protocols and the results were obtained using an ELISA reader (EL800, Universal Microplate Reader; Bio-Tec Instrument). Measurement of the levels of cytokines and chemokines was simultaneously performed in the tumor and control CM. The presented results are values with a subtracted amount of cytokines and chemokines present in the tumor and control CM alone.
Gelatin zymography
Supernatants from the THP-1 cells preincubated with 50% of the tumor or control CM for 72 h were collected, solubilized in Novex Tris-Glycine SDS Sample Buffer (2×; Thermo Fisher Scientific, USA), and loaded into 10% sodium dodecyl sulfate polyacrylamide gel electrophoresis (SDS-PAGE) gels with 0.1% gelatin (Novex; Thermo Fisher Scientific). After electrophoresis, the gels were incubated in Zymogram Renaturing Buffer and Zymogram Developing Buffer (Novex; Thermo Fisher Scientific) according to the manufacturer’s instructions. Finally, the gels were incubated in fresh Zymogram Developing Buffer at 37°C for 12 h and then stained for 30 min with 0.25% Coomassie Blue R 250 (Sigma). After destaining in methanol, acetic acid, and water (1:1:8 ratio), the gels were scanned using a Molecular Imager ChemiDoc XRS (Bio-Rad, USA) and analyzed using Image Lab software (ImageJ). The areas of protease activity appeared as clear bands against a blue background.
Western blot analysis
The THP-1 cells were seeded into six-well culture plates at a density of 6 × 10⁵ cells/well and incubated with 50% of the tumor and control CM for 72 h. The cells were then lysed in radioimmunoprecipitation assay (RIPA) buffer (1% Tergitol, 0.5% sodium deoxycholate, 0.1% SDS, 1 mM ethylenediaminetetraacetic acid (EDTA), 1 mM ethylene glycol tetraacetic acid (EGTA), 1 mM Na3VO4, 20 mM NaF, 0.5 mM dithiothreitol (DTT), 1 mM phenylmethylsulfonyl fluoride (PMSF), and protease inhibitors in phosphate-buffered saline (PBS), pH 7.4). The cell lysates were solubilized in 6× Laemmli sample buffer (30% glycerol, 10% SDS, 0.5M Tris–HCl, pH 6.8, 0.012% bromophenol blue, 5% β-mercaptoethanol) and boiled for 5 min. Equal amounts of proteins were electrophoresed on 10% SDS-PAGE and transferred to a polyvinylidene difluoride (PVDF) membrane. After blocking for 1 h at room temperature with 5% non-fat dry milk in Tris-buffered saline (TBS) with Tween 20 (TBS-T; TBS–0.1% Tween 20), the membranes were probed at 4°C overnight with primary antibodies: monoclonal rabbit anti-human β-actin (Cell Signaling Technology, USA), monoclonal, mouse anti-human galectin-3, and polyclonal goat anti-human galectin-9 (Santa Cruz Biotechnology, USA). Then, the membranes were washed in TBS-T buffer, incubated with horseradish peroxidase-conjugated secondary antibodies (monoclonal mouse anti-rabbit and monoclonal rabbit anti-mouse from Cell Signaling Technology and polyclonal donkey anti-goat from Santa Cruz Biotechnology) for 1 h at room temperature, and visualized using enhanced chemiluminescence (Pierce Biotechnology, USA). Serial exposures were made on a Kodak BioMax Light film (Eastman Kodak Company, USA).
Real-time polymerase chain reaction
The THP-1 cells were seeded into six-well culture plates at a density of 6 × 10⁵ cells/well and incubated with 50% of the tumor and control CM for 72 h. Total RNA was isolated using a QIAamp RNA Blood Mini Kit (Qiagen, UK) and cDNA synthesis was performed using a High Capacity cDNA Reverse Transcription Kit (Thermo Fisher Scientific). PCR was performed using a TaqMan® Fast Universal PCR Master Mix (Applied Biosystems) with TaqMan Gene Expression Assays: Hs01075529_m1 for inducible nitric oxide synthase (NOS2), Hs00984148_m1 for indoleamine 2,3-dioxygenase (IDO), Hs00968979_m1 for arginase 1 (ARG1), Hs00173587_m1 for galectin-3 (Gal-3), and Hs01088493_g1 for galectin-9 (Gal-9) labeled with 6-fluorescein amidite in a duplex with a probe for the reference gene β-actin (Hs99999903_m1 for β-actin) labeled with 2-chloro-7 phenyl-1,4-dichloro-6-carboxy-fluorescein (VIC) (Applied Bioscience, USA).
Quantitative real-time expression was performed using a C1000 Touch™ Real-Time PCR Detection System (Bio-Rad). After 10 min of initial denaturation at 95°C, cDNA was amplified in 40–45 cycles (15 s at 95°C and 60 s at 60°C). The data were calculated with the use of a relative quantification method with efficiency correction and the results were normalized to the ACTB reference gene. All TaqMan PCR data were captured using CFX™ Manager Software.
Data analysis
The results are presented as the mean ± standard deviation. The significance of the differences was determined using GraphPad Prism 4 (GraphPad Software Inc., USA). The data were analyzed by one-way analysis of variance, followed by Tukey’s test; p values <0.05 were considered significant.
Results
Tumor CM significantly decreased proliferation and blocked the monocyte cycle at the G1 stage
Although all the examined tumor and control CMs were not toxic to the THP-1 cells (PI staining, data not shown), we proved by means of MTT and BrdU that the four examined tumor CMs significantly decreased the proliferation of the THP-1 cells. The weakest effect was observed for the CM collected from the LS180 cell line (Figure 1(a)). PI staining and analysis of the DNA content by flow cytometry revealed that all the examined tumor CMs blocked the cell cycle at the G1 stage (Figure 1(b)). The incubation of the THP-1 cells in the presence of 50% of DMEM/F12 and DMEM culture medium did not influence either proliferation or cell cycle of monocytes in comparison to the control (RPMI) group (data not shown).
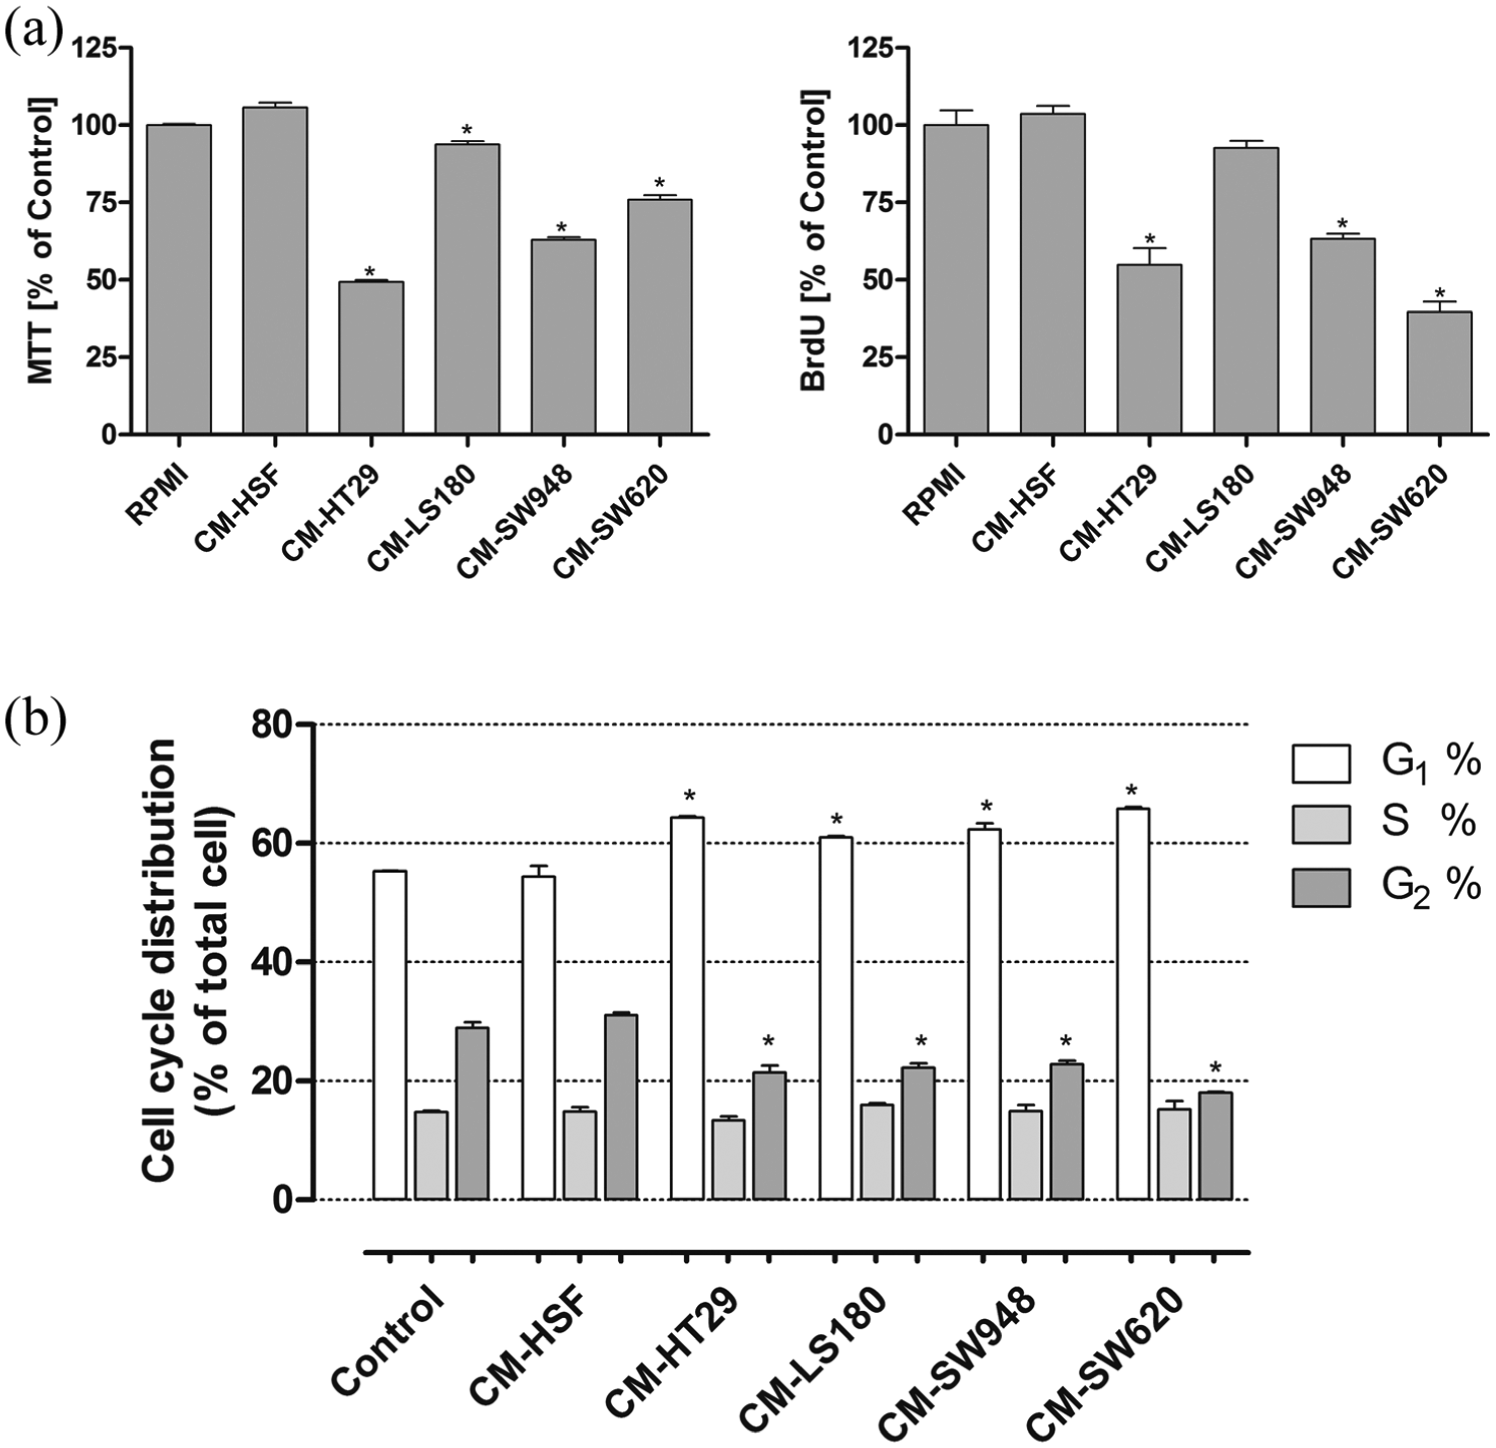
Tumor CM decreased the proliferation of THP-1 cells. Cell proliferation was determined by means of MTT and BrdU incorporation assays (a). The influence of tumor CM on the cell cycle distribution of THP-1 cells based on the amount of PI incorporated into DNA strains was measured by flow cytometry analysis (b). Graphs represent the distribution of THP-1 cells in the various cell cycle compartments: G0/G1, S, and G2/M. The results represent the mean ± SD of three independent experiments.
Tumor CM influenced the expression of differentiation markers in monocytes
The flow cytometry analysis revealed that all the examined tumor CMs influenced the intracellular structure of the THP-1 monocytes. After incubation with tumor CM, the THP-1 cells became slightly bigger with a denser intracellular structure (Figure 2). We showed that all the tumor CMs significantly induced the expression of CD68, CD11b, CD163, CD274, and CD206 (Figure 3). Moreover, the induction of CD40 was slightly upregulated only by the CM collected from the HT29 and SW948 cell lines. We also examined the expression of HLA-DR and CD14; however, it was not influenced by the tumor CM in THP-1 cells (data not shown). Furthermore, the tumor CM significantly induced reactive oxygen species (ROS) production in the THP-1 cells, as revealed by the DCF staining (Figure 4). The incubation of the THP-1 cells in the presence of 50% of DMEM/F12 and DMEM culture medium did not influence either the expression of differentiation markers or ROS production in monocytes, in comparison to the control (RPMI) group (data not shown).

Influence of tumor CM on the size and intracellular structure of THP-1 monocytes. The appearance of monocytes was evaluated by means of flow cytometry analysis. The dot blot figures are representative of three independent experiments.

Influence of tumor CM on the expression of differentiation markers. The expression of macrophage markers was evaluated by means of flow cytometry analysis. The results are representative of three independent experiments.

The ROS amount in THP1 cells incubated in the presence of tumor CM was measured by means of DCF staining followed by flow cytometry analysis. The histograms (a) are representative of three independent experiments. The average level of ROS amount in THP-1 cells (b) represents the mean ± SD of three independent experiments.
Tumor CM induced the production of cytokines and chemokines characteristic of both M1 and M2 subsets
We showed that monocytes incubated in the presence of the tumor CM produced more IL-6, IL-1 β, MCP-1, and VEGF in comparison to the control group. Moreover, the tumor CM induced the production of anti-inflammatory cytokines and chemokines. The expression of TGF-β was induced only by the incubation of THP-1 cells with CM obtained from the HT29 cell line, whereas the IL-10 production was induced in the presence of CM from SW948 and SW620 (Figure 5). However, the tumor CM did not influence the production of TNF-α and IL-12 in the THP-1 cells (data not shown). The incubation of the THP-1 cells in the presence of 50% of DMEM/F12 and DMEM culture medium did not influence the production of the examined cytokines and chemokines in comparison to the control (RPMI) group (data not shown).
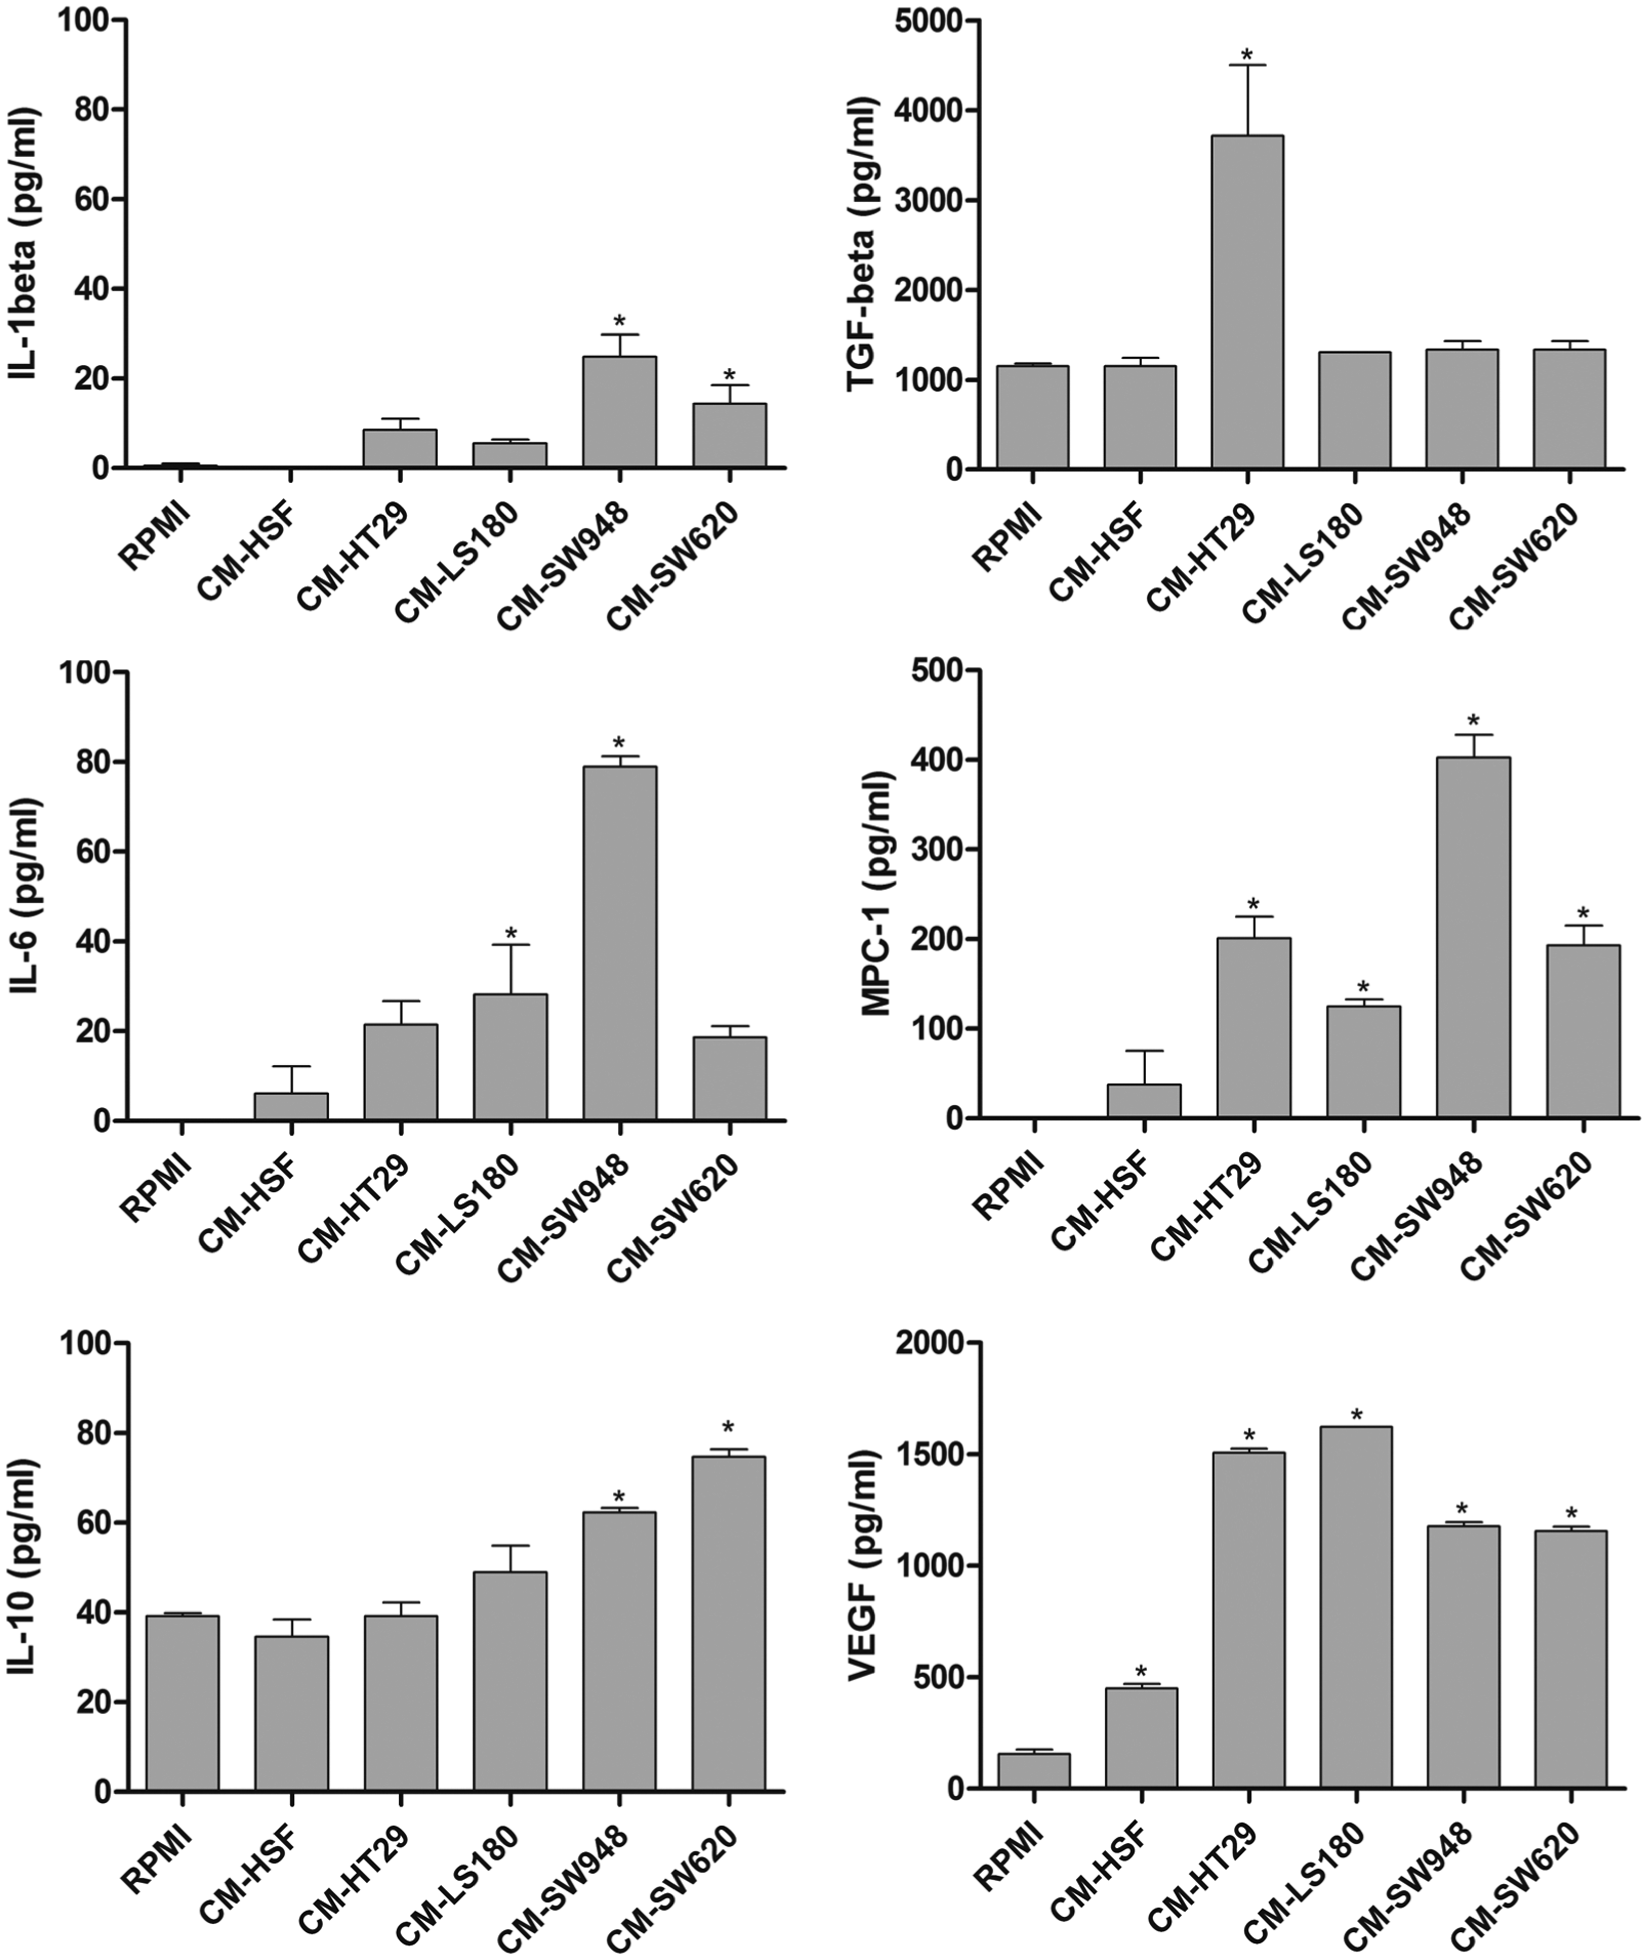
Influence of tumor CM on the production of cytokines and chemokines by THP-1 cells. The level of the examined cytokines and chemokines was measured in the medium after 72-h incubation of THP-1 cells in the presence of tumor and control CM by means of ELISA kits. The results represent the mean ± SD of two independent experiments.
Tumor CM upregulated the expression of proteins inducing tumor progression
We showed that the tumor CM obtained from HT29, LS180, and SW948 significantly upregulated the expression of galectin-3 but not galectin-9 (Figure 6(a) and (b)). The expression of neither NOS2 nor ARG1 was upregulated in the THP-1 cells in the presence of the tumor CM. However, we observed that the tumor CM induced strong activation of IDO expression in the THP-1 monocytes (Figure 7). Moreover, by means of the ELISA test as well as gelatin zymography, we proved that the tumor CM obtained from HT29, LS180, and SW948 strongly induced the expression of MMP-9 in the THP-1 cells (Figure 8(a) and (b)). However, in the case of CM from SW620, the signal obtained by gelatin zymography was much weaker than that from the ELISA test. This indicates that MMP-9 produced by THP-1 incubated in the presence of CM from SW620 is in its inactive form (Figure 8(a) and (b)). The incubation of the THP-1 cells in the presence of 50% of DMEM/F12 and DMEM culture medium did not influence the expression of all the examined proteins in comparison to the control (RPMI) group (data not shown).
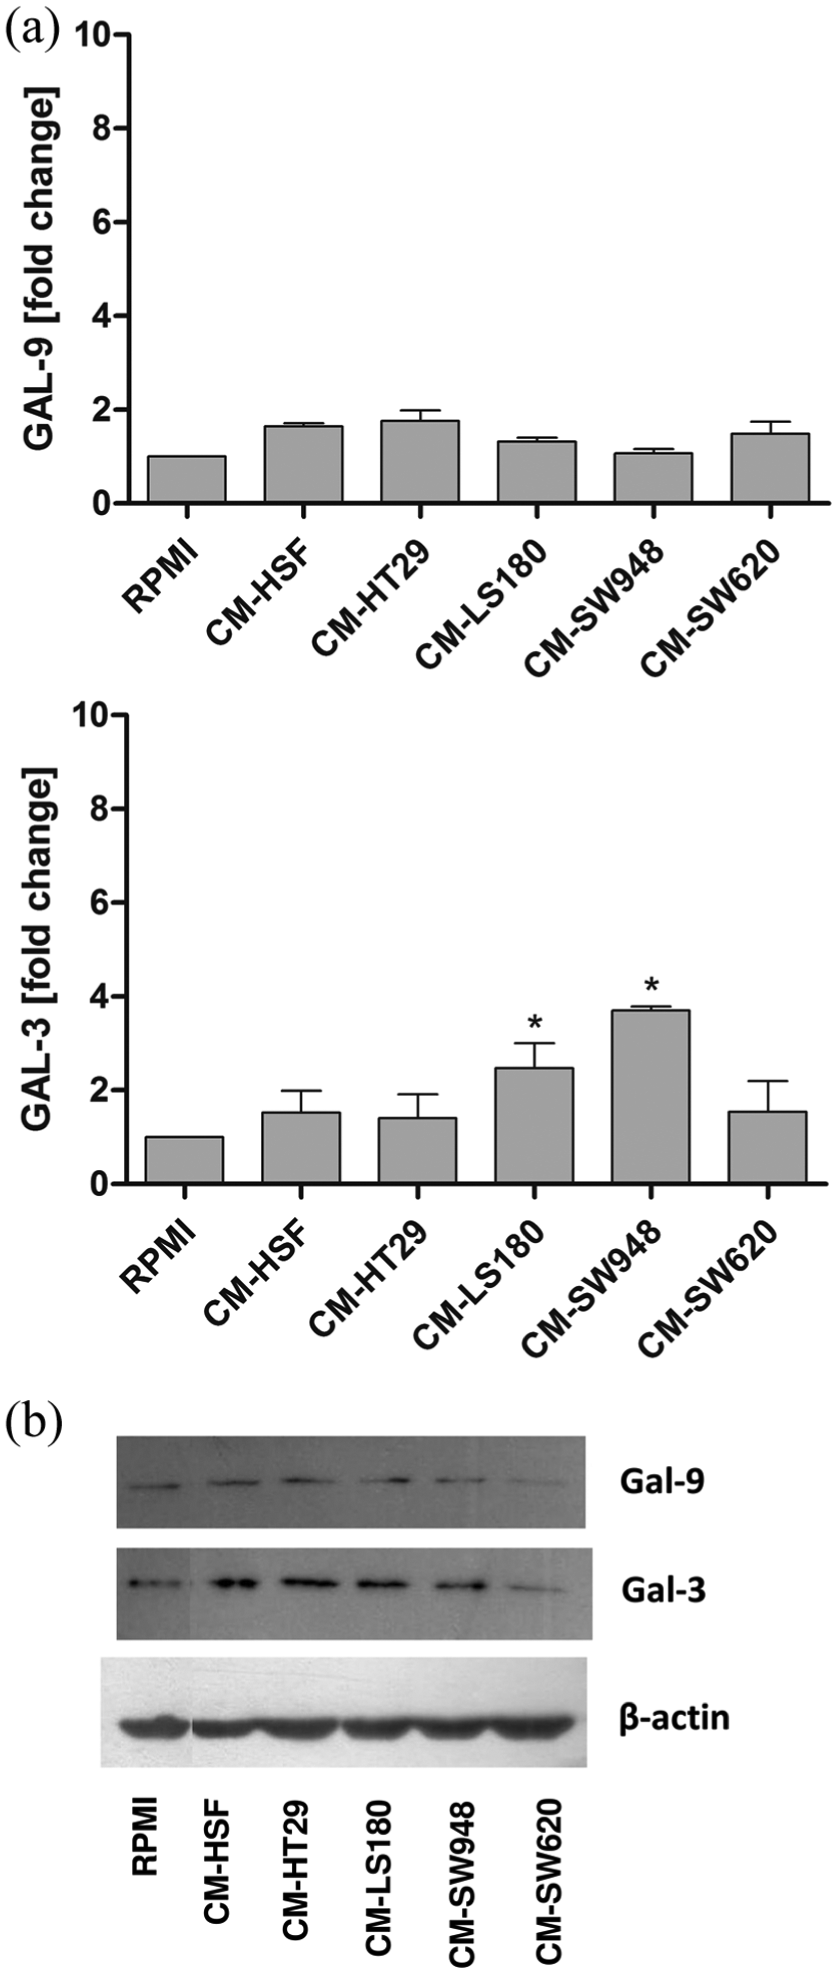
Influence of tumor CM on the expression of galectin-3 and galectin-9 in THP-1 cells. The expression of the examined proteins was measured in the THP-1 cells after 72-h incubation in the presence of tumor and control CM by means of RT-PCR (a) and western blotting (b). The results represent the mean ± SD of three independent experiments.

Influence of tumor CM on the expression of ARG1, NOS2, and IDO by THP-1 cells. The expression of the examined markers was measured in the THP-1 cells after 72-h incubation in the presence of tumor and control CM by means of RT-PCR. The results represent the mean ± SD of three independent experiments.
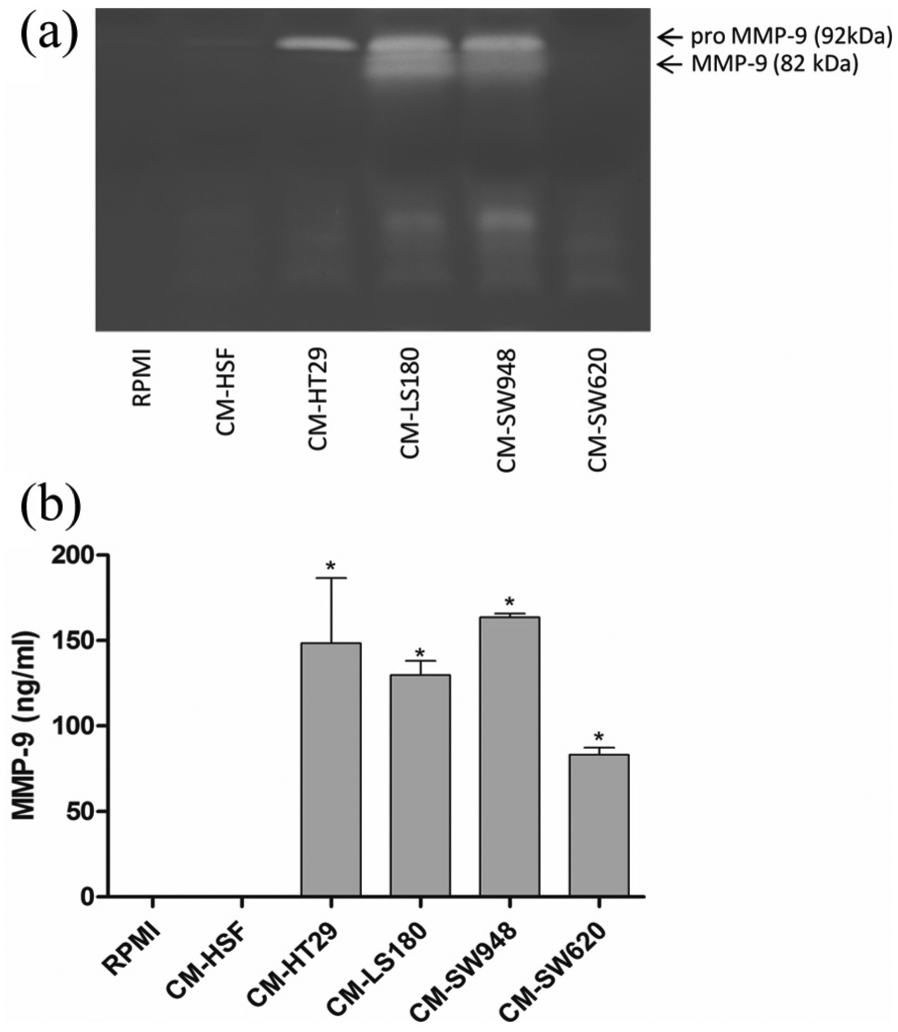
Influence of tumor CM on the expression of MMP-9. The expression of MMP-9 was measured in the medium after 72-h incubation of THP-1 cells in the presence of tumor and control CM by means of gelatin zymography (a) and ELISA test (b). The results represent the mean ± SD of two independent experiments.
Discussion
It is well known that monocytes are recruited from circulation to tumor tissue by various chemoattractants produced by cancer cells. Within the tumor, monocytes differentiate into TAMs, which most often have immunosuppressive properties. Therefore, our goal was to investigate the effect of colon cancer CM on the early stages of monocyte differentiation. Our results have shown that the CMs collected from four colon cancer cell lines influence the THP-1 monocyte differentiation. The changes observed in our study involved increased expression of CD68, that is, a macrophage differentiation marker. Moreover, we observed increased expression of CD206 and CD163, which are widely considered as TAM markers. The tumor CM also upregulated the production of several cytokines and chemokines, which are known to support different stages of tumor development.
Several lines of evidence indicate that CM from tumor cells can influence the differentiation of human monocytes into suppressive M2-like type macrophages in vitro. For example, Wu et al. 9 showed that THP-1-derived macrophages incubated in the presence of colon cancer CM switched into mixed M1/M2 phenotype and had an enhanced phagocytic capacity. Moreover, Wang et al. 10 showed that the incubation of human macrophages in the presence of melanoma CM induced their switch into a suppressive subset bearing a TAM-like phenotype. Hagemann et al. 11 demonstrated that the medium from ovarian cancer cells induced the differentiation of macrophages to a suppressive phenotype similar to that found in the ovarian tumor in vivo. Our report also supports the thesis that the phenotype of monocytes is strongly influenced by soluble products of tumor cells.
Although most studies have shown that TAMs are considered to exhibit anti-inflammatory properties, which correlates with a poor prognosis, there is also contradictory information about the role of macrophages in colon cancer development. There are studies that have found that a high number of infiltrating macrophages correlate with better prognosis for colon cancer patients.12,13 However, other studies have proved that a macrophage-rich population in colon cancer is associated with high lymph node metastasis and is indicative of the worst survival prognosis.14–16 Therefore, the aim of our study was to investigate the influence of colon cancer cells on monocytes as precursors of TAMs.
TAMs mainly exhibit an M2-like phenotype. However, tumors can give rise to a heterogeneous population of tumor-infiltrating cells that differ at the molecular and functional levels depending on the local microenvironment. Moreover, during tumor progression, the macrophage phenotype changes from classically activated to suppressive M2-like subsets.6,17 Human TAMs express a series of markers characteristic of M2 subsets, such as CD163 and CD206. However, it has been proved that TAMs also secrete large amounts of IL-10, TNF-β, as well as CCL-17 and CCL-22 chemokines. 5 In our work, we examined the influence of CM collected from four colon cancer cell lines on THP-1 monocytes in vitro. THP-1 cells are commonly used as a model of human monocytes and have been extensively used to study monocyte function, mechanisms, and signaling pathways. 18 Moreover, THP-1 macrophages can differentiate into both M1 and M2 macrophages depending on the stimulation used. 19 Although we did not observe the formation of an adherent population of THP-1 cells, the flow cytometry analysis revealed that the incubation of THP-1 cells in the presence of tumor CM influenced their phenotype. After incubation with tumor CM, the THP-1 cells became bigger with a denser intracellular structure. In this work, we proved that the tumor CM significantly decreased the proliferation of monocytes and blocked the cell cycle at the G1 stage. Furthermore, our results showed that tumor CM increased the expression of CD68, a macrophage differentiation marker. As the expression of CD68 on phorbol-12-myristate-13-acetate (PMA)-induced macrophages is approximately 30%–40%, 20 our study has confirmed the strong influence of tumor CM on the activation of THP-1 monocytes toward macrophages. The CD68 marker is present in both the M1 and M2 populations of macrophages; therefore, we analyzed the expression of CD206 and CD163 characteristic of the M2 subset. Our data showed that all these markers were upregulated in THP-1 cells preincubated in tumor CM, which indicates that tumor-derived soluble factors influence the differentiation of monocytes and switch them toward the M2 population.
To further describe the impact of colon cancer CM on monocyte differentiation, we analyzed the expression of CD274, HLA-DR, and CD11b molecules in the THP-1 cells. We showed that CD274, a transmembrane protein that plays a major role in suppressing the immune system, is upregulated in monocytes incubated in tumor CM. This fact indicates that the tumor CM–treated THP-1 cells might be suppressive to the immune system. We also observed a very strong upregulation of CD11b. CD11b, an integrin that forms a macrophage-1 antigen together with CD18, plays a major role in many functions of myeloid cells. It has also been proven that CD11b plays an important role in tumor development, as its neutralization in vivo was able to inhibit the recruitment of myeloid cells into irradiated tumors and inhibit the disease progression. 21
To investigate the activity of the THP-1 cells treated with the tumor CM, we analyzed the production of ROS and cytokine secretion. Our results showed that all the examined tumor cell lines significantly induced ROS production in THP-1 cells, indicating the induction of oxidative stress in the microenvironment of the tumor cells. For further characterization of monocytes based on the factors they produced, we analyzed the production of cytokines and chemokines known to be expressed by M1 and M2 macrophages. In our model, we found that, under the influence of the tumor CM, monocytes secreted multiple cytokines and chemokines typical for both M1 and M2 subsets. Monocytes incubated with tumor CM produced higher amounts of MCP-1, IL-1β, and IL-10 than the control cells that were not incubated with the tumor CM. These results are in line with other studies showing the increased expression of MCP-1 and IL-1β in THP-1 monocytes after incubation with colon cancer cells.22,23 Moreover, the production of TGF-β was also induced, however, only by CM from the HT29 cell line.
Furthermore, we have proved that the THP-1 cells incubated with the examined CM may support tumor growth, as they produce factors that are crucial for cancer development. Our work showed that the production of MMP-9 was significantly increased in THP-1 cells treated with tumor CM, which is in line with other reports showing the importance of MMP-9 production in the development of many tumors.24,25 Moreover, we observed a significant upregulation of VEGF production in the CM-treated THP-1 cells. MMP-9 and VEGF are important pro-angiogenic factors upregulated in many malignant tumors.26,27 Furthermore, we have proved that the tumor CM significantly induces the expression of galectin-3 in THP-1 monocytes, a protein well known to be involved in cancer progression.28–30 The importance of galectin-3 was also found in colon cancer progression. It has been proved that a high level of serum galectin-3 correlates with an advanced stage and poor survival in colon cancer patients.31,32
In our work, we examined four colon cancer cell lines representing different stages of tumor development. HT29 was isolated from a primary tumor, consistent with Dukes’ type A classification. LS180 cells were isolated from Dukes’ type B colorectal adenocarcinoma, SW948 from Dukes’ type C grade III, whereas SW620 cells were derived from a metastatic site: the lymph node. Our results showed that all examined tumor cell lines induced the differentiation of monocytes. However, we observed many differences related to the various tumor stages. The HT29 cell line, which represents more differentiated colon cancer cells, was the only one that induced the TGF-β production. TGF-β is an important cytokine in the colon cancer development 33 and several studies have proved that the loss of TGF-β signaling occurs early in the carcinogenesis and contributes to tumor progression.34–36 On the other hand, we observed that the CM from the cell lines that represent later stages of tumor development (SW948, SW620) induced the highest upregulation in the M2 markers CD163 and CD206 as well as the production of IL-10. Moreover, CM from SW948 induced the production of MCP-1 and IL-6 and the expression of galectin-3 most effectively. This might suggest that the later stages of colon tumor might have a stronger impact on macrophages. However, further studies can evaluate the precise impact of the colon cancer stage on macrophage polarization.
Our data indicated that the soluble factors produced by colon cancer cells induced the differentiation of THP-1 cells into a non-adherent population of immunosuppressive macrophages exhibiting features characteristic of M1 and M2 macrophages. In addition, based on the cytokine/chemokine expression profiles, it was shown that the THP-1 cells treated with tumor CM displayed a mixed phenotype. 37 This observation is in agreement with the current studies presenting TAMs as a mixed population bearing both M1 and M2 characteristics.38–40 Further work is underway to analyze the functional studies of differentiated monocytes and macrophages in the model of colon cancer cells. In future studies, the regulatory mechanism affecting the role of TAMs in anti- and pro-tumor processes will be examined.
Footnotes
Declaration of conflicting interests
The author(s) declared no potential conflicts of interest with respect to the research, authorship, and/or publication of this article.
Funding
The author(s) disclosed receipt of the following financial support for the research, authorship, and/or publication of this article: This work was supported by the National Science Center of Poland (grant no. 2013/09/D/NZ6/02564).