
Abstract
The subtype of the papillary thyroid carcinoma tall-cell variant has a worse prognosis than does the conventional papillary type (papillary thyroid carcinoma). The new World Health Organization 2017 classification defines a tall-cell variant as a tumour consisting of over 30% of cells that are two or three times as tall as they are wide. However, thresholds have differed. Our aim was to study how tall cells affect the prognosis of papillary thyroid carcinoma patients and to determine, for such cells, a cut-off percentage. Our cohort included 65 papillary thyroid carcinoma patients who underwent surgery at Helsinki University Hospital between 1973 and 1996: originally, 36 otherwise-matched patient pairs, eventually comprising 34 patients with an adverse outcome plus 31 who had recovered. All samples were digitally scanned and scored by two investigators based on tall cell composition. The cohort was analysed with four tall cell thresholds: 10%, 30%, 50% and 70% with a median follow-up of 22 years. In survival analysis, only the 70% threshold showed a correlation with reduced overall survival, disease-specific survival and relapse-free survival. A correlation also emerged with death from papillary thyroid carcinoma. In multivariate analysis, a 70% cut-off and age at diagnosis significantly affected DSS. Increasing tall cell score correlated with increasing age and extrathyroidal extensions. A tall cell composition of 10%, 30% or 50% showed no correlation with adverse outcome and suggests that the choice of pathologists reporting tall-cell variant should be a 70% threshold.
Introduction
Thyroid carcinoma shows an increasing incidence globally and is about two to four times as common in women.1–3 Papillary thyroid carcinoma (PTC) has the most favourable outcome of all thyroid carcinoma subtypes, especially among young patients; one of the most important prognostic factors is age at diagnosis.4–6 Microscopically, the nuclei of PTC are characterized by highly irregular nuclear contours and prominent longitudinal grooves or nuclear pseudoinclusions. 7
PTC has several histological sub-variants. The tall-cell variant (TCV) was first described in 1976 8 and is widely recognized as more aggressive than conventional PTC.9–17 It is associated with more extra-thyroidal extensions11,13,14 and greater risk for recurrence.6,9,14,16,18,19 According to a 2017 update, World Health Organization (WHO) defines a TCV as a tumour showing typical nuclear features of PTC consisting of at least 30% tumour cells two to three times as tall as they are wide with an abundant eosinophilic cytoplasm. 7 The percentage of tall cells (TCs) needed for a PTC to be regarded as TCV is, however, under debate and varies greatly from 30%,11,20 to 50%, 18 to as high as 75%. 21 Recently, a much lower proportion, 10%, of tall cells has been associated with adverse outcome, suggesting that such tumours should be treated as TCVs.9,10
Determining TC composition in PTC samples by traditional microscopy is time-consuming and inaccurate and can lead to misdiagnosis, as is evident in sample re-evaluation.6,9,12,19,22 Novel whole-slide imaging (WSI) combined with high-resolution computer screens is convenient and efficient. 5
Revisiting our earlier series of 72 tumour–node–metastasis, age- and gender-matched cases of aggressive and non-aggressive PTCs, 4 our aim was to thoroughly count the proportion of tall cells and to determine a cut-off percentage for adverse PTC outcome.
Methods
Ethical approval
This study uses routinely collected samples, whose clinical data have been retrospectively collected. This study complies with the Declaration of Helsinki and was approved by the Surgical Ethics Committee of Helsinki University Hospital (DNo. HUS 226/E6/06, extension TMK02 §66 17.04.2013), and the National Supervisory Authority of Welfare and Health gave permission to use tissue samples without individual informed consent in this retrospective study (Valvira DNo. 10041/06.01.03.01/2012).
Patients and tissue material
The original study’s 36 patient-control pairs comprised one with an adverse outcome and the other who had recovered. These patients were matched by age (within 10 years), gender, time of primary operation (within 10 years), T stage, N stage, tumour size and any radioactive iodine ablation (yes/no). All had originally been diagnosed with PTC and had undergone initial surgery at the Department of Surgery, Helsinki University Hospital, between 1 January 1973 and 31 December 1996. 4 Adverse outcome was based on need for more than three iodine ablations or surgery for recurrent disease occurring more than once within 6 months after the primary operation, or distant metastases 6 months after that operation, or primary distant metastases or death from PTC (Table 1). 4
Criteria for tall-cell variant according to WHO 2017, 7 and criteria for adverse outcome in this study.

WHO: World Health Organization.
All available histological slides were assessed by both investigators simultaneously with a multi-viewer microscope. Based on these slides, the most representative tissue block for each tumour was selected and new slides were cut and stained with H&E. At this point, seven cases were excluded due to lack of tissue material. The new slides were further digitally scanned into WSIs for digital evaluation of TC composition. All clinical data were updated for this study. For cohort data, see Table 2. Median age at diagnosis was 46 (standard deviation (SD) = 20.3) years, with median age at diagnosis of the adverse outcome group was 42 (SD = 21) years and of the control group 50 (SD = 19) years. The mean for overall survival (OS) was 19.8 (SD = 9.6) years, for relapse-free survival (RFS) 3.1 (SD = 4.7) years and for disease-specific survival (DSS) 8.9 years (SD = 8.0). The follow-up began at the time of diagnosis and ended at completion of the study or at patient death. Follow-up therefore ranged from 4 months to 41.7 years (median 22.0 years). During follow-up, metastasis occurred in 15 patients, and 12 died of PTC, one at 4 months.
Characteristics of papillary thyroid carcinoma (PTC) patient cohort.

RAI: radioiodine ablation; LNM operation: number of operations for lymph node metastasis; TNM: tumour–node–metastasis; PTC: papillary thyroid carcinoma.
The adverse outcome group included 34 patients and the control group 31.
Figures represent patient number unless otherwise indicated.
T classification and TNM stage according to TNM classification of 199723– T1: ≤10 mm; T2: >10 mm; ≤40 mm; T3: >40 mm and T4: beyond thyroid capsule.
Digital pathology and manual scoring
The scanner used was a Panoramic p250 flash III manufactured by 3DHISTECH equipped with a 20× objective (NA 0.8). The resolution of the slides was 0.24 µm/pixel. Tumour WSIs were imported to an image-processing and management platform (WebMicroscope, Fimmic Oy, Helsinki, Finland). Our H&E slides were of good quality, and the WSI platform offered continuous zooming up to 40×, which made scoring easier and more precise (Figure 1). Tumour areas were first annotated, and then, samples were scored separately by J.A. and S.S., each of whom was blinded to clinical manifestations of the cases. The proportions of tall cells were scored in 10 groups of 10% each. Here, we defined tumour tall cells as being at least three times as tall as wide. Cases for whom investigators disagreed, after discussion, received a consensus score.
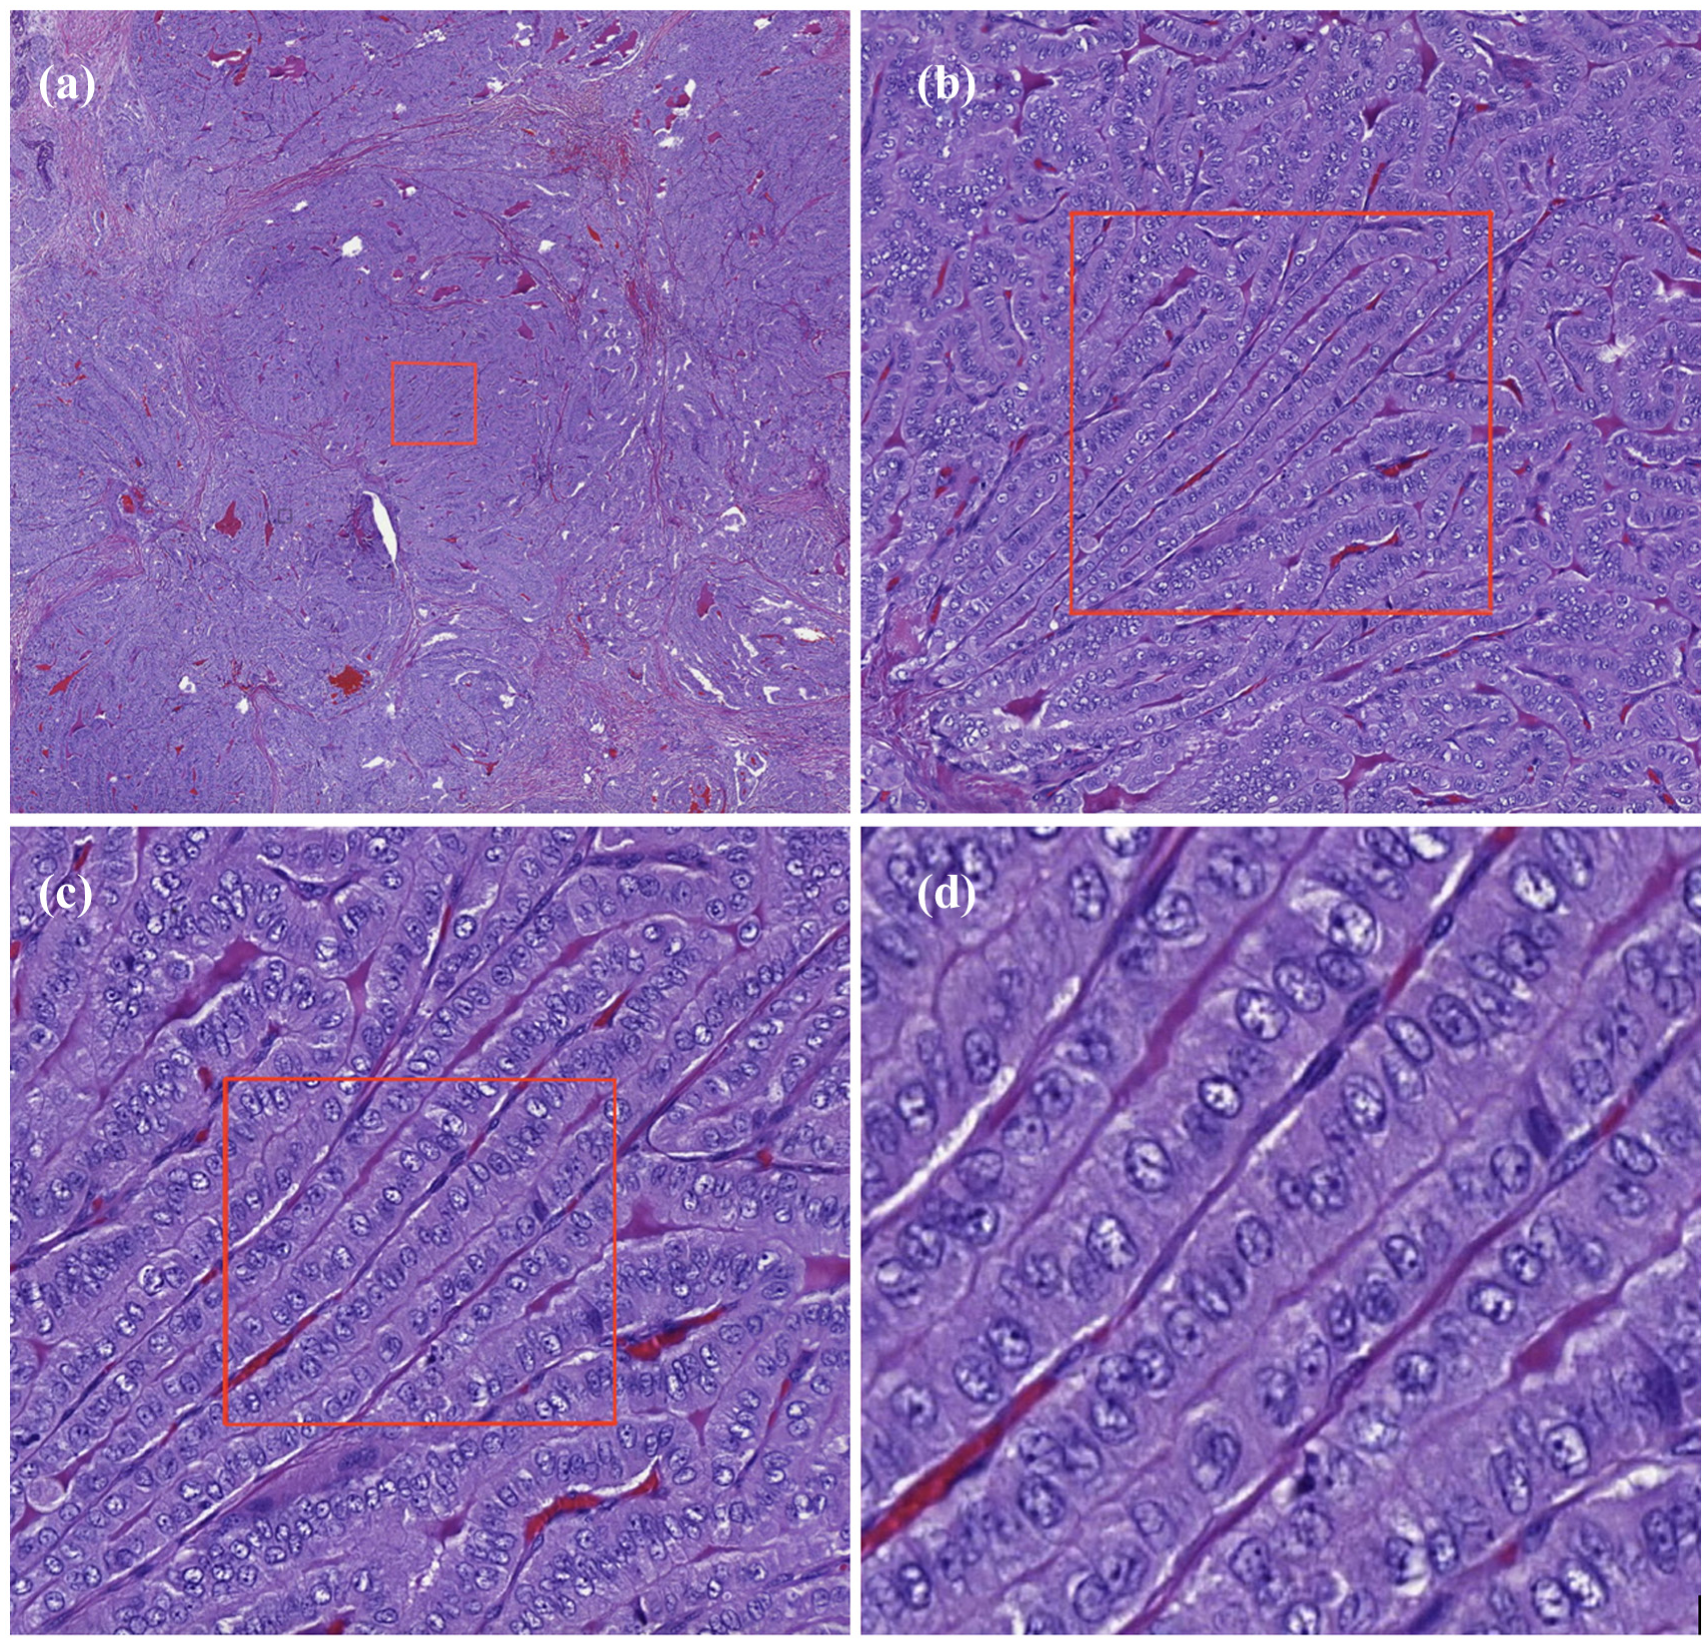
H&E staining of tall-cell variant of papillary thyroid carcinoma. Quality and zooming capabilities of the image management platform. Tall cells and conventional PTC cells are both clearly visible. Cells are aligned in a typical ‘train track’ formation. The box illustrates the area of the next image, with (a) 2× zoom, (b) 10× zoom, (c) 20× zoom and (d) 40× zoom.
Statistics
Distribution of samples according to their TC proportion were analysed with the Mann–Whitney U-test. Fisher’s exact test allowed discovery of differences between groups in nominal variables – the linear-by-linear association test for those between ordinal variables. Spearman’s rank correlation coefficient evaluated correlations between variables. Agreement between investigators was tested with a weighted kappa statistic with linear weights. Survival analyses were performed with the Kaplan–Meier method with the logrank test and with Cox proportional hazard regression. A p value of <0.05 was considered statistically significant, and a two-tailed test was used. The statistical tests were performed on SPSS statistics version 24.0 (IBM Corp., Armonk, NY, USA), MedCalc Software v15.8 (MedCalc, Ostend, Belgium) and SAS v 9.4 (SAS Institute Inc., Cary, NC, USA).
Results
Reproducibility of TC score
The adverse outcome group of 34 and the control group of 31 were analysed and scored based on their TC composition. By separate scoring of the two investigators, 23 cases (35.4%) were placed in the same percentage group, and in 18 cases (27.7%), the scores differed by one percentage group. A difference of more than one percentage group occurred in 17 cases (26.1%); 7 (10.8%) were evaluable by neither investigator (Table 3). A consensus was reached for all cases involving disagreement. A kappa value was calculated for the two scorers of TC composition. The calculations yielded a weighted kappa value of 0.566 (SD = 0.074, 95% confidence interval (CI) = 0.421, 0.711), which translates to moderate agreement.
Scoring of tall-cell (TC) percentage by two investigators.

TC score and outcome groups
The four cut-off percentages under study were 10%, 30%, 50% and 70%. The 25 tumours containing less than 10% TCs were evenly distributed between the adverse outcome group with 13 (52%) cases and the controls with 12 (48%). Thus, at the cut-off TC of 10%, no correlation with outcome appeared (p = 1.00). When analysed at 30%, 15 cases showed a TC over 10%: 10 of these in the control group and 5 in the adverse outcome group (p = 0.294). With a 50% TC cut-off, 20 TC tumours were detectable, 13 belonging to the adverse-outcome group (p = 0.191). At the 70% limit, 12 (18.5%) cases were classified as TC tumours, of which 9 (75%) had an adverse outcome and 3 (25%) were from controls (p = 0.113; Tables 3 and 4).
Distribution of consensus scores of the cases.

TC score and survival
Kaplan–Meier survival analysis, including all cases, showed only the 70% cut-off to be associated with reduction in OS (p = 0.005, hazard ratio (HR) = 2.93), DSS (p = 0.004, HR = 4.74) and RFS (p = 0.029, HR = 2.28; Figures 2 and 3). In Cox regression analysis, age and 70% threshold were statistically significant for DSS in both univariate and multivariate analyses (Table 5).
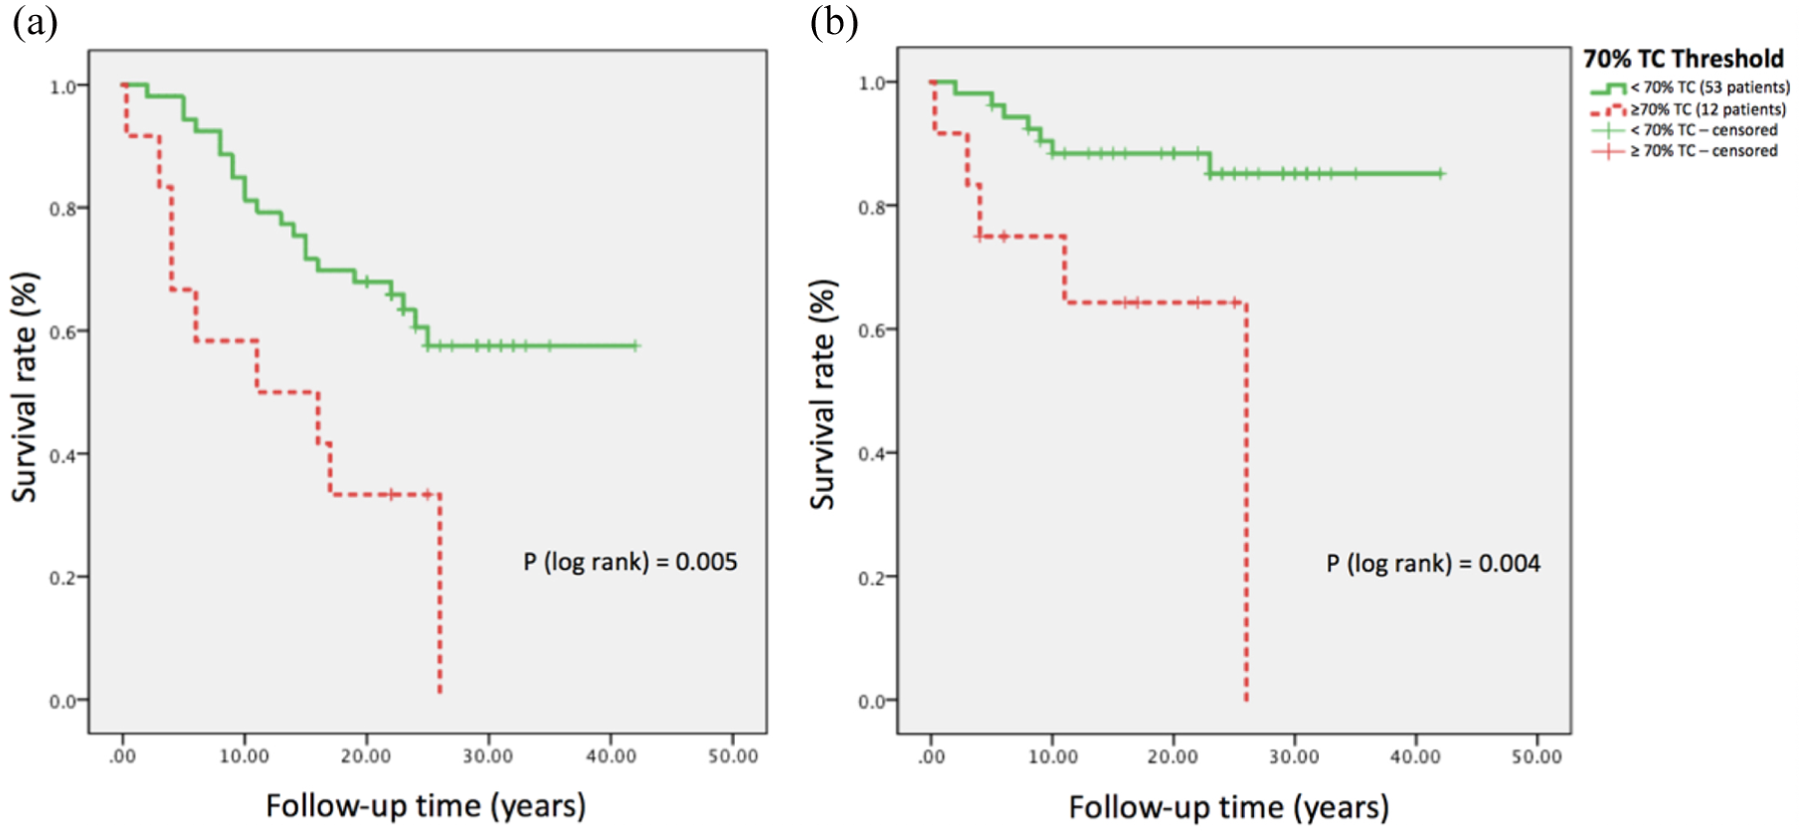
Kaplan–Meier survival analysis for (a) overall survival and (b) disease-specific survival for 70% tall-cell (TC) threshold in papillary thyroid carcinoma.

Kaplan–Meier survival analysis for disease-specific survival for tall-cell thresholds: <10%, 10%–69% and ≥70% in papillary thyroid carcinoma.
Univariate and multivariate Cox regression analyses for disease-specific survival (DSS).

CI: confidence interval.
>65 years at diagnosis (events = 7) compared to ≤65 years at diagnosis (events = 5).
TC score, age and gender
In this cohort, older age at diagnosis correlated with reduced OS (p < 0.001) and DSS (p = 0.003) but not with reduced RFS (p = 0.532). Older age at diagnosis also correlated with higher TC score, and Spearman’s rho value of 0.312 (p = 0.011) emerged. Gender was not associated with higher TC composition when analysed by 10%, 30%, 50% and 70% cut-offs (p = 1.00, p = 0.777, p = 1.00 and p = 0.485, respectively; Supplementary Table).
As can be seen in Table 2, a total of 13 patients had a T4 tumour and thus had extra-thyroidal extensions. Seven of these patients were in the group with an aggressive tumour, and six in the recovered group. T4 stage showed a correlation with an increasing TC score (p = 0.002).
Discussion
The diagnosing of TCV is of clinical importance since according to current guidelines, patients with TCV should be treated more aggressively than those with conventional PTC variant. To show any correlation with reduced survival, with metastases, or with death, we discovered that a PTC tumour must be comprised at least 70% tall cells. This finding is in line with older recommendations, and no correlation could be found with a 30% cut-off. Even with thorough digital analysis of TCs, we were unable to confirm the results of the WHO 2017 classification update indicating that a low proportion of TCs correlates with adverse patient outcome and thus should serve as a criterion of TCV of PTC. We can verify that older age at diagnosis correlates with worse outcome, and it also correlates with a higher proportion of TCs.
Regardless of the cut-off for tall cell proportion in PTCs, reproducibility in validation series is essential. Our approach of digital scanning of the slides and scoring on an image management platform with built-in annotating tools made the process more practical and accurate compared to conventional microscopy. By this approach, we could more systematically scan the tumours on large, high-resolution computer screens. After our project ended, the WHO defined a tall cell as being two to three times as tall as wide, 7 but we had defined a tall cell as three times as tall as wide. Applying this clear definition in practice is, however, challenging, since measuring every cell in a tumour under a traditional microscope is unrealistic. Furthermore, the plane of the section and the heterogeneity of neoplastic cells make evaluation of these tumours even more difficult. Interpretation of TC composition is subjective, with the percentage of TCs varying widely among investigators. This was also true here, where the kappa value found by us two researchers – although with a more convenient digitalized approach to scoring – was only 0.566.
The recommended cut-off percentage for TCV is still debated, and it is evident that it causes a confusion among pathologists when diagnosing TCV, in a review by Baloch and LiVolsi. 24 Two recent studies have indicated that even a low TC score of 10% correlates with adverse outcome and suggested that this cut-off should be the choice of pathologists for defining TCVs.9,10 A newer report has, however, concluded that low TC proportion shows no correlation with poor outcome. 25 Our cases with less than 10% TCs were distributed evenly between groups, with no prognostic significance observable for a low TC proportion. Dettmer et al. 10 speculate that their method of selecting their patients from a nuclear medicine department could exaggerate the prognostic impact of TCs, thus making them unrepresentative of the normal patient population.
One study cohort’s initial treatment and follow-up was not standardized, perhaps leading to skewed clinical data on patient outcome, which in turn could cause overestimation of the prognostic implication of TCs. 9
Another key study, on which is based WHO’s update on TCV in their classification of endocrine tumours comprised a series of 453 patients. In this work, patient follow-up was much shorter than ours, the technique of reading histology differed, as we used digital pathology, and their definition of a tall cell was a tumour cell twice as tall as wide. 11 Such differences may explain why our results differ.
In our series of PTC patients, a 70% threshold of TCs did correlate with OS, death from disease and metastasis, showing that TCV seems to have a less beneficial outcome than does conventional PTC, but probably due to small group sizes or too-broad selection criteria for adverse outcome, we could show no correlation with adverse outcome. In fact, of 12 cases with TC score 70% or higher, 9 belonged to the adverse outcome group, although the p value was 0.113.
The literature has concluded that older age correlates with worse outcome4,5,24 and that TCVs occur more frequently in older patients.11,13,14 Kaplan–Meier survival analysis of our series confirmed that older age at diagnosis did indeed correlate with reduction in survival. Our Spearman’s rho calculation confirms that older age also correlates with a higher proportion of TCs. It is also evident that TCV correlates with extra-thyroidal extension,11,13,14 which is also confirmed by our calculations.
Small sample size is a limitation of this study and may skew results, as the impact of each sample will then be quite large. Multivariate Cox regression analysis for DSS included only 12 cases, meaning that its results may be skewed. Due to the exceptionally good prognosis of PTC compared to that of most other cancers, identification of an appropriate number of patients with adverse outcome requires a very large cohort. Few hospitals can collect such series; multicentre collection of patients is to be recommended.
The strengths of this study were our carefully selected and matched samples and the long patient follow-up that provided us with access to their extensive clinical data, accounting for later medical events. A long follow-up is important as recurrence may be delayed for decades after initial diagnosis. 26 All our cases were originally diagnosed with PTC, and the primary treatment was the same for the matched samples. Thus, the cohort reflects the normal patient population of our hospital, and the impact of the TCs was not underestimated. Another strength is our approach of scanning and digitally analysing the slides, making it possible to scan tumours more systematically for TCs. Such scanning is an inexact process, and subjectivity plays a large role. The impact of subjectivity on the scoring of TCs is difficult to alter, making clear diagnostic guidelines essential. Another means to tackle this problem is by developing non-subjective artificial intelligence software to evaluate TC composition. A deep-learning tool would be able to apply the WHO’s definition and scan the whole tumour for TCs by measuring every cell in each tumour. Unfortunately, to our knowledge, no such tool yet exists, and creating such a tool offers great challenges, one of the more difficult being the vast heterogeneity of PTC histology.
Supplemental Material
Supplementary_Table – Supplemental material for The prognostic significance of tall cells in papillary thyroid carcinoma: A case-control study
Supplemental material, Supplementary_Table for The prognostic significance of tall cells in papillary thyroid carcinoma: A case-control study by Sebastian Stenman, Päivi Siironen, Harri Mustonen, Johan Lundin, Caj Haglund and Johanna Arola in Tumor Biology
Footnotes
Acknowledgements
The authors thank Eija Heiliö and Päivi Peltokangas for excellent technical assistance. They also thank the Translational Technologies/Biobank Technologies Platform core facility supported by the University of Helsinki and Biocenter Finland. Caj Haglund and Johanna Arola share equal last authorship.
Declaration of conflicting interests
The author declared the following potential conflicts of interest with respect to the research, authorship, and/or publication of this article: Johan Lundin is the co-owner of Fimmic Oy, creators of an image management platform used in the study.
Funding
The author(s) disclosed receipt of the following financial support for the research, authorship, and/or publication of this article: This study received grant support from Palander Foundation, Dorothea Olivia, Karl Walter och Jarl Walter Perklén Foundation, The Finnish Cancer Foundation and Helsinki University Hospital Research Fund (VTR; grant number TYH2016106).
References
Supplementary Material
Please find the following supplemental material available below.
For Open Access articles published under a Creative Commons License, all supplemental material carries the same license as the article it is associated with.
For non-Open Access articles published, all supplemental material carries a non-exclusive license, and permission requests for re-use of supplemental material or any part of supplemental material shall be sent directly to the copyright owner as specified in the copyright notice associated with the article.