
Abstract
Second-harmonic generation microscopy represents an important tool to evaluate extracellular matrix collagen structure, which undergoes changes during cancer progression. Thus, it is potentially relevant to assess breast cancer development. We propose the use of second-harmonic generation images of tumor stroma selected on hematoxylin and eosin–stained slides to evaluate the prognostic value of collagen fibers analyses in peri and intratumoral areas in patients diagnosed with invasive ductal breast carcinoma. Quantitative analyses of collagen parameters were performed using ImageJ software. These parameters presented significantly higher values in peri than in intratumoral areas. Higher intratumoral collagen uniformity was associated with high pathological stages and with the presence of axillary lymph node metastasis. In patients with immunohistochemistry-based luminal subtype, higher intratumoral collagen uniformity and quantity were independently associated with poorer relapse-free and overall survival, respectively. A multivariate response recursive partitioning model determined 12.857 and 11.894 as the best cut-offs for intratumoral collagen quantity and uniformity, respectively. These values have shown high sensitivity and specificity to differentiate distinct outcomes. Values of intratumoral collagen quantity and uniformity exceeding the cut-offs were strongly associated with poorer relapse-free and overall survival. Our findings support a promising prognostic value of quantitative evaluation of intratumoral collagen by second-harmonic generation imaging mainly in the luminal subtype breast cancer.
Introduction
Second-harmonic generation (SHG) has become an important tool in evaluating collagen (COL) structure in the extracellular matrix (ECM) to assess cancer development.1,2 This technique may represent a more objective automatic and quantitative method for cancer prognostication. Current strategies to determine the prognosis and treatment of breast cancer are ruled by tumor size, lymph node status, histological grade, expression of steroid hormone receptor, and human epidermal growth factor receptor 2 (HER-2) status. However, these factors insufficiently explain the biological and clinical behavior of breast cancer because tumors that have similar traditional predictive and prognostic factors can achieve distinct outcomes.3,4
It has been proposed that the composition and organization of the ECM in breast cancer might have prognostic value because changes in the ECM appear to be associated with the release of extra and intracellular signals and the synthesis of proteases.3,5 These factors, in turn, influence tumor behavior, such as its growth, invasion, and metastasis.3,5 Of the elements of the ECM, COL fibers are the most abundant component of breast cancer stroma.6,7
In the past decade, SHG has been applied to analyze noncentrosymmetric molecules, such as COL, at high resolution without fluorescent staining, photodamage, or photobleaching.8,9 As indicated by its name, SHG shows a strong signal precisely at twice the frequency and half the wavelength of the excitation beam, 10 with high specificity. Previous work showed that SHG is quite independent of the excitation wavelength for the typical Ti:Sapphire laser tuning range (680–1000 nm),11,12 so if one has to choose the fundamental wavelength to match the filters, they have to detect the SHG without any detrimental effect to the signal. It is a coherent signal, meaning that the electromagnetic fields generated by aligned permanent dipoles add up, and the intensity would be proportional to the square of the number of dipoles. Therefore, SHG of aligned COL fibers, highly crystalline, is more intense than other forms. Literature shows that type I COL with its three hydrogen bond α-chains and self-assembled into fibrils is the most intense SHG emitter in most human tissues. 8 SHG provides image analyses in great detail, with qualitative and quantitative measurements.13–15
In a pivotal study in an animal model, Provenzano et al. 16 defined three tumor-associated COL signatures (TACSs). TACS-1 was established at an early stage of tumor progression and was characterized by a localized increase in the deposition of COL near the tumor. TACS-2 was distinguished by the straightening of COL fibers around the tumor boundaries, and in TACS-3, COL was aligned perpendicularly to the tumor boundaries. 16 Qualitative studies using TACSs demonstrated that this approach was predictive of local invasion and that the visualization of radially distributed COL fibers (TACS-3) correlated with increased local tumor invasion and poorer long-term survival in patients with breast cancer.16–18 These reports speculated that the dispersal of tumor cells into the surrounding tissue and vasculature was facilitated by modified COL in the stroma, as also demonstrated in vitro. 19 In addition, a recent study has demonstrated that higher COL density was linked to positive axillary lymph nodes. 20 It was also shown that treatment with trastuzumab could determine alterations in COL organization. 21
Molecular categorization of breast cancer has been widely used to define optimal therapeutic modalities. 22 In brief, breast cancer could be classified into five immunohistochemistry (IHC)-based subtypes, surrogate for molecular subtypes, as follows: luminal A (expression of steroid hormone receptors, HER-2 negative and low histological grade); luminal B (expression of steroid hormone receptors, HER-2 negative and high histological grade); luminal-HER-2 (expression of steroid hormone receptors, HER-2 positive); HER-2-overexpression (no expression of steroid hormone receptors, HER-2 positive); and triple-negative (no expression of steroid hormone receptors, HER-2 negative). 23 However, when genomic status together with the cell proliferation activity was compared between IHC-based subtypes, it was found that the luminal A and luminal B subtypes should be further divided into more groups, 24 reinforcing heterogeneity within the luminal subtype breast cancer. Moreover, in 2012, the genomic landscape of breast cancer was extensively characterized using next-generation sequencing (NGS). 25 These studies have provided new opportunities to advance treatment of luminal tumors but revealed remarkable intertumor heterogeneity, which highlighted new challenges.26,27
Our purpose in this study is to evaluate the prognostic value of COL changes in ECM of breast cancer, mainly addressing invasive ductal carcinoma of IHC-based luminal subtype, which is more frequent and may present heterogeneous prognosis. Thus, COL alterations were quantitatively assessed by SHG and correlated with clinicopathological features and tumor progression (relapse-free (RFS) and overall survival (OS)). We also intend to determine the reproducibility of this technique. This quantitative analysis of COL and its correlation with a variety of clinicopathological features represents a distinctive approach for breast cancer and supports the clinical value of TACS. We observed that COL quantity, uniformity, and organization (see section “Materials and methods” for more detail) parameters were significantly different in peri and intratumoral areas. We detected an association between intratumoral COL uniformity with higher values of body mass index (BMI), advanced pathological stage, and presence of axillary lymph node metastasis, all features related to unfavorable prognosis. More importantly, intratumoral COL quantity and uniformity in breast cancer were related to distinct outcomes within the luminal IHC-based subtype.
Materials and methods
Patients and human tissues
This cohort study used retrospective archival material from the Department of Pathology and patients’ data compilation, at the Center for Integral Attention to Women’s Health (CAISM), University of Campinas (Unicamp, São Paulo, Brazil). Invasive ductal breast cancer tissue specimens were obtained from 60 female patients who were undergoing primary mastectomy or quadrantectomy from January 2008 to July 2009 to perform at least 5-year survival analyses. Exclusion criteria comprised previous chemotherapy or radiotherapy, history of other cancer types, and medical follow-up shorter than 5 years. All subjects granted informed, written consent before being enrolled. The study is fully compliant with the Declaration of Helsinki (approved by the “Comitê de Ética em Pesquisa da Unicamp,” approval number 087/2008).
Formalin-fixed, paraffin-embedded, and hematoxylin and eosin (H&E)-stained tissue sections obtained from the surgical specimens were reviewed to examine histopathological parameters as described 28 and to select areas to be analyzed by SHG microscopy by two pathologists (J.V. and G.R.P.). Both pathologists, who did not perform the SHG analyses, independently made selection of three intra and peritumoral areas. Intratumoral areas corresponded to fibrosis within neoplasia, admixed with groups of neoplastic cells; peritumoral areas corresponded to fibrosis at the border of neoplasia, adjacent to cancer cells, at the interface with non-neoplastic, morphologically normal tissue. Areas with inflammatory infiltrate, vessels, and elastosis were avoided (Figure 1(a) and (b)). Analyses of COL parameters in the areas selected by each pathologist were made separately and compared in order to circumvent selection bias.

Images (a) and (b) represent histological aspects of peri and intratumoral collagen, respectively (H&E stain). SHG images represent the same regions shown in (a) and (b), ((c) and (d), respectively), demonstrating that collagen quantity and organization is higher in the former. Graph (e) indicates the frequency of distribution, by orientation, of collagen fibers (continuous line for peritumoral and dashed line for intratumoral areas). Here, it is clear that peritumoral fibers are more homogeneously orientated (between −90° and −30°) than intratumoral fibers (peaks present in a broader interval of angles). Graph (f) indicates the sum of collagen fibers on each angle. It is clear that increase of collagen fiber numbers occur in a narrower interval (between −90° and −30°), in contrast with intratumoral areas, which have lower number of fibers, that demonstrate a linear increase throughout the entire interval of angles. A Gaussian gradient and Gaussian window (σ) of 20 pixels were used to represent the distribution of collagen fibers in the diagram.
In order to avoid endogenous autofluorescence of tissue, 3% hydrogen peroxide washes were performed (four incubations, 30 s each).
Hormonal receptor and HER-2 status
IHC for estrogen receptor (ER) and progesterone receptor (PR) was performed using clones 1D5 and PgR 636, respectively (Dako, Carpenteria, CA, USA). For HER-2, the polyclonal antibody A0458 (Dako) was used. Antigen–antibody reactions were detected using the ADVANCE™ HRPSystem (Dako). 28 Fluorescent in situ hybridization (FISH), used to detect HER-2 amplification, was performed using the HER-2/neu probe (VYSIS 36-161060, Des Plaines, IL, USA). Immunohistochemical typing was performed as follows: luminal A (ER and or PR+/HER-2–/histological grades I or II), luminal B (ER and or PR+/HER-2–/histological grade III), luminal-HER-2 (ER and or PR+/HER-2+), HER-2-overexpression (ER–/PR–/HER-2+), and triple-negative (ER–/PR–/HER-2–). As the immunohistochemical expression of Ki67 is still subject of standardization (due to preanalytical issues, technical and assessment variations), histological grade was used, as suggested elsewhere. 22 For statistical purposes, we combined all cases with hormone receptor expression (luminal A, luminal B, and luminal-HER-2) as luminal subtype; the HER-2-overexpression and the triple-negative were maintained as such.
SHG imaging
The peri and intratumoral areas selected for COL assessment on H&E-stained breast cancer tissue sections were examined at the National Institute of Sciences and Technology on Photonics Applied to Cell Biology (INFABiC, Unicamp). SHG microscopy was performed on a Zeiss LSM 780-NLO confocal system (Carl Zeiss AG, Göttingen, Germany) using a 40×/1.3 oil immersion EC Plan-Neofluar objective. The high numerical aperture (1.3) was necessary to provide the spatial resolution to observe the fibrils. An excitation wavelength of 780 nm, with an approximately 100-fs width pulse at an 80 MHz repetition rate, was provided by a Tsunami Ti:Sapphire laser (Spectra-Physics, Irvine, CA, USA). Laser power in the objective lens, incident on the sample, was around 80 mW, with circular polarization. Acquisition time of each image was around 60 s.
Only the SHG forward signal at 390 nm with the 0.55 NA—WD 26 mm condenser lens was collected. A short-pass SP690 (Omega Filters, Brattleboro, VT, USA) was used to filter the 780 nm excitation 29 and was followed by a filter cube with a long-pass LP490 at 45° to avoid two photons excited fluorescence (TPEF) and an SP430 at 90° to filter only the SHG signal. Two detectors were used to capture the TPEF signals (photomultiplier (PMT) detector) and SHG signals (non-descanned (NDD) detector), and only the latter was considered for this study (Figure 2). A spectral analysis of the emission between 350–430 nm did show that only a narrow peak at 390 nm consistent with SHG signal appeared. TPEF eosin staining fluorescence signal was also detected, but in the 530 nm range.

Schemata of laser workstation setup. Laser titanium: sapphire-emitting pulsing ray of 80 MHz is deflected by a mirror placed at 45°; ray crosses tissue section at specific regions of interest (ROIs) chosen by the pathologists; a small amount of laser (L) plus the SHG (second-harmonic generation) and two photons excited fluorescence (TPEF) are directed to a filter, short pass 690 nm (SP690), then eliminating L signal. TPEF + SHG signals cross a second filter, long pass 490 nm (LP490), to separate TPEF to a photomultiply tube detector (PMD); a third filter, short pass 430 nm (SP430), will purify SHG signal, which is detected in a non-descanned detector (NDD). HWP: half-wave plate; PBS: polarizing beam splitter; L1 and L2: convergent lens; QWP: quarter-wave plate; G1 and G2: Gauss lens; OBJ: objective lens.
We used the same procedure described by Burke et al. 1 to take into account day-to-day variations in optical alignments, comprising the acquisition of a normalization factor, provided by the SHG image of a standard sample (human aorta tissue) at the beginning of each experimental section. The field of view of this objective was of 212 × 212 µm, but to avoid the edges of the picture, where the intensity of SHG signal is weaker, we used a zoom to choose an area of 177 × 177 µm, which appeared homogeneous. To eliminate background signals, a blind observer physicist without any medical training applied a common threshold to all images comparing all images with one single control sample from human aorta tissue. After this threshold procedure, all background signals, not related to the tissue COL, were blanked. Of 720 images, 666 were suitable for analysis (counting images from areas selected by both pathologists, 333 images from each). The 54 images excluded correspond to 18 samples with no peritumoral areas available, because only tumor was present in the histological specimens.
Evaluation of COL fibers
SHG signals were stratified with regard to COL organization and structure in stroma using image pattern analysis methods. Quantitative analysis of COL parameters was performed in SHG images using ImageJ (http://imagej.nih.gov/ij/) and OrientationJ plug-in Rezakhaniha et al. 30 Quantity was determined as the total sum of SHG signals intensity of the 1024 × 1024 pixels, which was directly associated with the amount of COL molecules. These values were obtained using the integrated density of the ImageJ software. Using the OrientationJ plug-in, according to the methods described by Rezakhaniha et al., 30 we calculated the uniformity (energy) and organization (coherence). 31 Uniformity (energy) reflects the density of COL fibers, that is, how the fibers are distant (low values) or near (high values) to each other. Organization (coherence) reflects the direction of the COL fibers in space; thus, values vary from 0 (completely isotropic areas, zero directionality) to 1 (highly oriented structures). From the mathematical definition of these parameters one should expect a high correlation between them.
The OrientationJ first calculates the structure tensor 2 × 2 matrix
For this purpose, nine representative areas (150 × 150 pixels) were randomly chosen in each image, and COL quantity, organization, and uniformity were performed. The ratio between peri and intratumoral COL quantity was additionally calculated (Figure 3).

Representative images of collagen parameters evaluated in this study: (a) and (b): quantity; (c) and (d): uniformity; (e) and (f): organization. High values are found in images (a), (c), and (e) and low values are found in (b), (d), and (f).
Statistical analyses
COL quantity and uniformity were log-transformed to base e for statistical purposes, and the statistical analyses were performed using R. Shapiro–Wilk test was performed to analyze the data distribution of COL parameters. The concordance of the findings between the two pathologists was investigated using intraclass correlation coefficients (icc). 32 For this analysis, the mean values from the three intratumoral areas selected by a pathologist were correlated to the three corresponding intratumoral areas selected by the second pathologist; the same was made for the peritumoral areas. The mean COL parameters were compared to recognized clinical and pathological breast cancer risk factors, such as patients’ age (<50 years and ≥50 years groups), BMI (<30 Kg/m2 and ≥30 Kg/m2 groups), tumor pathological stage, immunohistochemical subtype, and histological grade. For these comparisons, t-tests or analysis of variance (ANOVA) were used. Parameters were included in an ANOVA multifactor test to identify the independence of each. Next, peri and intratumoral COL parameters were compared performing the same test, in order to evaluate any associations between both topographies. Furthermore, Pearson correlation or Spearman correlation tests were applied to evaluate the correlation between peri and intratumoral COLs’ parameters. Cox proportional hazard models were fit to determine the associations of COL parameters with RFS and OS. RFS and OS were measured from the date of primary breast cancer diagnosis to relapse or death, caused by breast cancer. To determine the cut-off values for the COL parameters for the survival analyses, a multivariate response recursive partitioning algorithm was applied. 31 Finally, Kaplan–Meier curves for RFS and OS were generated for the significant variables, as determined by the recursive partitioning model. Survival curves were compared by the log-rank test. Significance was set at p < 0.05.
Results
Clinicopathological features
The median age of the 60 patients was 60 years (95% central range (CR) = 33–88 years); 40 (66.7%) patients were postmenopausal, and the median BMI was 28 Kg/m2 (95% CR = 20–37 Kg/m2). The tumor was pathological stage I in 6 (10.0%), II in 28 (47.7%), and III in 26 (43.3%) patients. Clinically positive axillary lymph nodes were found in 45 (75.0%) patients; the remaining 15 (25.0%) patients were negative. Histological grading according to the Nottingham system was I in 3 (5.0%), II in 54 (90.0%), and III in 3 (5.0%) patients. Lymph vessel invasion was present in 18 (30.0%) patients and absent in 42 (70.0%), while vascular invasion was present in 27 (45.0%) patients and absent in 33 (55.0%). Perineural invasion was present in 14 (23.3%) and absent in 46 (76.7%) patients. By IHC-based subtype (surrogate for molecular typing), 43 (72.0%) patients had luminal subtype tumors (27 luminal A, 1 luminal B, and 15 luminal-HER-2), 7 (11.0%) had HER-2-overexpressing tumors, and 10 (17.0%) had triple-negative tumors. Nine (15.0%) patients presented tumor relapse, and 7 (11.7%) died from disease. In one case of luminal A breast cancer, follow-up data were not available (Table 1).
Clinicopathological features of the 60 patients in this study.

CR: 95% central range; BMI: body mass index.
SHG evaluation in areas selected by the two pathologists: concordance analysis (icc)
Values obtained for the areas selected by the two pathologists had satisfactory inter-rater agreement (icc > 0.70). Concordance was maximal for the average of the three images taken for each region, selected by each pathologist. For peri and intratumoral COL quantity, icc was 0.912 (p < 0.001; CI: 0.850–0.949) and 0.936 (p < 0.001; CI: 0.895–0.961), respectively. For peri and intratumoral COL uniformity, icc was 0.985 (p < 0.001; 95% confidence interval (CI): 0.974–0.992) and 0.948 (p < 0.001; 95% CI: 0.914–0.969), respectively. For peri and intratumoral COL organization icc was 0.834 (p < 0.001; CI: 0.727–0.902) and 0.886 (p < 0.001; CI: 0.816–0.930), respectively.
Comparison between peri and intratumoral COL parameters
Peritumoral areas presented higher COL quantity (p < 0.001), uniformity (p < 0.001), and organization (p = 0.006). In addition, there was strong correlation between peri and intratumoral COL quantity and uniformity (p < 0.001, r = 0.614 for both parameters), but there was no correlation between peri and intratumoral COL organization (p = 0.479, r = 0.101; Table 2). Peri and intratumoral COL SHG image and distribution are shown in Figure 1(c)–(f), with their related H&E-stained areas. In intratumoral areas, there were a lower frequency of COL in the same orientation and greater variations in orientation of fibers.
Comparison of peri and intratumoral collagen fibers parameters.
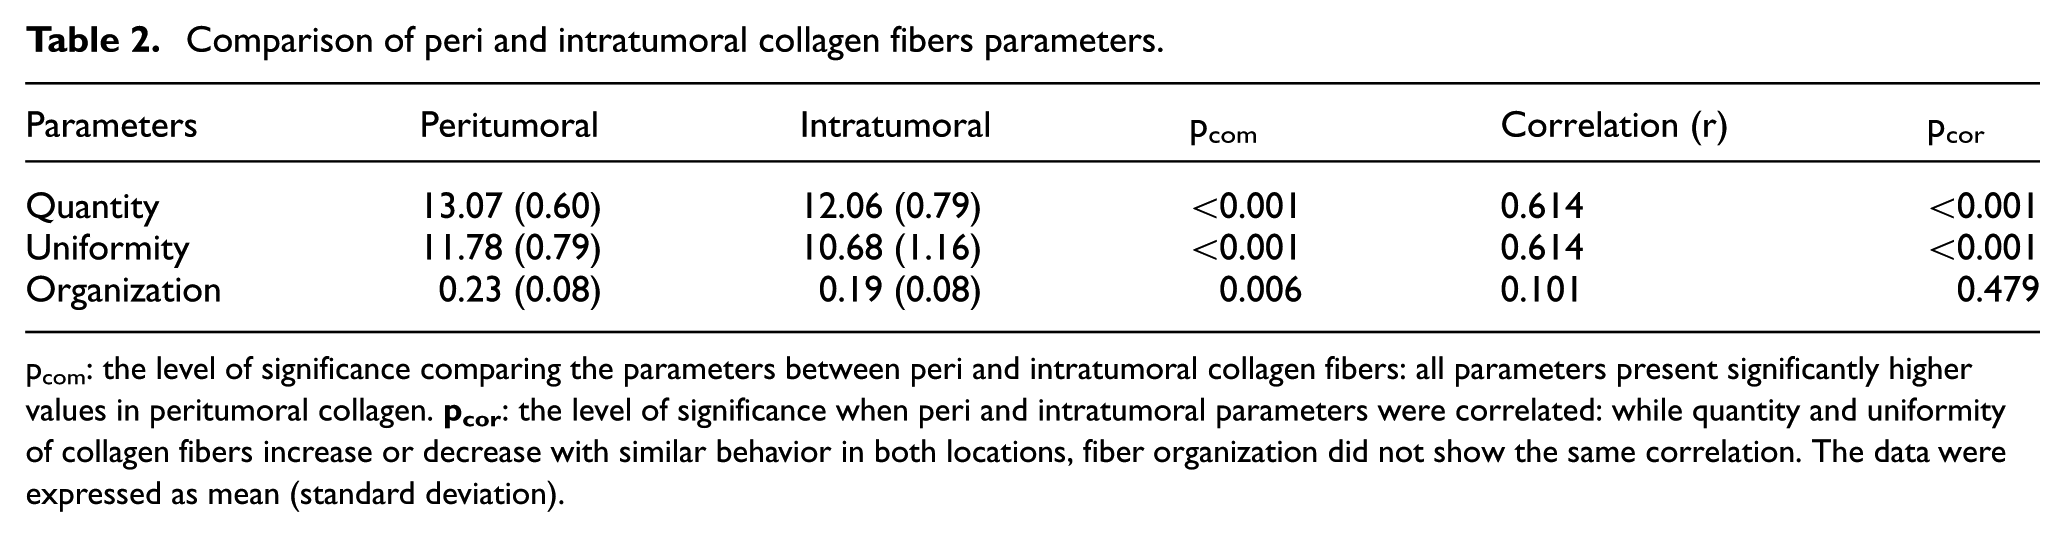
pcom: the level of significance comparing the parameters between peri and intratumoral collagen fibers: all parameters present significantly higher values in peritumoral collagen.
Association with clinicopathological features
Higher intratumoral COL uniformity was associated with other clinical parameters related to unfavorable outcome: BMI above 30 Kg/m2 (p = 0.019), with high pathological stage III (p = 0.004), and with axillary lymph node metastasis (p = 0.034). No other association was found for intratumoral COL parameters. Higher ratio between intra and peritumoral COL quantity was associated with BMI above 30 Kg/m2 (p = 0.036) and death related to disease (p = 0.048). No associations were found when peritumoral COL parameters (quantity, uniformity, and organization) were analyzed according to patients’ age, histological grade, pathological stage, IHC-based subtype, relapse, and death.
Prognostic implication and pathological value
RFS and OS calculated with the Cox proportional hazards model for the whole group of patients showed that no peritumoral COL parameters presented prognostic value. In contrast, higher intratumoral COL uniformity was associated with an approximately twofold increased risk of relapse (p = 0.043; CI: 1.02–3.92). When other clinicopathological parameters were included (axillary lymph node metastasis, BMI, pathological stage, and molecular subtype) for a multivariate analysis, this significance was not observed (p = 0.219).
When the analyses were restricted to the luminal breast cancer, higher intratumoral COL quantity was associated with an approximately eightfold increased risk of death (p = 0.017; CI: 1.45–42.48) and a fourfold risk of recurrence (p = 0.031; CI: 1.14–15.01). When axillary lymph node metastasis, BMI, and pathological stage were included for multivariate analysis, there was still a significantly higher risk of death for higher intratumoral COL quantity (p = 0.031) but not with relapse (p = 0.109). Higher intratumoral COL uniformity was associated with an approximately threefold increased risk of relapse (p = 0.009; CI: 1.33–7.72); when the same other clinicopathological parameters were included for multivariate analysis, higher intratumoral COL uniformity was still significantly associated with relapse (p = 0.015; Table 3).
Cox proportional hazards analysis of intratumoral COL parameters.

HR: hazard ratio; 95% CI: 95% confidence interval.
p demonstrates univariate analysis, while padj demonstrates a multivariate analysis (axillary lymph node metastasis, BMI, and pathological stage). For the parameter organization, CI limits were too extensive (EL), thus were not indicated in this Table.
The multivariate response recursive partitioning model determined the cut-off points of 12.857 (p = 0.013) and 11.894 (p = 0.036) for intratumoral COL quantity and intratumoral COL uniformity, respectively, for death and relapse endpoints (Figure 4). Applying these cut-offs, 34 cases presented lower COL quantity (21 luminal A, 1 luminal B, and 12 luminal HER-2) and 8 cases presented higher (5 luminal A and 3 luminal-HER-2). For intratumoral COL uniformity, 35 had lower (23 luminal A, 1 luminal B and 11 luminal HER-2) and 7 had higher values (4 luminal A and 3 luminal HER-2). Kaplan–Meier curves for death and RFS with regard to intratumoral COL quantity and uniformity were produced using the recursive partitioning model cut-offs (Figure 5). Patients whose tumors had intratumoral COL quantity above 12.857 experienced less favorable outcomes: death (p < 0.001) and RFS (p = 0.023). Similarly, for intratumoral COL uniformity, patients with values above 11.894 had significantly higher probability of death (p = 0.013) and relapse (p = 0.008).

Graphic representation of a multivariate response recursive partitioning model to determine the best cut-offs for intratumoral collagen (COL) fibers quantity (top) and uniformity (bottom). In 34 patients with intratumoral COL quantity up to or equal 12.857, none died, and 3 had relapse, while in 8 patients with intratumoral COL quantity above 12.857, 4 died, and 3 had relapse. In 35 patients with intratumoral COL uniformity up to or equal 11.894, 1 died, and 2 had relapse, while in 7 patients with intratumoral COL uniformity above 11.894, 3 died, and 4 had relapse.
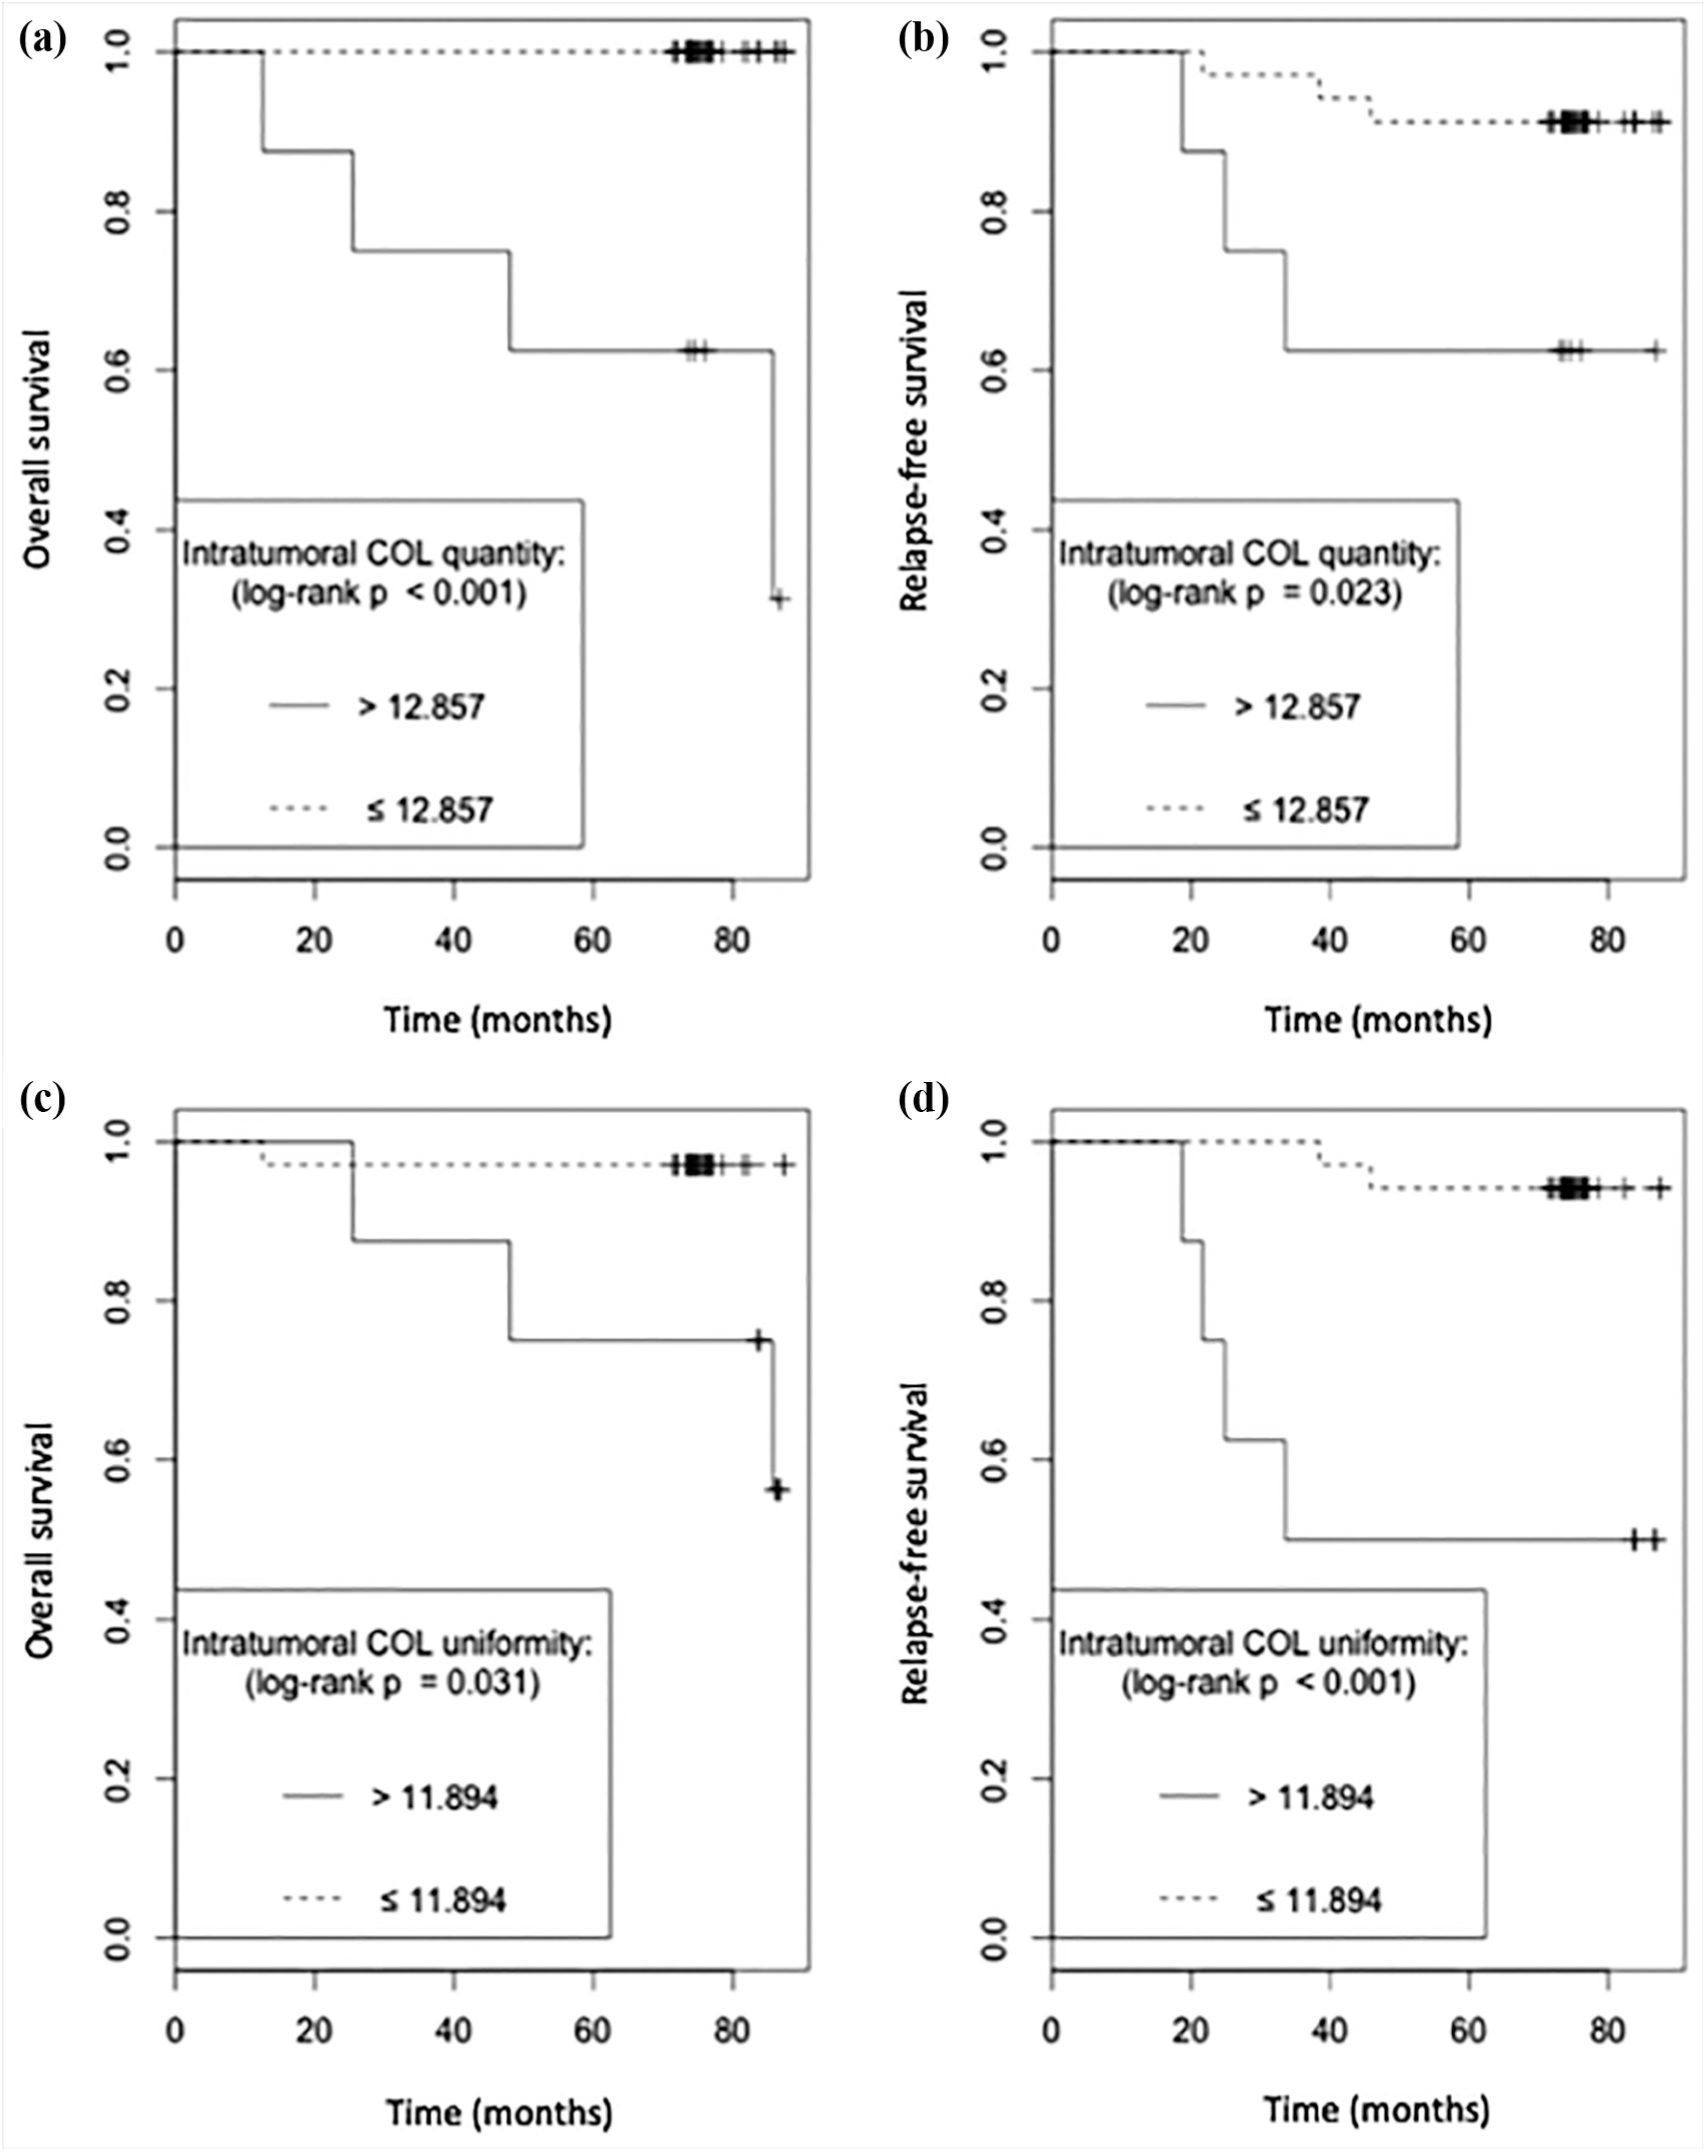
(a) and (b) demonstrate an unfavorable overall and relapse-free survival, respectively, in patients with intratumoral collagen (COL) fibers quantity above 12.857. (c) and (d) demonstrate an unfavorable overall and relapse-free survival, respectively, in patients with intratumoral COL fibers uniformity above 11.894. Cut-offs for COL quantity and uniformity were determined using a recursive partitioning model (for details, see text).
Discussion
Higher intratumoral COL quantity and uniformity significantly correlated with unfavorable RFS and OS among our cases of IHC-based luminal breast cancer. In addition, our results suggest that all COL parameters differ between peri and intratumoral areas, which may reflect different interactions between COL and the microenvironment inside and outside breast cancer. Therefore, although there was a moderate correlation between peri and intratumoral areas, only intratumoral parameters achieved prognostic value. Thus, the importance of studying tumor ECM in evaluating patients with breast cancer should be stressed. These considerations appeared especially valuable in the luminal subtype, for which quantitative analysis by SHG rendered the most considerable results, suggesting that such parameters could be part of a biologically based classification system.
Previous studies on COL evaluation in breast cancer stroma have demonstrated that the relation of spatial and quantitative parameters could be related to outcome.17,18,20,33,34 However, this study was innovative, in that we have compared COL parameters with IHC-based subtypes of breast cancer. For example, in the study by Conklin et al., 18 COL parameters were considered for each one of the tumor features, histological grade, expression of hormone receptor, and HER-2 status. The IHC-based molecular subtyping used herein considers groups of biologically related types of breast cancer, integrating the features which were individually analyzed before, as explored by Brabrand et.al. 35 This subtyping is clinically relevant for both prognostic evaluation and therapeutic decision in breast cancer patients. Therefore, the heterogeneity in the luminal subtype, which had already been evidenced,25–27 was further confirmed by our data, using the evaluation of COL fibers.
The results of earlier reports on the utility of examining tumor stromal reactions using a standard visual microscopic analysis of SHG images (TACS) are supported by our study and continue to be recognized.36–38 This approach is also different from ours, as TACS represents a semiquantitative model. 18 Our model generated independent numerical values of COL parameters, like quantity and uniformity, which were sufficient to determine RFS and OS. The feasibility of the technique was reinforced herein by the inter-rater agreement in SHG imaging, as subjectivity in the process of demarcating tumor areas to be analyzed was irrelevant, so high reproducibility can be expected.
Moreover, the loss of information due to the lack of detection of backward SHG signals was shown minimal by Abraham et al., 39 and there should be no loss of information with clinicopathological impact. These authors have evaluated forward/backward signals in COL fibers associated to breast cancer cell cultures and obtained similar implications for both evaluations, which inclined them to conclude that either of them presented comparable value in relation to tumor aggressiveness. 39
A subsequent study using IHC to detect ECM components (e.g. tenascin, type IV COL, and fibronectin) has confirmed its prognostic value in cancer patients, according to the predominant element. 40 Furthermore, it has been demonstrated that breast cancer stroma disorganization could predict poor response to neoadjuvant chemotherapy, using H&E and Heidenhain’s AZAN trichrome staining, 41 but this technique could not identify the isolated role of COL as the major responsibility for this outcome. The prognostic value of COL organization was not proven in this study; only quantity and uniformity presented clinical relevance.
It is important to emphasize that not only molecular mechanisms within cancer cells respond for cancer behavior. 42 Among the other hallmarks of oncogenesis, tumor microenvironment, its cellular and molecular components, as well as its three-dimensional structure represent important features explaining tumor progression, with potential predictive and prognostic impact. 43 A recent study demonstrated that breast cancer microenvironment, in special increased proportion of tumor stroma, was associated with tumor budding, a feature previously reported as indicative of unfavorable OS. 44
In this context, high COL uniformity could be translated as higher approximation of fibers, 30 which was correlated with poorer RFS and OS. The presence of dense clusters of COL was already shown to indicate increased matrix stiffness, which correlated with poor survival.45,46 Increased tissue rigidity or matrix stiffness seems to play a significant role during tumor progression, mainly by the activation of the Hippo pathway. 47 In this case, yes-assciated protein (YAP) could regulate the expression of the same genes in cancer-associated fibroblasts, like ANLN, DIAPH3 and MYL9. This could reinforce the circle that helps to maintain the fibroblast phenotype, inducing matrix stiffening. 47 Moreover, high matrix stiffness promotes, in cancer cells, nuclear translocation of TWIST1 by releasing this molecule from its cytoplasmic binding G3BP2; loss of G3BP2 leads to a constitutive TWIST1 nuclear localization and synergizes with increasing matrix stiffness to induce epithelial-mesenchymal transition and promote tumor invasion and metastasis. 48
On the other hand, studies using diverse biological specimens have shown that SHG detect primarily type I and II COL (both form aligned fibers) and myosin within acto-myosin complexes, but not type III and IV COL, as these do not produce adequate SHG signals for imaging.12,49 In this context, SHG signals detected in breast cancer tissue originate mostly in type I COL, since type II COL is only deposited in metaplastic breast cancer, specifically matrix-producing breast cancer. 50 As for myosin and microtubules, only in muscles and neurons they present enough organization to generate an SHG signal comparable to COL fibers signal. Also, these elements can be observed mostly in the absence of COL.51,52
SHG image analysis of COL represents a clinically relevant and promising approach to breast pathology, as it renders possible to distinguish diverse pathological entities. 53 Our findings help to characterize the changes in the ECM associated with tumor RFS and OS. The description of COL in tumor ECM might facilitate the identification of tumor invasion because alterations in ECM parallel breast tumor relapse. 1 Thus, SHG signals could be used to (1) differentiate between healthy and tumor tissues, since peri and intratumoral areas presented distinct COL parameters in this study and (2) determine tumor prognosis (RFS and OS) simultaneously. A problem mentioned in the evaluation of SHG images is the area occupied by cells (neoplastic, endothelial, stromal cells). However, a previous report addressing this issue demonstrated that the area of the cellular component does not represent a confounding variable. 53
The relatively small numbers of patients in each group represent a limitation of this study, which warrants further confirmation by independent researchers. The technique used in this study as well as the understanding of the physical principles required is not widely applied by the pathologists for now. However, these novel relevant results in human specimens could evolve to the development of more accessible instruments, as it has happened with the molecular pathology. These results present potential clinical value in prognostic stratification, including microenvironmental features together the classical clinicopathological parameters. In analogy to the inclusion of an “immunoscore” 54 to the classification of cancer, data on the tumor matrix could complete the information needed for a given neoplasia to explain and treat tumor progression and metastatization.
In summary, our findings demonstrate that the evaluation of SHG images is a straightforward and reasonable method for the assessment of COL parameters in the ECM associated to breast cancer, which might ultimately be clinically useful to evaluate prognosis. This is especially true for the luminal subtype breast cancer, which could benefit from the inclusion of COL parameters of prognostic relevance.
Footnotes
Acknowledgements
Rodrigo A Natal and José Vassallo contributed equally to this article.
Declaration of conflicting interests
The author(s) declared no potential conflicts of interest with respect to the research, authorship, and/or publication of this article.
Funding
The author(s) disclosed receipt of the following financial support for the research, authorship, and/or publication of this article: The authors thank the National Institute of Science and Technology on Photonics Applied to Cell Biology (INFABiC) at the State University of Campinas for access to equipment and assistance; INFABiC is co-funded by Fundação de Amparo à Pesquisa do Estado de São Paulo (FAPESP) (08/57906-3) and Conselho Nacional de Desenvolvimento Científico e Tecnológico (CNPq) (573913/2008-0).