
Abstract
Background:
Gastric cancer is common malignancy and exhibits a poor prognosis. At the time of diagnosis, the majority of patients present with metastatic disease which precludes curative treatment. Non-invasive biomarkers which discriminate early from advanced stages or predict the response to treatment are urgently required. This study explored the cytokeratin-18 fragment M30 and full-length cytokeratin-18 M65 in predicting treatment response and survival in a randomized, placebo-controlled trial of advanced gastric cancer.
Methods:
Patients enrolled in the SUN-CASE study received sunitinib or placebo as an adjunct to standard therapy with leucovorin (Ca-folinate), 5-fluorouracil, and irinotecan in second or third line. Treatment response rates, progression-free survival and overall survival were assessed during a follow-up period of 12 months. Cytokeratin-18 fragments were analyzed in 52 patients at baseline and day 14 of therapy.
Results:
Levels of M30 correlated with the presence of metastasis and lymph node involvement and decreased significantly during chemotherapy. Importantly, baseline levels of M30 were significantly higher in patients who failed therapy. In addition, patients who did not respond to treatment were also identifiable at day 14 based on elevated M30 levels. By stepwise regression analysis, M30 at day 14 was identified as independent predictor of treatment response. Likewise, serum levels of full-length cytokeratin-18 M65 at baseline also correlated with treatment failure and progression-free survival. The addition of sunitinib did not exert any effects on serum levels of M30 or M65.
Conclusion:
The cytokeratin-18 fragment M30 at day 14 identifies patients that fail to second- or third-line therapy for advanced gastric cancer. Validation of this non-invasive biomarker in gastric cancer is warranted.
Keywords
Introduction
Gastric cancer is one of the most common tumor entities worldwide with an incidence of 13 newly diagnosed cases per 100,000 persons per year. In up to 50% of newly diagnosed cases, patients exhibit advanced, metastatic stage, which is incurable and exhibits a median survival of 6–9 months. 1 Standard therapy in advanced stages consists of multimodal radio-chemotherapy and surgery, if resection is feasible. Overall survival (OS) is dependent on the stage at the time of diagnosis, and 5-year survival can be as high as 78% in early stages or as low as 4% in metastatic stages. 2 The standard chemotherapeutic regimen in advanced stages consists of leucovorin (Ca-folinate), 5-fluorouracil (5-FU), and irinotecan. Although frequently employed, tumor markers, including carcinoembryonic antigen (CEA) and CA 19-9, exhibit a low sensitivity in advanced stage and no additional benefit in predicting treatment response. 3 Therefore, current guidelines for gastric carcinoma do not recommend the use of tumor markers during therapy. 4
The response to therapy is commonly monitored on clinical grounds and radiological imaging, while laboratory testing is being performed for safety. Tumor characteristics including the expression of neo-antigens or somatic tumor mutations (e.g. involving KRAS or MYC genes) have been studied to personalize the treatment. However, currently, no non-invasive marker is available to assess the disease stage or predict the therapeutic response in advanced gastric cancer. So-called “liquid biopsies” are being developed to assess tumor characteristics non-invasively, and in the future, these markers could help to reduce the necessity of direct tumor biopsies.
Cytokeratins are protein components of intermediate filaments and are expressed in epithelial and endothelial cells, constitute the cellular matrix, and are responsible for the mechanical stability of cells. 5 The cleavage of cytokeratin-18 by activated caspases 3, 7, and 9 produces a neoepitope that has been termed M30. 6 As caspase activation is a hallmark of apoptotic cell death and does not occur to the same extent during necrotic cell death, the concurrent detection of M65—full-length non-cleaved cytokeratin-18—allows for estimation of the relative amount of apoptotic versus necrotic cell death. Since these two protein fragments monitor cell turn-over—a hallmarks of cancer cells—they could be attractive candidates for biomarker studies. Previous studies have explored the role of M30 and M65 in patients with steatohepatitis and were able to distinguish different stages of this liver disease. 7 In addition, a prognostic role of M30 and M65 has been suggested in non-small cell lung cancer (NSCLC) 8 and colon cancer. 9 Therefore, we hypothesized that M30 and M65 can predict treatment response in the randomized controlled SUN-CASE study of advanced gastric cancer.
Material and methods
Study design and ethical considerations
The SUN-CASE study is a double-blind, placebo-controlled, multicenter, phase II clinical trial that was conducted to evaluate the efficacy, safety, and tolerability of the multi-targeted receptor tyrosine kinase sunitinib as an adjunct to second- and third-line leucovorin (Ca-folinate), 5-FU, and irinotecan (FOLFIRI). 10 Patients were randomized to receive 6-week cycles of FOLFIRI every 2 weeks and sunitinib or placebo continuously for 4 weeks followed by a 2-week rest period. The primary study endpoint was progression-free survival (PFS). Therapy response was defined according to the RECIST 1.1 criteria. In short, complete response (CR) was defined as the disappearance of all target lesions and a reduction of the size of pathological lymph nodes (below 10 mm in the short axis). Partial response (PR) was defined as a 30% decrease or more in the sum of diameters of the target lesion compared to baseline. Progressive disease (PD) was defined by a 20% or more increase in the sum of diameters of target lesions. In addition to the relative increase of 20%, the sum must also demonstrate an absolute increase of at least 5 mm. All other cases were defined as stable disease (SD). 11 The study was performed in Germany after approval of the ethics committees according to the International Conference on Harmonization, Good Clinical Practice, and the Declaration of Helsinki and was registered in the public NCT Clinical Trials Registry (NCT01020630). For the analysis of the cell death markers, serum samples of 52 patients were available.
Blood collection and M30/M65 enzyme-linked immunosorbent assay
Blood for M30 and M60 measurements was obtained during clinical visits at day 0 and day 14. Whole blood was centrifuged at 313g for 10 min and serum stored at −80°C until analysis. Maximum storage time was 12 months. Serum for analysis was available from 52 patients from 11 different centers. Cytokeratin-18 fragments were quantified by commercially available M30 Apoptosense® enzyme-linked immunosorbent assay (ELISA) kit and M65 kit (PEVIVA, Bromma, Sweden) according to the manufacturer’s instructions.
Statistical analysis method
Descriptive statistics were computed for all variables using IBM SPSS Statistic Version 21.0 (Armonk, NY, IBM Corp.). These include means and standard deviations or medians and 25th and 75th percentiles for continuous factors. For categorical variables, frequencies and percentages were calculated. Univariable regression analysis was used to examine association between two variables. Differences between groups were calculated by Mann–Whitney U, student’s t-test, or the Kruskal–Wallis test. All tests were two-tailed, with a significant p-value defined as <0.05.
Results
Patient characteristics of the study population
In the SUN-CASE study, 91 patients were randomized to receive sunitinib or placebo in addition to FOLFIRI according to the study protocol (Figure 1). The levels of M30 and M65 before and after treatment were measured in a subset of patients with available serum samples and stratified according to treatment response and survival (Figure 2). Patient characteristics are summarized in Table 1. Patients were predominantly male (68.6 %) with a median age of 60.5 years. In total, 31 patients (57.4%) exhibited gastric cancer, 16 patients (29.6%) exhibited cancer of the gastroesophageal junction, and 6 patients (11.1 %) exhibited cancer of the lower esophagus. In one patient (1.9%), the location was unavailable. The majority of patients exhibited advanced stage T3 (n = 18; 33.3%) or T4 (10 patients, 18.5%). In 14 patients, T stage could not be assessed (TX; 25.9%). Only seven patients had no lymph node involvement at study inclusion (13.0%), while 33.3%, 20.4%, and 16.7% exhibited N1, N2, and N3, respectively. The majority of patients (42.8%) had metastatic disease (M1). The number of organs that were affected by metastases was 1 in 15 patients (27.8%), 2 in 19 patients (35.2%), 3 in 12 patients (22.2%), and 4 in 7 patients (13.0%). Hepatic metastases were most frequent, accounting for 44.4% of all metastatic cases. At study entry, 42 patients (77.8%) had received one previous palliative treatment line, 11 patients (20.4%) had two treatment lines, and one patient (1.9%) had three previous treatments. Previous surgery was performed in 40 patients (74.1%) with a median of one surgical procedure (range, 0–6). In the subgroup included for analysis, the distribution was 26 patients (48.1%) in the sunitinib arm and 28 patients (51.9%) in the placebo arm.

The consort flowchart of the SUN-CASE study with all patients included in the study. 39 patients of all 91 patients in the SUN-CASE study were excluded for missing serum samples. Of the 51 patients with M30 measurement, 25 showed an increased M30 value above 222.52 U/L. Nine patients showed an above-average long overall survival (above 255 days) despite elevated M30. Of the 19 patients with M65 measurement, 9 showed an increased M65 value above 768 U/L. Two patients showed an above-average long overall survival (above 255 days) despite elevated M65 (data not shown).

Levels of M30 and M65 in response to chemotherapy. Median levels of M30 at day 14 in responder are significantly lower (day 14: 97.98 U/L vs 421.81 U/L; p = 0.02) compared to non-responder. Levels of M65 differ significantly at baseline (day 0: 605.50 U/L vs 1471.33 U/L; p = 0.047).
Cohort characteristics.

BMI: body mass index; PFS: progression-free survival; CR: complete response; PR: partial response; SD: stable disease; PD: progressive disease.
Cell death marker in patients with advanced gastric cancer
First, serum levels of M30 and M65 were analyzed according to patient and disease characteristics. Patients with metastatic disease exhibited significantly higher levels of M30 and M65, both at day 0 and day 14 of treatment (Suppl. 1). The highest levels of M30 were detectable when hepatic metastases were present (Suppl. 2). Likewise, the localization of the primary tumor had a profound effect on levels of M30. Patients with a primary localization in the stomach showed significantly higher levels of M30 at baseline compared with patients with cancer of the gastroesophageal junction or the esophagus. Patients with lymph node involvement greater than N1 showed significantly higher levels of M65. No correlation of M30 and alanine aminotransferase levels was observed in the study population. The effect of patient and tumor characteristics on M30 and M65 are summarized in Suppl. 2.
Changes in M30 and M65 in response to chemotherapy
To assess the impact of therapy, serum levels of M30 and M65 were measured at day 0 and day 14. During treatment, median levels of M30 declined significantly from 222.52 U/L at day 0 to 131.75 U/L at day 14. Interestingly, in patients with metastatic disease, no significant decrease was observed with therapy. In parallel, M65 decreased from 768 U/L to 648 U/L in the study population (Suppl. 1). No additive effect of sunitinib was detectable when compared with placebo. Interestingly, patients that did not respond to the treatment showed significantly higher levels of M30 at day 14 of treatment compared with patients that responded (Table 2: median M30 at day 14: 421 vs 98 U/L; p = 0.002). Likewise, levels of M65 at day 0 also differed significantly between responders and non-responders (median M65 605 vs 1471 U/L; p = 0.047, Table 2). To further explore the impact of M30 and M65 in gastric cancer, patients were analyzed in two groups above or below the median value of M30, respectively, M65 at the corresponding time points. In patients with an M30 level above 131.75 U/L, treatment failure was significantly more likely (odds ratio (OR) = 0.263). Likewise M65 above 768 U/L at day 0 correlated with treatment failure. By stepwise logistic regression analysis, levels of M30 at day 14 and M65 at day 0 correlated with treatment failure. Strikingly, none of the other analyzed factors, including tumour, node, metastasis stage or the number of previous therapies, predicted treatment failure in this study (Suppl. 2).
Levels of M30 and M65 at baseline and day 14 according to treatment response.
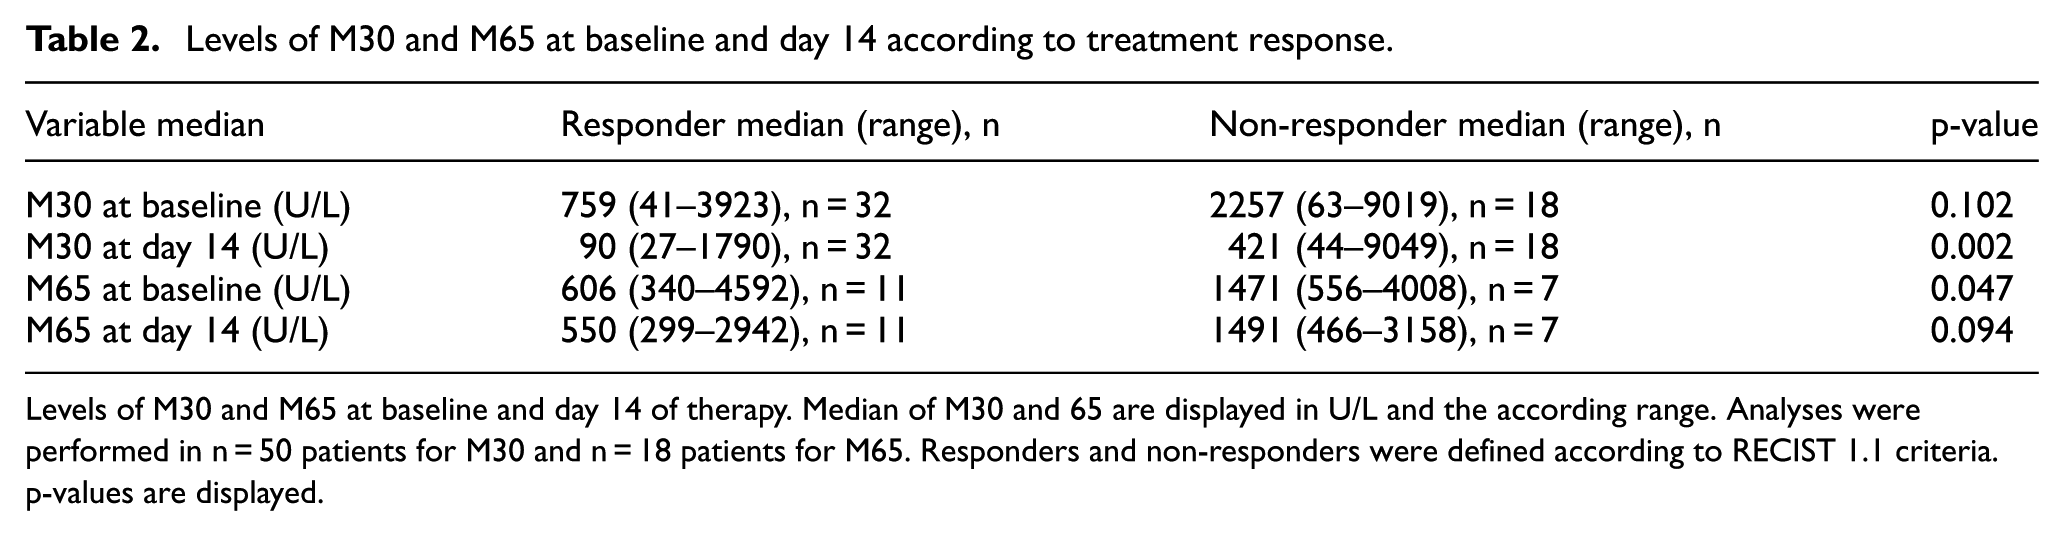
Levels of M30 and M65 at baseline and day 14 of therapy. Median of M30 and 65 are displayed in U/L and the according range. Analyses were performed in n = 50 patients for M30 and n = 18 patients for M65. Responders and non-responders were defined according to RECIST 1.1 criteria. p-values are displayed.
M30 and M65 predict PFS and OS in advanced gastric cancer
To determine the prognostic effect of M30 and M65 during treatment, patients were followed up for 12 months, and outcome was analyzed according to baseline characteristics, M30 and M65 levels. By exploratory analysis, we were able to identify two groups with values above, respectively, below the median of M30 at day 14 and M65 at day 0 to be predictive of PFS and OS. In patients with a value below the median of 131.75 U/L M30 at day 14, PFS was significantly longer compared with patients with higher levels (median PFS: 47 vs 168 days, p = 0.039). Likewise, M65 above 768 U/L at day 0 was associated with a significantly shorter PFS (median PFS: 47 vs 249 days, p = 0.018; Figure 3). For OS, an M30 value above 222.52 U/L (178 vs 332 days, p = 0.029) and a value of M65 above 768 U/L at day 0 (117 vs 332 days, p = 0.009) were associated with a significantly shorter OS (Figure 4). Clinical and pathological factors and their association with PFS and OS are summarized in Suppl. 3.

Progression-free survival of patients with advanced gastroesophageal carcinomas. Significant differences in survival of patients with (a) M30 above and below the median value at day 14 (M30 d14 high vs low; p = 0.039) and (b) M65 above and below the median at day 0 (M65 d0 high vs low; p = 0.018.).
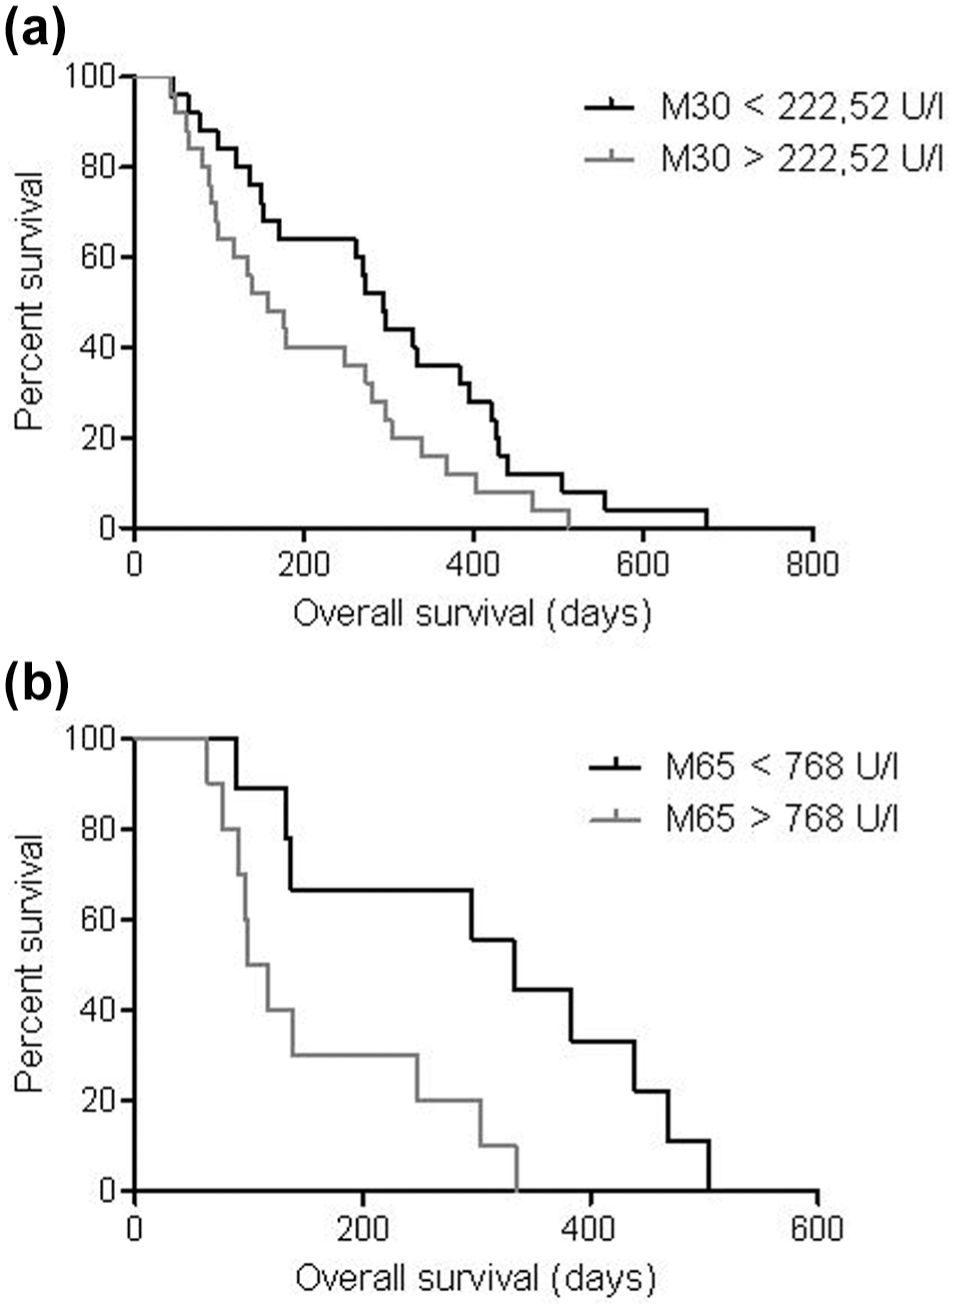
Overall survival in patients with advanced gastroesophageal carcinomas. (a) A value above M30 222.52 U/L (p = 0.029) and (b) above M65 786 U/L both at day 0 (p = 0.009) showed a significantly lower overall survival.
By univariate cox regression analysis, patients with M30 values higher than 131.75 U/L at day 14 and M65 values greater than 786 U/L at day 0 had a significant higher risk of death (hazard ratio (HR) of 1.84 and 3.5, respectively) and disease progression (HR of 2.05 and 4.45, respectively). Furthermore, the median of M30 (p = 0.033) and M65 (p = 0.015) before therapy and the number of previous lines of treatment (p = 0.048) were predictive of treatment response. Using multivariate multiple regression, M30 at day 14 remained the only independent predictor of treatment response (OR, 0.997; 95% confidence interval (CI): 0.995–1.000; p = 0.027).
Discussion
The current biomarker study explored the role of cell death markers in predicting the clinical outcome in advanced gastric cancer. The cytokeratin-18 fragment M30 and the full-length M65 were assayed in the serum of patients with advanced gastric cancer that participated in a randomized, placebo-controlled and analyzed these two markers according to primary tumor location, the PFS, and OS. M30 cytokeratin-18 fragments have previously been studied in a variety of tumor entities including NSCLC, breast cancer, testicular, prostate, pancreatic, and colorectal carcinoma.12–15 Most of these studies focused on baseline values reflecting the tumor load and stage of the disease and were retrospective analysis. In these studies, elevated levels of M30 were observed in advanced disease and correlated with a poor prognosis. A role of M30 in gastric cancer was first described in an uncontrolled cohort study. Herein, baseline levels of M30 correlated with disease progression and poor prognosis. 16 Following chemotherapy, M30 peaked at 48 h and this increase was less pronounced in patients that failed treatment with impaired PFS and OS.16,17 These data supported the view that induction of apoptosis by cytotoxic chemotherapy correlates with treatment success. However, the above-mentioned studies suffered from the uncontrolled design and included only a small, highly selected patient population. Therefore, further exploration of M30 and M65 in gastric carcinoma was warranted. The current analysis was performed in a multicenter, prospective, randomized controlled trial on the use of sunitinib in addition to standard therapy with leucovorin (Ca-folinate), 5-FU, and irinotecan. The trial explored the additional benefit of sunitinib to standard of care on PFS or OS and did not meet the primary endpoint. 10 However, we did observe a significant reduction of M30 and M65 during therapy independently of tumor load. Again, the multi-tyrosine kinase inhibitor sunitinib did not have an added effect on M30 or M65 reduction. Interestingly, higher levels of M30 were detected in patients with hepatic metastases independent of the treatment. This is likely related to the abundance of type 1 intermediate filament in liver tissue from which cytokeratin-18 is derived. 18 Likewise, the primary localization of the cancer had an impact on M30 levels. Patients presenting with adenocarcinoma of the lower esophagus exhibited the lowest, while patients with gastric cancer exhibited the highest levels of M30. Furthermore, serum levels of M65 correlated with the presence of lymph node metastasis before and after therapy.
The current analysis identifies M30 both as a prognostic biomarker according to the BEST classification of the Food and Drug Administration (FDA). 19 By defining a cut-off for M30, 16 of 25 patients that had levels of M30 above this cut-off at day 0 exhibited a significantly lower survival, while only 9 in this group had a longer survival compared to the mean OS. Similar results were obtained when M65 was analyzed at day 0. Thus, M30 identified patients that were more likely to experience an unfavorable outcome.
Current anti-cancer therapies rely heavily on the induction of cell death in malignant cells, and the therapeutic efficacy correlates with the degree of apoptosis and/or necrosis. 20 This can be achieved by either direct cytotoxic effect or the induction of an immune response, for example, through the use of check-point inhibition by PD-1 inhibition. 21 In this study, increased values for M30 and M65 were found in patients that did not respond to therapy. M30 measured at day 14 predicted treatment failure and patients below 131.75 IU/mL exhibited a significantly longer PFS. Likewise, a significantly higher OS was observed in patients with a M30 below 222.52 U/L. Comparably, M65 at baseline was significantly higher in patients with treatment failure. Thus, M30 and M65 were also predictive of treatment response according to the BEST classification of the FDA. 19 Previous studies found that increased levels of M30 taken within 48 h of therapy are predictive of a good therapeutic response 15 and related these findings to the induction of apoptosis in transformed cells. In contrast, this study explored M30 and M65 at day 14 of therapy and therefore in a steady-state level. At this time, M30 and M65 are likely linked to the amount of cellular proliferation and cell death which are related to the tumor microenvironment that is influenced by hypoxia, the supply of nutrients, and the immune response. 22 Therefore, elevated levels of M30 and M65 at day 14 are likely to reflect tumor progression rather than regression.
The development of non-invasive biomarkers for screening, prognosis, or prediction of treatment response would be of great value in gastrointestinal oncology. Currently, patient and physician decisions to guide treatment recommendations are predominantly based on disease stage and Eastern Cooperative Oncology Group (ECOG). Tumor characteristics including specific oncogenes or signaling pathways are slowly emerging, but all attempts to implement a biomarker have so far been hampered by the overall low sensitivity and specificity of the candidates. The established and most frequently used biomarkers in gastric cancer include CEA and Ca72-4; however, their role in the management is low. The cell death markers explored in this study are independent of the expression of a specific protein. Cytokeratin filaments that yield M30 and M65 are ubiquitously expressed at different levels. Cell turnover and cell death—a physiological process—yield a constant but low level of detectable levels of M30. Increased levels of M30 and M65 have been used to stage and predict the course of acute and chronic liver disease in well-controlled cohorts.7,23 In the context of malignancy, increased apoptosis occurs from therapeutically induced cell death but also the proliferation of cancer cells. The current data suggest that M30 and M65 could have a predictive in patients with advanced gastric cancer. A serum-based biomarker could help to identify patients that benefit from therapy and allow live monitoring during therapy. In addition, we observed higher levels of M30 and M65 in patients with metastatic disease—especially when hepatic metastases were present. Therefore, the addition of these biomarkers to the diagnostic work-up of patients with histologically confirmed gastric cancer could be helpful to further identify metastases and lymph node involvement in addition to imaging modalities. The SUN-CASE study was designed with an accompanying, prospective biomarker program. In the current analysis samples of 52 of the 91 randomized patients were used for biomarker analysis. Importantly, the clinical characteristic of this subgroup did not differ from the entire cohort. 10
In summary, the current analysis suggests that M30 and M65 in the serum of patients with advanced gastric cancer undergoing palliative chemotherapy could be used as a predictive biomarker for treatment response. Also, a correlation with disease location and the presence of metastasis was established. Importantly, pretreatment levels of M65 and levels of M30 at day 14 of therapy were prognostic and reflected increased PFS and OS. Prospectively designed trials will have to confirm the examined cut-offs and the added value of these markers in patients undergoing chemotherapy for advanced gastric cancer.
Translational impact. The development of novel, prognostic, and predictive biomarkers in advanced gastric cancer will allow to personalize treatment. Markers of cell death could proof a useful addition to the established diagnostic methods in this context.
Supplemental Material
Supp_1 – Supplemental material for Cytokeratin-18 fragments predict treatment response and overall survival in gastric cancer in a randomized controlled trial
Supplemental material, Supp_1 for Cytokeratin-18 fragments predict treatment response and overall survival in gastric cancer in a randomized controlled trial by Michael Nagel, Julia Schulz, Annett Maderer, Katrin Goepfert, Nadine Gehrke, Thomas Thomaidis, Peter C Thuss-Patience, Salah E Al-Batran, Susanna Hegewisch-Becker, Peter Grimminger, Peter Robert Galle, Markus Möhler and Jörn Markus Schattenberg in Tumor Biology
Footnotes
Acknowledgements
The authors acknowledge all patients and their families for their contribution. Markus Möhler and Jörn Markus Schattenberg are both senior authors contributed equally.
Declaration of conflicting interests
The author(s) declared no potential conflicts of interest with respect to the research, authorship, and/or publication of this article.
Funding
The author(s) disclosed receipt of the following financial support for the research, authorship, and/or publication of this article: Funding was obtained from the German Federal Ministry of Education and Research (FKN 01KN0703).
References
Supplementary Material
Please find the following supplemental material available below.
For Open Access articles published under a Creative Commons License, all supplemental material carries the same license as the article it is associated with.
For non-Open Access articles published, all supplemental material carries a non-exclusive license, and permission requests for re-use of supplemental material or any part of supplemental material shall be sent directly to the copyright owner as specified in the copyright notice associated with the article.