
Abstract
Our study aims to evaluate the efficacy of transcatheter arterial chemoembolization in the treatment of patients with liver metastasis using integrated 18F-fluorodeoxyglucose positron emission tomography/computed tomography. A total of 97 liver metastasis patients treated by transcatheter arterial chemoembolization were enrolled in this study. The 18F-fluorodeoxyglucose positron emission tomography/computed tomography images of liver metastasis patients were collected before and after transcatheter arterial chemoembolization treatment. The efficacy of transcatheter arterial chemoembolization for the treatment of liver metastasis was evaluated according to the revised Response Evaluation Criteria in Solid Tumors guidelines. The receiver operating characteristic curve analysis was used to determine cut-off values of 18F-fluorodeoxyglucose positron emission tomography parameters (Tsuvmax, Tsuvmax/Lsuvmax, and Tsuvmax/Lsuvmean) for predicting the efficacy of transcatheter arterial chemoembolization. Progression-free survival and the incidence of postoperative complications were compared. Correlation of Tsuvmax, Tsuvmax/Lsuvmax, and Tsuvmax/Lsuvmean with blood supply and lipiodol deposition in the lesion was analyzed. Among three 18F-fluorodeoxyglucose positron emission tomography parameters, the receiver operating characteristic analysis showed that Tsuvmax/Lsuvmax with a cut-off value of 3.56 was the best predictor of transcatheter arterial chemoembolization efficacy. According to the cut-off value of Tsuvmax/Lsuvmax, liver metastasis patients were divided into the Tsuvmax/Lsuvmax ≤ 3.56 and Tsuvmax/Lsuvmax > 3.56 groups. Compared with the Tsuvmax/Lsuvmax > 3.56 group, the Tsuvmax/Lsuvmax ≤ 3.56 group showed a longer progression-free survival and a lower incidence of postoperative complications. The Tsuvmax, Tsuvmax/Lsuvmax, and Tsuvmax/Lsuvmean in the lesion with abundant blood supply were significantly lower than those in peripheral liver parenchyma, while the Tsuvmax, Tsuvmax/Lsuvmax, and Tsuvmax/Lsuvmean in the lesion with lack of blood supply were significantly higher than those in peripheral liver parenchyma. Spearman correlation analysis indicated that lipiodol deposition in the lesion was positively correlated with the Tsuvmax, Tsuvmax/Lsuvmax, and Tsuvmax/Lsuvmean. The Tsuvmax/Lsuvmax of 18F-fluorodeoxyglucose positron emission tomography/computed tomography may be a good tool for predicting the blood supply and efficacy of transcatheter arterial chemoembolization for patients with liver metastasis.
Keywords
Introduction
The liver is the host to metastatic disease for gastrointestinal and extra-gastrointestinal cancers, and particularly, breast, lung, colon, and colorectal cancers often give rise to liver metastasis (LM). 1 Liver involvement is a main determinant for the survival of patients from cancer since it is the largest organ in the body, and it has a unique architecture suited for detoxification of portal blood and protein biosynthesis. 2 Customarily, systemic therapy is the favored therapy for LM, while selected patients who present with limited liver involvement may be applicable for surgical resection, radiotherapy, or minimally invasive focal ablation in order to improve the survival time. 3 Notably, transcatheter arterial chemoembolization (TACE) is a preferred treatment of LM in those patients who do not react to classical medical treatments (e.g. somatostatin analogues and systemic chemotherapy). 4 The early detection of LM is important in liver imaging for ablation therapy, and the success of surgery depends on the locations of metastatic lesions and knowledge of the precise number. 5 Recently, some imaging techniques, notably ultrasound (US), magnetic resonance imaging (MRI), positron emission tomography (PET), computed tomography (CT), and integrated PET/CT imaging, have been applicable to detect and feature focal liver lesions, leading to achievements in the diagnostic capability of LM. 6 18 F-fluorodeoxyglucose positron emission tomography/computed tomography (18F-FDG PET/CT) is well established for staging cancers due to its better sensitivity and specificity in comparison with anatomical imaging. 7 Except that, 18F-FDG PET/CT is also able to measure therapy response earlier during treatment when patients still show no anatomical changes, which indicates that serial 18F-FDG PET/CT scans could be successfully used to detect the early treatment effect in clinical trials of various cancers. 8 In addition, 18F-FDG PET/CT plays a vital role in the differential diagnosis between necrosis and relapse when assessing aggressive tumors and also in establishing dedifferentiation in low-grade lesions. 9 Notoriously, PET lends itself to semi-quantitative analysis, and quantification measurements of tracer uptake are commonly adopted in clinical routine, such as standardized uptake values (SUVs; for example, SUVmean, SUVmax, and SUVpeak). 10 However, 18F-FDG PET/CT uptake sometimes may not accurately reflect tumor response because of confounding factors, including early reduction in activity of viable tumor and increases in uptake which is secondary to inflammatory processes after undergoing chemotherapy and radiotherapy.11,12 As for the role of 18F-FDG PET/CT in LM patients, Velasquez et al. 13 in their study have proposed the results of a multicenter trial that evaluated the repeatability of 18F-FDG PET/CT in those patients who had metastatic cancers in the gastrointestinal tract. A dual-center study has also reported the repeatability of different quantitative indices that are derived from 18F-FDG PET/CT studies in patients with metastatic cancer of ovarian cancer. 14 However, little is known about the characteristics of 18F-FDG uptake and the diagnostic value of 18F-FDG PET in LM patients after TACE. Consequently, our study aims to explore the efficacy of TACE in the treatment of LM patients using integrated 18F-FDG PET/CT.
Material and methods
Ethical statement
This study was approved by the Ethics Committee of the Fifth Affiliated Hospital of Wenzhou Medical University, Affiliated Lishui Hospital of Zhejiang University, The Central Hospital of Zhejiang Lishui, Lishui, China. All patients signed informed consent before study commencement. Study protocols complied with the ethics principles of medical research involving human subjects, which is based on the Declaration of Helsinki. 15
Study subjects
From November 2014 to March 2016, a total of 97 patients who received TACE and were diagnosed with LM by PET/CT total body scanning (TBS) in the Fifth Affiliated Hospital of Wenzhou Medical University, Affiliated Lishui Hospital of Zhejiang University, The Central Hospital of Zhejiang Lishui, Lishui, China, were enrolled in our study. Of these 97 patients, 59 were males and 38 were females (age: 32–68 years; mean age: 55.1 ± 7.3 years). The primary focuses of patients were as follows: 38 cases of intestinal cancer (24 cases of colon cancer, 11 cases of rectal cancer, and 3 cases of small intestinal cancer), 21 cases of gastric cancer, 11 cases of pancreatic cancer, 10 cases of mammary cancer, 7 cases of lung cancer, 3 cases of liver cancer, 2 cases of esophageal cancer, and 1 case of each of the following: endometrial carcinoma, thyroid carcinoma, malignant melanoma, gastric lymphoma, and prostate cancer. Among them, 19 cases were single lesion, and 78 cases were multiple lesions. According to Child–Pugh classification, 16 there were 69 cases in level A and 28 cases in level B. Inclusion criteria were as follows: Patients were diagnosed with LM by 18F-FDG PET/CT and CT examinations and were in accordance with the diagnostic criteria of LM, which was further confirmed by pathology; patients received TACE treatment for the first time, and there was no radiographic evidence of metastasis of other organs except for liver; the number of metastatic lesions was less than 5, and the sum of tumor volume was smaller than 50% of the liver volume; patients without indication for surgical resection or unwilling to surgical resection; Karnofsky Performance Scale (KPS) score >80 points; no serious heart and lung diseases or brain metastases; and primary tumor has been controlled temporarily and would not affect the life of patients. Exclusion criteria were as follows: patients who were allergic to iodine, patients who did not have complete clinical data for failing to complete the laboratory tests, and patients who showed poor compliance.
TACE and postoperative treatments
All the patients received TACE within 1 week after PET/CT examination. The local anesthesia with 2% lidocaine was performed, after which the Seldinger method was used to puncture the right femoral artery for celiac artery and hepatic artery angiography, and further observation of the lesion staining. Some patients were treated with a microcatheter. The 48% chemotherapeutic agents lipiodol (LPD) emulsion was used, and chemotherapeutic agents were selected according to primary focus, including mitomycin, gemcitabine hydrochloride, epirubicin, and 5-floxuridine. The dosage of iodine oil was 5–20 mL, with an average of about 9 mL. The amount of iodine oil was determined by the size of the tumor and the deposition of iodine in the lesion, and limited by the fulfillment of the lesion. Postoperative treatments are described as follows: After surgery, the puncture point of patients was pressed with a sandbag for 2 h and body brake on surgical site was performed for 8 h. Eight hours later, patients could move on the bed, and they were encouraged to do out-of-bed activity after cutting open compression bandage 24 h later. The puncture site was closely observed for bleeding and formation of hematoma as well as postoperative urinary retention and abnormal fluctuation of dorsalis pedis. If there is any abnormal situation, the doctors were informed immediately. A BD indwelling needle was retained after surgery to avoid unnecessary pain caused by venous puncture and improve comfort for patients. The effective blood vessel access was established for patients’ postoperative infusion. All these drugs were purchased from Zhejiang Hisun Pharmaceutical Co., Ltd (Taizhou, Zhejiang, China).
PET/CT examination
All patients received liver PET/CT 2–4 days before and 30–40 days after TACE. PET/CT examination was performed using a Biograph 64 PET/CT scanner (Siemens Ltd, Erlangen, Germany), and image post-processing was performed by TrueD workstation. Before examination, patients were fasting for 4–6 h to make sure that the blood glucose was maintained within 6.5 mmol/L. Patients were injected with tracer 18F-FDG (injection dose of 0.10–0.15 mCi/kg) after resting, protecting from light and prostrating for 15 min. After 50 min repose, patients had general PET/CT scanning from calvarium to proximal femur. The 64-slice spiral CT was first conducted, with the depth of stratum for 5 mm. PET collections were performed by three-dimensional (3D) scanning, with each bed collecting for 1.5 min, totally 5–6 beds. After PET collections, CT, PET, and PET/CT fusion images in local or systemic coronal, sagittal, and transverse planes were obtained. The same level and same scanning parameters were selected before and after surgery for the same patient.
Data collection
Two experienced nuclear medicine physicians with PET/CT read the film with a cross-blind method. (1) Visual observation: Visual observation was used to analyze the quality of PET, CT, and PET/CT images; understand normal physiological uptake, normal variation, and artifacts; and observe intrahepatic and extrahepatic radioactive concentration focus and the location, size, shape, density, and radioactivity distribution of the lesion. (2) Semi-quantitative analysis method for maximum standard uptake value (SUVmax): The region of interest (ROI) was set in the intrahepatic and extrahepatic radioactive concentration focus. A computer program automatically calculated the SUVmax value of the site, which was denoted as Tsuvmax value. For multiple lesions, CT plain scan was used to delineate all the distinguishable ROI lesions, and for these lesions with equidensity and unobvious radioactive concentration, the delineation of ROI was conducted by CT plain scan combined with enhanced CT. In order to evaluate the role of 18F-FDG PET, several parameters were calculated, including the ratio of SUVmax value of liver tumor tissue and normal liver tissue (Tsuvmax/Lsuvmax), and the ratio of uptake SUVmax value of liver tumor tissue and normal liver tissue (Tsuvmax/Lsuvmean). 17
Blood supply classification
According to the hepatic metastases (HMs) reinforcement type and the Choi 18 classification method, blood supply was classified into two categories: abundant blood supply characterized with enhanced arterial phase and lack of blood supply mainly characterized with enhanced portal venous phase or unobvious enhancement both in the arterial phase and the portal venous phase.
Classification of LPD deposition
According to the areas of LPD deposition after TACE, LPD deposition could be classified into three types 19 : type I: LPD deposited well, and the deposition area exceeded 60% of the lesion area; type II: LPD deposited commonly, and the deposition area was 20%–60%; type III: LPD deposited poorly, and the deposition area was less than 20%.
Efficacy evaluation and follow-up
The efficacy of TACE for LM was evaluated according to the revised Response Evaluation Criteria in Solid Tumors (RECIST) guidelines (version 1.1). 20 The efficacy was assessed by complete remission (CR), partial remission (PR), no change (NC), progression of disease (PD), and response rate (RR; RR was calculated as the sum of CR and PR). Progression-free survival (PFS) refers to the time of LM patients from the beginning of the treatment to the disease progression or any cause of death. The deadline of follow-up was March 31, 2016. With the manners of section for outpatients and telephone, the complications of patients and 1 year of PFS were recorded.
Statistical analysis
SPSS 21.0 software (SPSS Inc., Chicago, IL, USA) was used for statistical analysis. Measurement data were represented by mean ± standard deviation (SD;
Results
Receiver operating characteristic curve analysis for selection of 18F-FDG PET parameters
The medians of Tsuvmax, Tsuvmax/Lsuvmax, and Tsuvmax/Lsuvmean were 6.79 (4.03–15.55), 3.19 (1.61–6.59), and 4.04 (1.86–8.77), respectively. According to receiver operating characteristic (ROC) curve analysis (Figure 1), the areas under the curve (AUC) of Tsuvmax, Tsuvmax/Lsuvmax, and Tsuvmax/Lsuvmean were 0.752, 0.805, and 0.792, respectively. The maximum value of Youden’s index (sensitivity + specificity − 1) was regarded as the cut-off value, and the cut-off values of Tsuvmax, Tsuvmax/Lsuvmax, and Tsuvmax/Lsuvmean were 7.84, 3.56, and 4.64, respectively. Therefore, Tsuvmax/Lsuvmax with a cut-off value of 3.56 was the best predictor of TACE efficacy.

Receiver operating characteristic curve (ROC) analysis for selection of 18F-FDG PET/CT parameters: (a) ROC curve of Tsuvmax, (b) ROC curve of Tsuvmax/Lsuvmax, and (c) ROC curve of Tsuvmax/Lsuvmean.
Comparison between clinical features and efficacy of patients between the two groups
According to the cut-off value of Tsuvmax/Lsuvmax, LM patients were divided into the Tsuvmax/Lsuvmax ≤ 3.56 and Tsuvmax/Lsuvmax > 3.56 groups. As shown in Table 1, the percentage of patients with drinking history and tumor diameter >5 cm in the Tsuvmax/Lsuvmax ≤ 3.56 group was significantly smaller than that in the Tsuvmax/Lsuvmax > 3.56 group (p < 0.05). The therapeutic effect of tumor in the Tsuvmax/Lsuvmax ≤ 3.56 group was significantly higher than in the Tsuvmax/Lsuvmax > 3.56 group (p < 0.05). The percentage of patients with lack of blood supply in the Tsuvmax/Lsuvmax ≤ 3.56 group was lower than that in the Tsuvmax/Lsuvmax > 3.56 group (p < 0.05).
Comparison between clinical features and efficacy of patients between the two groups.

AFP: alpha-fetoprotein; CR: complete remission; PR: partial remission; NC: no change; PD: progression of disease; Tsuvmax: maximum standard uptake value of liver tumor; Lsuvmax: maximum standard uptake value of normal liver tissue.
Comparison of 18F-FDG images before and after TACE treatment between the two groups
18F-FDG images of the LM patients in the Tsuvmax/Lsuvmax ≤ 3.56 and Tsuvmax/Lsuvmax > 3.56 groups before and after TACE treatment were observed (Figure 2). After 1 year of follow-up, the recurrence rate was 10.17% (6/59) and 36.84% (14/38), respectively. Normal PET/CT imaging showed bilateral symmetry of thorax, clear image of mediastinal large vessels and cardiac blood pool, radioactive concentration slightly higher than that in the lungs, large difference in cardiac development, more concentrated cardiac development in a few patients, left lower part of the septum and left ventricular myocardium showing thick-walled annular radioactive concentration image for typical patients, low and uniform image in both lungs, no abnormal concentration of radioactive distribution in the lung, and no abnormal concentration of radioactive distribution in other parts of the body (Figure 2(c-2) and (d-2)). Tumor residual or recurrence of the lesions showed nodules or lumps for most, relatively clear boundary, even internal radioactive distribution, localized radiation defects in some lesions, and uneven thickness of the concentration image around the defect image with higher concentration degree (Figure 2(a-2) and (b-2)).
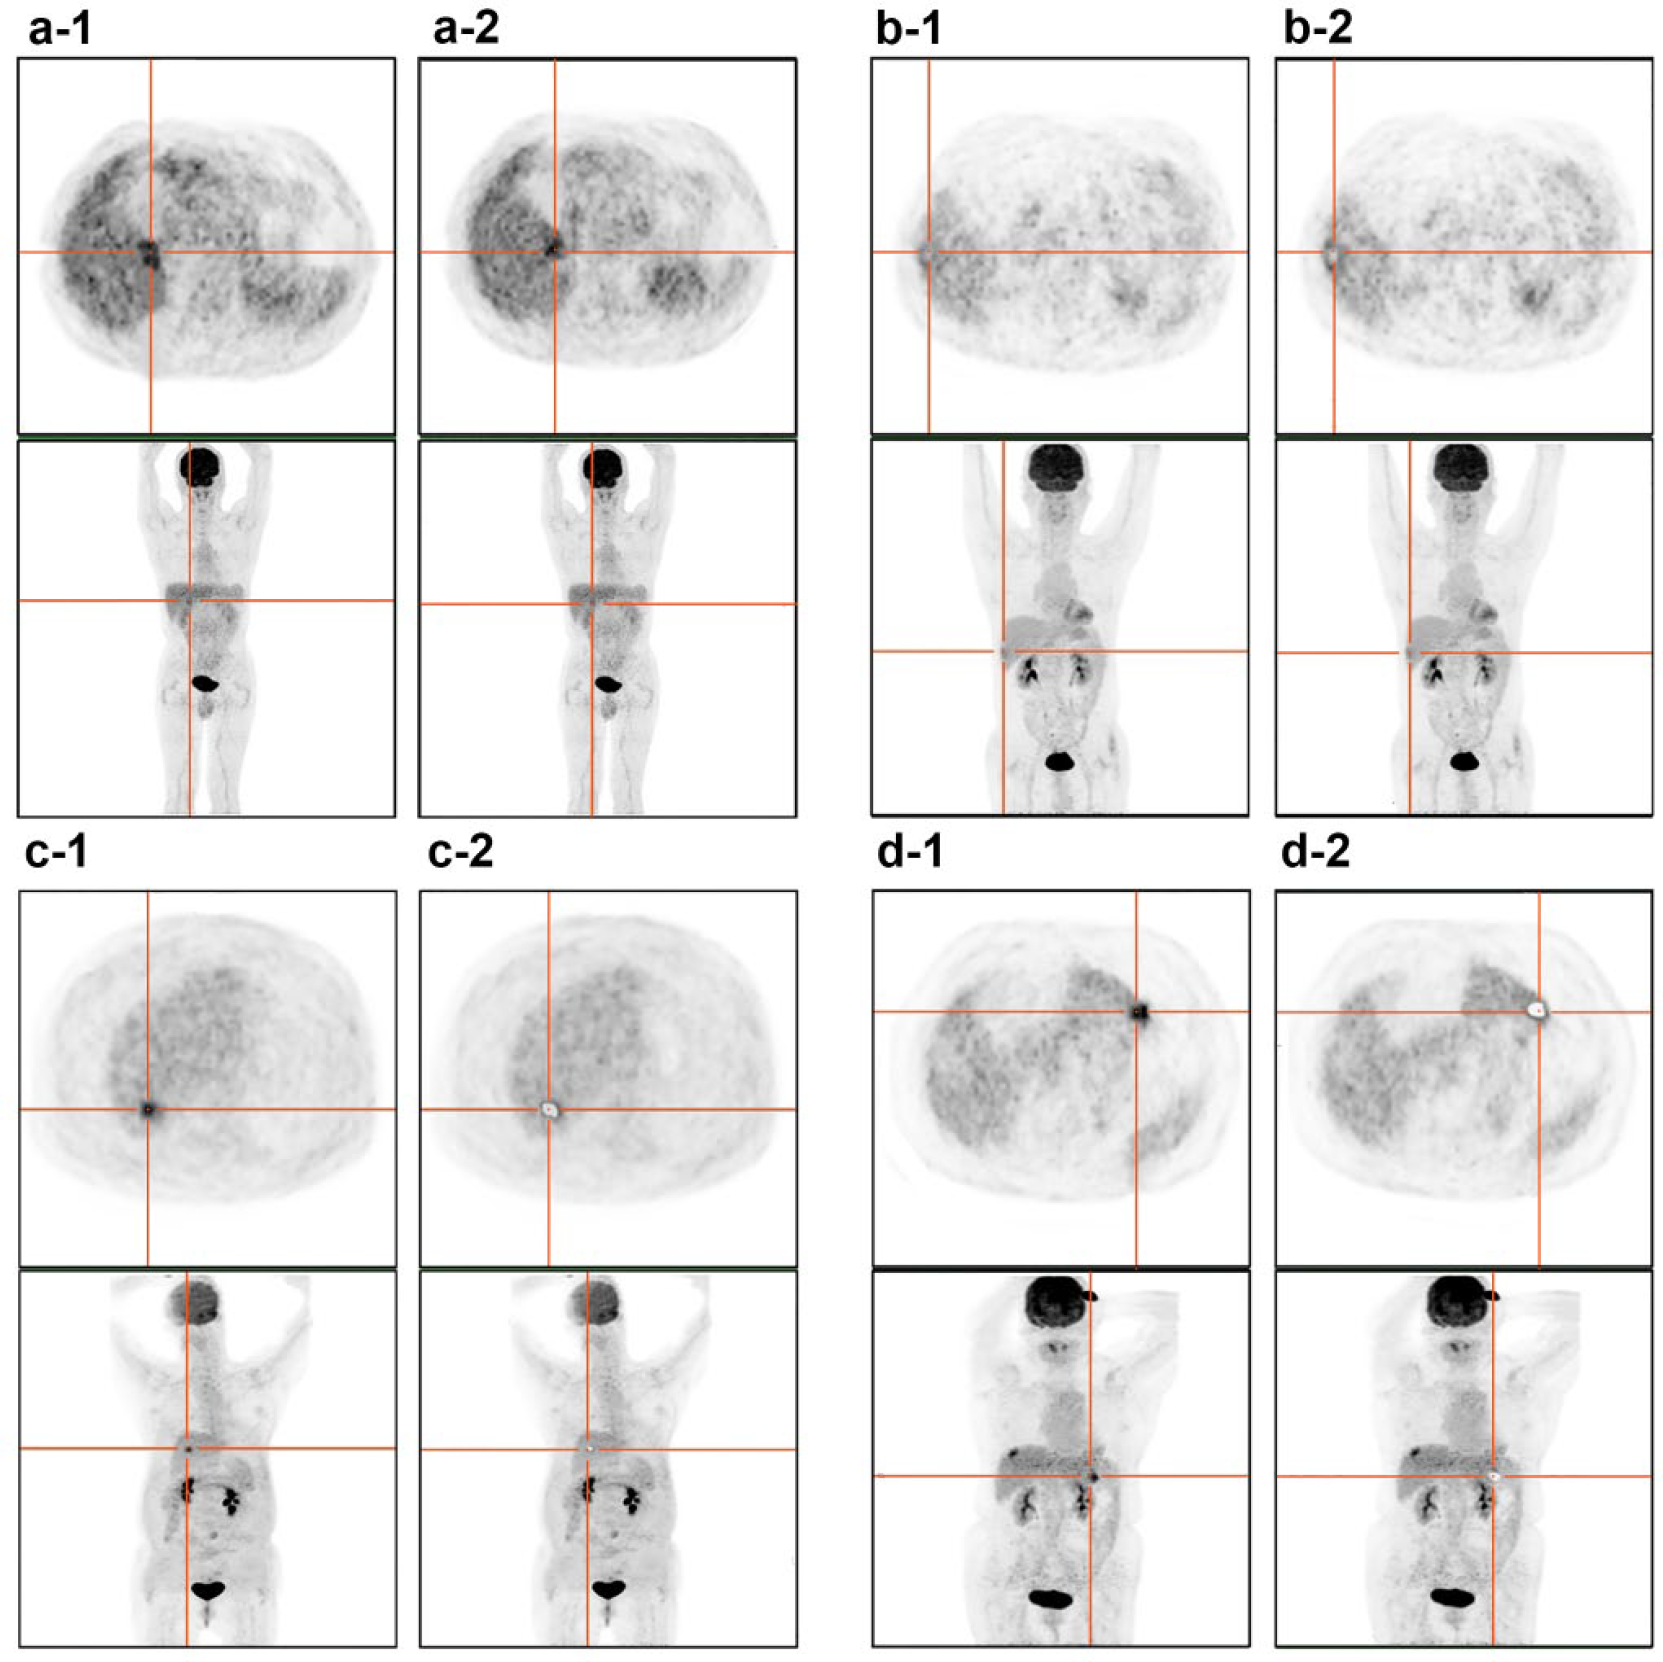
The 18F-FDG PET/CT images of four patients with liver metastasis before and after TACE treatment: (a) A 55-year-old male patient with primary colon cancer (Tsuvmax/Lsuvmax ≤ 3.56): (a-1) PET/CT imaging results before TACE treatment and (a-2) PET/CT imaging results after TACE treatment. (b) A 56-year-old male patient with primary rectal cancer (Tsuvmax/Lsuvmax > 3.56): (b-1) PET/CT imaging results before TACE treatment and (b-2) PET/CT imaging results after TACE treatment. (c) A 59-year-old male patient with primary focus of gastric cancer (Tsuvmax/Lsuvmax ≤ 3.56): (c-1) PET/CT imaging results before TACE treatment and (c-2) PET/CT imaging results after TACE treatment. (d) A 44-year-old female patient with primary focus of pancreatic cancer (Tsuvmax/Lsuvmax > 3.56): (d-1) PET/CT imaging results before TACE treatment and (d-2) PET/CT imaging results after TACE treatment.
Comparison of PFS between the two groups
Kaplan–Meier curve was used to calculate the PFS of LM patients in the Tsuvmax/Lsuvmax ≤ 3.56 and Tsuvmax/Lsuvmax > 3.56 groups (Figure 3). After 1 year of follow-up, the PFS in the Tsuvmax/Lsuvmax ≤ 3.56 group (11.64 ± 0.18) was significantly higher than in the Tsuvmax/Lsuvmax > 3.56 group (8.58 ± 0.57) (p < 0.05).

Comparison of progression-free survival curves between the Tsuvmax/Lsuvmax ≤ 3.56 and Tsuvmax/Lsuvmax > 3.56 groups: “—” indicates the PFS of patients in the Tsuvmax/Lsuvmax ≤ 3.56 group, and “—” indicates the PFS of patients in the Tsuvmax/Lsuvmax > 3.56 group; the group having lower Tsuvmax/Lsuvmax value showed longer PFS.
Comparison of the postoperative complications between the two groups
There was a significant difference in postoperative complications between the Tsuvmax/Lsuvmax ≤ 3.56 group and the Tsuvmax/Lsuvmax > 3.56 group (p < 0.05; Table 2). The postoperative complications of the LM patients in the Tsuvmax/Lsuvmax ≤ 3.56 group included nausea and vomiting accounting for 5.08% (3/59), abdominal pain and distention for 6.78% (4/59), fever for 10.17% (6/59), and leucopenia for 1.69% (1/59). The postoperative complications of the LM patients in the Tsuvmax/Lsuvmax > 3.56 group included nausea and vomiting, abdominal pain and distention, fever, leucopenia, and liver and kidney dysfunction, accounting for 10.53% (4/38), 7.89% (3/38), 21.05% (8/38), 2.63% (1/38), and 2.63% (1/38), respectively.
Comparison of postoperative complications for patients between two groups.

Tsuvmax: maximum standard uptake value of liver tumor; Lsuvmax: maximum standard uptake value of normal liver tissue.
Comparison of the 18F-FDG PET parameters between the LM patients with abundant and lack of blood supply
Of these 97 patients, there were 29 LM patients with abundant blood supply, and 68 LM patients with lack of blood supply. The values of Tsuvmax, Tsuvmax/Lsuvmax, and Tsuvmax/Lsuvmean of LM patients with abundant blood supply were significantly lower than in peripheral liver parenchyma (all p < 0.05; Table 3). The values of Tsuvmax, Tsuvmax/Lsuvmax, and Tsuvmax/Lsuvmean of LM patients with poor blood supply were significantly higher than in peripheral liver parenchyma (all p < 0.05; Table 4).
18F-FDG PET parameters of patients with liver metastasis and abundant blood supply.

18F-FDG PET: 18F-fluorodeoxyglucose positron emission tomography; Tsuvmax: maximum standard uptake value of liver tumor; Lsuvmax: maximum standard uptake value of normal liver tissue.
18F-FDG PET parameters of patients with liver metastasis and lack of blood supply.

18F-FDG PET: 18F-fluorodeoxyglucose positron emission tomography; Tsuvmax: maximum standard uptake value of liver tumor; Lsuvmax: maximum standard uptake value of normal liver tissue.
Correlation between 18F-FDG PET parameters and LPD deposition
Of these 97 patients, there were 37 patients with LPD type I, 45 patients with type II, and 15 patients with type III. As shown in Table 5, there was no significant difference in Tsuvmax and Tsuvmax/Lsuvmean values between LPD types I and II (p > 0.05), while Tsuvmax/Lsuvmax value in type II was higher than in type I (p < 0.05). The values of Tsuvmax, Tsuvmax/Lsuvmax, and Tsuvmax/Lsuvmean in type III were all higher than those in types I and II (all p < 0.05). Spearman correlation analysis showed that the higher LPD type was accompanied by higher values of Tsuvmax, Tsuvmax/Lsuvmax, and Tsuvmax/Lsuvmean (all p < 0.05).
Correlation between 18F-FDG PET parameters and liquid-phase deposition.

18F-FDG PET: 18F-fluorodeoxyglucose positron emission tomography; Tsuvmax: maximum standard uptake value of liver tumor; Lsuvmax; maximum standard uptake value of normal liver tissue.
p < 0.05 compared with type I; #p < 0.05 compared with type II.
Discussion
The main results of our study showed that 18F-FDG PET/CT can be useful in evaluating the efficacy of TACE in the treatment of LM. 18F-FDG PET is a kind of imaging method that can be used to assess glucose metabolism, and 18F-FDG is regarded as a glucose metabolism tracer. Same with glucose, 18F-FDG could transfer into cells through the cell membrane of glucose transporter after injected into the body. 21 18 F-FDG enters into tumor cells through the cell membrane of glucose transporter and subsequently transforms into 18F-FDG-6-phosphate (P) being detained in the tumor cells under the effect of hexokinase, thus making it possible for tumor imaging. The uptake of 18F-FDG significantly increased when PET detects tumors with increased rate of glycolysis because of rapid proliferation. 22 This study showed that 18F-FDG PET was a feasible tool for evaluating the biological behavior of hepatocellular carcinoma, and the uptake of 18F-FDG in hepatic tumor can effectively evaluate the properties of tumor and the efficacy of the treatment. 23 At present, it is believed that LM after TACE treatment presented tumor necrosis or fibrosis, and it was difficult to diagnose with MRI, CT, or US, while 18F-FDG PET can specifically show hypermetabolism of recurrent foci and accordingly distinguish with the low metabolic characteristics of fibrosis or necrosis, thereby helping to judge the curative effect. 24
Except that, our study also indicated that Tsuvmax/Lsuvmax can reflect postoperative curative effect in 18F-FDG PET/CT parameter among Tsuvmax, Tsuvmax/Lsuvmax, and Tsuvmax/Lsuvmean; all patients were divided into two groups according to Tsuvmax/Lsuvmax ≤ 3.56 (cut-off value) and Tsuvmax/Lsuvmax > 3.56. The therapeutic effect of tumor in the Tsuvmax/Lsuvmax ≤ 3.56 group was significantly higher than in the Tsuvmax/Lsuvmax > 3.56 group. These results revealed that Tsuvmax/Lsuvmax value is an effective response index of tumor invasiveness, and also an important factor to predict the effect of TACE treatment. The increased uptake of 18F-FDG is closely related to the formation process and prognosis of tumor. 25 Additionally, the PFS of patients in the Tsuvmax/Lsuvmax ≤ 3.56 group was longer than those in the Tsuvmax/Lsuvmax > 3.56 group. In line with this result, there was a previous study also demonstrated that the SUV value of 18F-FDG PET/CT was inversely correlated with the disease-free survival rate and recurrence rate of patients. 26
The values of Tsuvmax, Tsuvmax/Lsuvmax, and Tsuvmax/Lsuvmean in patients with rich blood supply were significantly lower than in peripheral liver parenchyma, while the values of Tsuvmax, Tsuvmax/Lsuvmax, and Tsuvmax/Lsuvmean in patients with poor blood supply were significantly higher than those in peripheral liver parenchyma. A previous study found that the tumor cells of LM in early stage mainly diffuse around and need establish a new blood supply system with the increase of tumor volume, in which all these new blood vessels mainly from hepatic artery. 27 In addition, the blood supply to the liver might be approximated through the arterial input, and delay with a limited time for FDG extraction in portal circulation is small and a major component of FDG is delivered by the portal vein. 28 Spearman correlation analysis showed that the higher LPD type was accompanied by higher values of Tsuvmax, Tsuvmax/Lsuvmax, and Tsuvmax/Lsuvmean. LPD selectively deposited on the lesions of multiple blood supply, and tumor blood vessels were positively related to the accumulation of LPD. There were also several limitations in this study. First, the concentration and activity of glucose-6-phosphatase were higher in LM tumor cells, and 18F-FDG PET had lower sensitivity, especially to liver metastatic tumor cells with excellent differentiation. Second, only when the tumor size was large enough, or the high degree of malignancy and patients at high alpha-fetoprotein (AFP) levels, 18F-FDG uptake was shown to be increased. Third, for liver metastatic tumor cells with excellent differentiation, the sensitivity of 11C-acetate diagnosis reached 87.30% in a foreign study. 29 Restricted by the conditions, we cannot get a large number of patients with 11C-acetate as a tracer in the short term, so patients selected for this study were of higher 18F-FDG uptake in 18F-FDG PET/CT scan, and the evaluation of the efficacy of 11C-acetate for liver metastases will be the next research direction. Finally, due to time constraints, small sample size, primary lesions of different types, and different LM tumor hemodynamic performance, this study could be further classified in accordance with primary lesions and give a detailed analysis of the characteristics.
In conclusion, this study provides strong evidence that the Tsuvmax/Lsuvmax of 18F-FDG PET/CT may be a good tool for predicting the efficacy of TACE in the treatment of LM, and it also provides a good evaluation for blood supply of LM lesions after TACE, which could guide the clinical treatment of LM.
Footnotes
Acknowledgements
The authors acknowledge all the reviewers who had given supports for our article. Z.-F.W., X.-X.F., M.X., M.-J.C., Z.-W.Z., J.-D.Z., J.-F.T., and J.-J.S. are regarded as co-first authors.
Declaration of conflicting interests
The author(s) declared no potential conflicts of interest with respect to the research, authorship, and/or publication of this article.
Funding
The author(s) received no financial support for the research, authorship, and/or publication of this article.