
Abstract
Osteopontin-c splicing isoform activates ovarian cancer progression features. Imbalanced expression of splicing factors from serine/arginine -rich and heterogeneous ribonucleoproteins families has been correlated with the generation of oncogenic splicing isoforms. Our goal was to investigate whether there is any association between the transcriptional patterns of these splicing factors in ovarian cells and osteopontin-c expression levels. We also aimed to investigate the occurrence of these splicing factors binding sites inside osteopontin exon 4 and adjacent introns. To test associations between osteopontin-c and splicing factors expression patterns, we used an in vitro model in which OVCAR-3 cells overexpressing osteopontin-c (OVCAR-3/OPNc++) presented higher transcriptional levels of osteopontin-c than two other ovarian carcinoma cells (TOV-112D, SKOV-3) and ovarian non-tumoral cell lines (IOSE 364 and IOSE 385). The transcriptional levels of osteopontin-c, serine/arginine-rich, and hnRNP factors were evaluated using real-time polymerase chain reaction. Human Splice Finder software was used to search for putative splicing factor binding sites in osteopontin genomic regions. OVCAR-3/OPNc++ cells presented higher transcriptional levels of hnRNP than serine/arginine-rich when compared to TOV-112D, SKOV-3, and IOSE cells. TOV-112D and SKOV-3 cells also overexpressed hnRNP in relation to serine/arginine-rich transcripts. Putative binding sites for these splicing factors have been predicted on osteopontin exon 4 and their upstream and downstream intronic regions. Our data showed that higher osteopontin-c expression levels are associated with a predominance of hnRNP in relation to serine/arginine-rich transcripts and that osteopontin exon 4 and adjacent intronic sequences contain predicted binding sites for some of these tested splicing factors. In conclusion, differential expression of these splicing factors in ovarian cancer cells could be one of the putative mechanisms leading to aberrant splicing of the osteopontin primary transcript. Future work, aiming to control ovarian cancer progression by downregulating osteopontin-c levels, could include strategies that also regulate heterogeneous ribonucleoproteins and serine/arginine-rich expression levels in order to modulate osteopontin splicing.
Keywords
Introduction
Recent evidence connects aberrant alternative splicing (AS) with cancer. Many genes implicated in the development and progression of cancer undergo aberrant AS events to generate oncogenic or tumor suppressor proteins.1,2 In ovarian carcinoma (OC), many genes, such as CD44 3 and multidrug resistance protein 1/ATP (MRP1) binding cassette transporter subfamily gene, 4 undergo AS and their resulting splice variants perform distinct roles in tumor progression. Regulation and efficiency of AS is an outstanding process, in which several signal molecules participate. AS can arise by modifications at the DNA sequences that control splicing, affecting both the activity and expression of splicing factors (SFs). SFs can either activate or repress the selection of particular splice sites. In addition to these cis-acting DNA sequences and their corresponding trans-acting factors, other molecules, structures, or processes are probably intimately involved.5,6 Among several RNA-binding proteins implicated in splicing regulation are the serine/arginine-rich (SR) and the heterogeneous ribonucleoprotein (hnRNPs) protein family of SFs, which are key AS regulators.7,8
The SR and hnRNPs proteins generally activate or repress splicing, respectively, by modulating spliceosome assembly and regulating AS site selection. However, the final result of AS is effected by the concerted action of antagonistically acting SFs. Specific members of the SR family may also act antagonistically. 8
The SR protein family comprises several structurally related proteins, playing key roles in constitutive and alternative pre–messenger RNA (mRNA) splicing. The SR proteins coded by the SRSF1-7 genes are typically exon inclusion activators, by binding to exonic or intronic enhancer elements. Conversely, although presenting structural similarity with the rest of the SR family, those coded by SRSF9-11, in general, act as exon inclusion repressors. Functional diversity among the hnRNPs has also been observed. This family includes about 20 major polypeptides, hnRNPs A1–U, ranging in size from 34 to 120 kDa. 9 Of these, the hnRNP F, H1, M, and U are primarily exon inclusion activators, whereas hnRNP A1, A2/B1, and hnRNP I (also known as polypyrimidine tract–binding protein (PTB)) are primarily repressors. 10
There are several gene products in which AS variants modulate tumor progression. Our group has previously characterized osteopontin (OPN) splice isoforms in distinct tumor models, such as ovarian, prostate, and thyroid carcinomas.11–15 OPN is a glycophosphoprotein, highly expressed in several tumor models. 11 The OPN primary transcript undergoes AS producing three splicing isoforms (OPN-SI), namely, OPNa, OPNb, and OPNc, which exhibit tissue- and tumor-specific expression. 12 We have previously shown that OPNc is specifically expressed in OC samples and activates several aspects of tumor progression. 13 However, there is no previous description of the putative mechanisms that control OPN aberrant splicing in tumors or how OPNc is aberrantly expressed in OC tumor samples. Moreover, whether changes in the relative amounts of SR and hnRNP can affect OPNc and other splicing variants are not known. As a first step to delineate the basis for increased OPNc expression and its aberrant AS in OC tumors, in this report, we evaluated the transcriptional expression of a set of SFs belonging to SR (SRSF1, SRSF3, SRSF4, SRSF5, and SRSF6) and hnRNPs families (hnRNP C2, hnRNP A1, hnRNP B1, hnRNP A2/B1, hnRNP K, and PTB) in OC cell lines that express distinct levels of OPNc. To further validate the involvement and putative binding of at least some of these SFs on exon 4 coding sequence and adjacent intronic regions, analyses have been done at these sequences for the occurrence of the SF binding sites.
Materials and methods
Cell lines and culture
The OC cell line OVCAR-3 (derived from malignant ascites of a patient with a progressive epithelial adenocarcinoma of the ovary), SKOV-3 (epithelial adenocarcinoma), and TOV-112D (derived from a grade 3, stage IIIC, primary malignant endometrioid adenocarcinoma) were obtained from the American Type Culture Collection (ATCC, Manassas, VA, USA). IOSE 364 and IOSE 385 are immortalized normal ovarian surface epithelial cell lines, which were kindly provided by Dr Nelly Auersperg, University of British Columbia, Canada. OVCAR-3 and SKOV-3 cells were cultured in RPMI-1640 medium supplemented with either 20% (OVCAR-3) or 10% fetal bovine serum (FBS; SKOV-3), 100 IU/mL penicillin, and 100 mg/mL streptomycin. The TOV-112D cell line was cultured in 199 medium containing MCDB105 (1:1). Cell lines were cultured in a humidified environment containing 5% CO2 at 37°C.
RNA extraction and complementary DNA synthesis
RNA was extracted from the cell lines using the RNeasy kit (Qiagen) according to manufacturer’s instructions. Complementary DNA (cDNA) synthesis was performed with the SuperScript II First-Strand Synthesis System for real-time polymerase chain reaction (RT-PCR), using oligo(dT) primers (Invitrogen) and 1 μg of total RNA. Conditions for amplification of transcripts coding for SR and hnRNPs SFs by quantitative RT-PCR (qRT-PCR) were as follows: 50°C for 2 min, 94°C for 5 min, followed by 40 cycles at 94°C for 30 s, 60°C for 30 s, and 72°C for 30 s and final melting curve analysis, in order to check amplicon-specific amplification. All qRT-PCR reactions were conducted using the SYBR Green detection reagent (Applied Biosystems). Oligonucleotide primer pairs used for qRT-PCR assays are shown in Table 1, including primer sequences for 18S and β-actin, which were used as constitutive genes when testing SFs and OPNc expression levels, respectively. Relative gene expression of the target genes was calculated with the delta-delta CT method.
Oligonucleotide sequences used of real-time PCR.

OPNc overexpression
The open reading frame of the OPNc splice variant was cloned into the pCR3.1 mammalian expression vector, as previously described (He et al., 2006), and OVCAR-3 cells were transfected with this plasmid construct. OVCAR-3 cell clones stably overexpressing OPNc (named OVCAR-3/OPNc++) had been previously isolated. 13 One stable OVCAR-3/OPNc++ cell clone was selected and 600 µg/mL of G418 disulfate (Geneticin) was added in the culture medium.
SF putative binding sites
Putative binding sites for SR and hnRNPs SFs, whose expression patterns are investigated here, have been searched for using the freely available, Human Splicing Finder software (http://www.umd.be/HSF3/). The OPN 2196 bp intronic sequence upstream exon 4 (intron 3), 81 bp exon 4, and the 266 bp intronic sequence downstream exon 4 (intron 4) have been analyzed using this software (NCBI Reference Sequence: NG_030362.1). Scores higher than 80% have been selected as threshold values to consider a putative binding site in this analysis. In this software, algorithms have been integrated in order to identify exonic and intronic motifs.
Statistical analysis
Each experiment was performed in duplicate. All experiments were repeated at least twice. The results are presented as mean ± 95% confidence intervals of all the values. GraphPad Prism® 5.0 was used in all statistical analyses and samples were evaluated for normal distribution by the Kolmogorov–Smirnov test. A Student’s t test was used to evaluate statistically significant differences in expression transcript levels; p < 0.05 was selected as the statistically significant value. All statistical tests and corresponding p values were two-sided.
Results
OPNc expression levels are associated with SF expression patterns
Previously, OPNc was shown to be specifically expressed in OC cell lines and tissue samples, but no expression or at very low OPNc levels have been detected in ovarian non-tumoral samples. 13 Based on these data, and to better understand OPNc aberrant splicing in OC cells, we used an in vitro model in which cell lines presented distinct OPNc levels. The transcriptional expression levels of OPNc in OVCAR-3/OPNc++ cells were compared to those observed in two additional OC cell lines (SKOV-3 and TOV-112D) and to IOSE 385 and 364 non-tumoral cells. The OVCAR-3/OPNc++ clone exhibited higher expression levels of OPNc (mean LOG10 relative expression levels (LEL) = 3.89) in relation to SKOV-3 (LEL = 3.022) and TOV-112D (LEL = 0.77; p ≤ 0.05). Of note, these three cell lines also presented higher endogenous OPNc levels than IOSE 385 (LEL = 0.50; p≤0,001) and IOSE 364 (LEL = 0; p≤0.001) non-tumoral cells (Figure 1(a)).
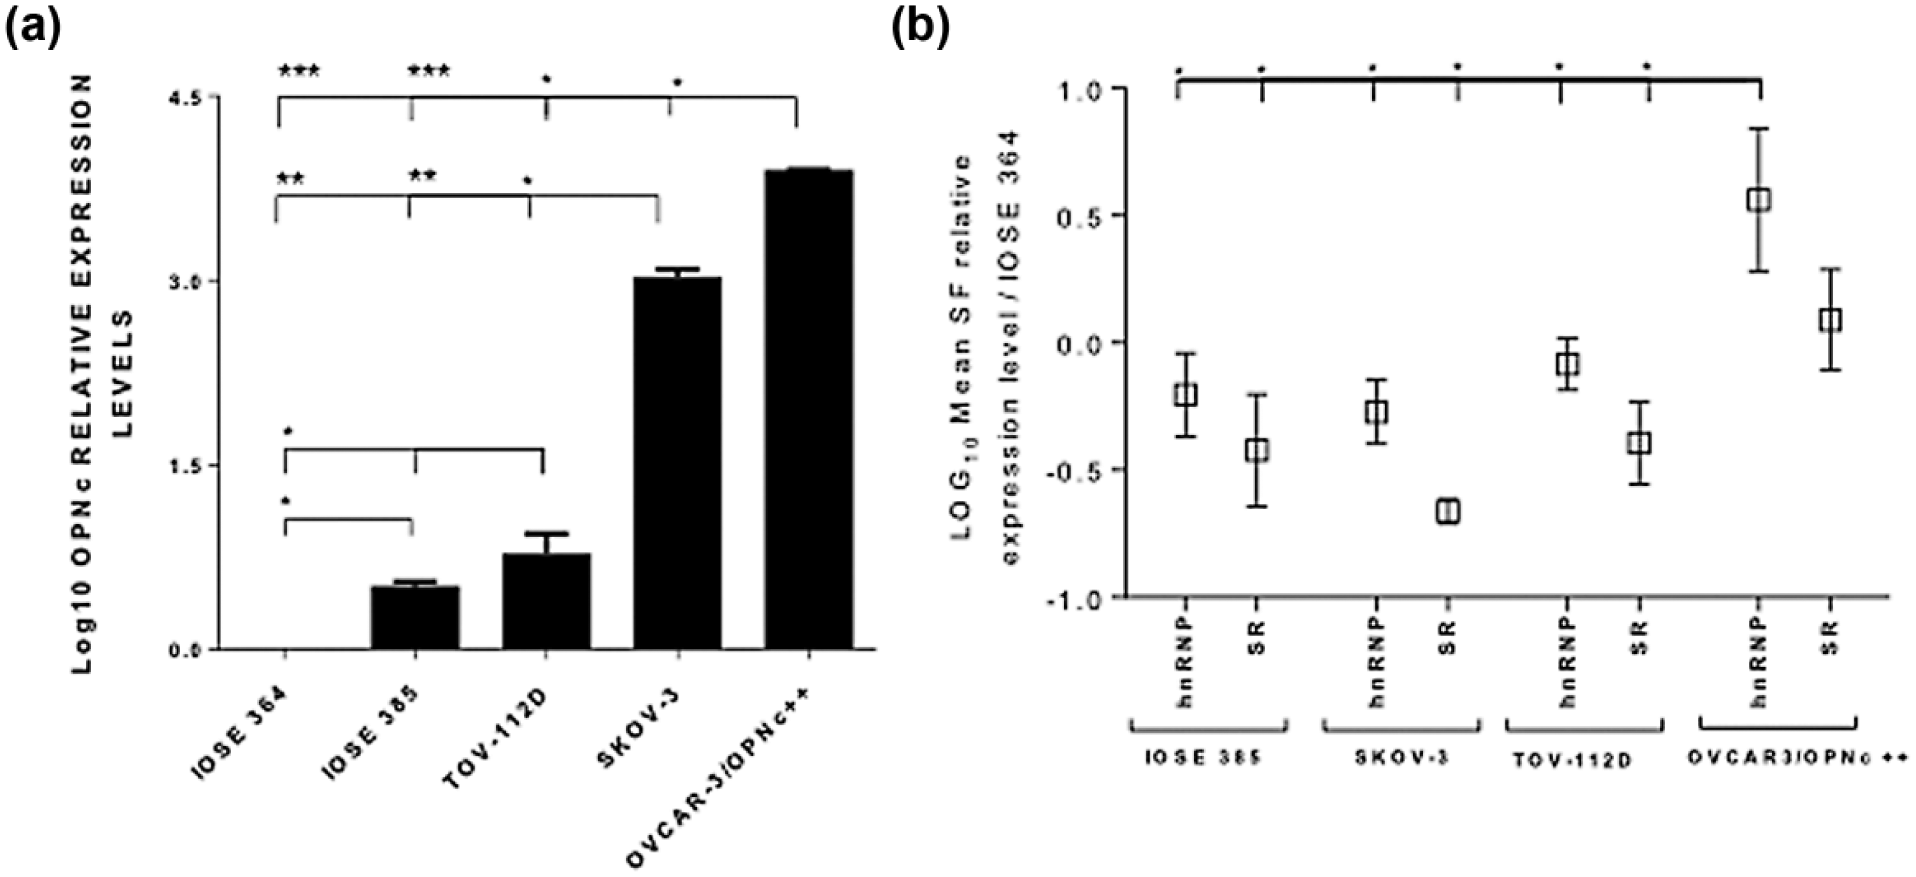
OPNc overexpression is associated to hnRNP and SR differential expression in ovarian carcinoma cells. Quantitative real-time PCR (qRT-PCR) assays have been performed in order to evaluate (a) LOG10 OPNc relative expression levels (LEL) in OVCAR-3/OPNc++, SKOV-3, TOV-112D, and IOSE 385 in relation to IOSE 364 ovarian non-tumoral cells, which has been used as the reference sample. (b) Data represent the mean LEL among SR (SRSF1, SRSF3, SRSF4, SRSF5, and SRSF6) and hnRNP (hnRNP C2, hnRNP A1, hnRNP B1, hnRNP A2/B1, hnRNP K, and PTB) family members in OVCAR-3/OPNc++, TOV-112D, SKOV-3, and IOSE 385 in relation to IOSE 364 cells (which was used as the reference sample for relative expression analysis using the delta-delta CT method and is not shown at this graph. Beta actin and 18S genes have been used as the constitutive controls for OPNc and SFs expression level evaluation, respectively (*p < 0.05; **p < 0.001; ***p < 0.0001).
Subsequently, any association between OPNc expression levels and an imbalanced expression of SFs in OC cells was investigated. The group of 5 “classical” SR factors, that is, SRSF1, SRSF3, SRSF4, SRSF5, and SRSF6, was focused on. In addition, the expression of some hnRNP family members, such as hnRNP C2, hnRNP A1, hnRNP B1, hnRNP A2/B1, hnRNP K, and PTB, which are generally believed to act as antagonist of SR proteins, was also analyzed. To accomplish this goal, we tested the transcriptional levels of these SRs and hnRNPs factors in OVCAR-3/OPNc++, SKOV-3, TOV-112D, and the IOSE 385 and 364 non-tumoral cells (Figure 1(b)). In all tested cell lines, most hnRNP family members are upregulated in relation to SR factors (Figure 1(b)). Moreover, mean transcriptional levels of hnRNP factors are significantly higher in OVCAR-3/OPNc++ (LEL = 0.56) than in TOV-112D (LEL = −0.08), SKOV-3 (LEL = −0.27), IOSE 385 (LEL = −0.20), and IOSE cells (LEL = 0; p ≤ 0.05). We also found that OVCAR-3/OPNc++ cells overexpress 9 out of 11 tested SFs (including both hnRNP and SR members) in relation to other tested cell lines (Figure 1(b) and Supplementary Figure 1). Supplementary Figure 1 shows the relative expression level of each individual SF in these distinct cell lines. In summary, our data show that hnRNP transcripts are overexpressed in relation to SR factors and that this differential expression is associated to OPNc expression levels. In addition, we showed that each SF has a specific expression pattern when comparing among these cell lines presenting distinct OPNc transcript levels.
OC cell lines display differential expression of SR and hnRNP transcripts in relation to IOSE ovarian non-tumoral cell lines
We then analyzed the expression levels of both groups of tested SR and hnRNP factors in TOV-112D and SKOV-3 cells in relation to IOSE 364 and 385 cells non-tumoral cells. Mean transcriptional levels of hnRNP factors (LEL = −0.09 in TOV-122D cells; LEL = 0.09 in SKOV-3 cells) are higher than those observed for SR factors (LEL = −0.30 in TOV-122D cells; LEL = −0.39 in SKOV-3 cells), although the transcriptional levels for each distinct SFs varied in relation to each tested IOSE cells (Figure 2(a) and (b)). Statistically significant differences between mean SR and hnRNP expression levels are shown (*p ≤ 0.05; **p ≤ 0.001). Altogether, these data provide further evidence that cells expressing higher OPNc levels display lower transcriptional levels of SR than hnRNP transcripts.

Ovarian carcinoma cells overexpress hnRNP in relation to SR factors. The mean LOG10 relative transcriptional levels (LEL) of each hnRNP and SR family members were analyzed by qRT-PCR in relation to (a) IOSE 364 and (b) IOSE 385 non-tumoral cell lines, which were both used as reference samples for these analysis using the delta-delta CT method. The mean LEL transcriptional levels among hnRNP and SR factors have been compared. Significant differences between these mean expression values are shown (*p < 0.05; **p < 0.001). At the top panel, the transcriptional patterns of SFs are shown for TOV-112D cells, while the bottom panel corresponds to data for SKOV-3 cells. 18S gene has been used as the constitutive control gene. Data are representative of three independent experiments performed in duplicates.
Expression levels of antagonistic SFs are disturbed in OC cell lines
In TOV-122D or SKOV-3 cells, most hnRNP transcripts were expressed in higher levels in relation to SR transcripts. The final result of AS, in which predominates exon inclusion or exclusion, is an effect of the concerted action of antagonistically acting SF pairs and also as a consequence of modifications on the expression levels of these proteins. 12 We then investigated which member in three previously described antagonistic SF pairs 12 was predominated in OC tumoral cells versus IOSE non-tumoral cells (Figure 3). The transcript level ratios were analyzed between the following antagonistic SF pairs in the TOV-122D and SKOV-3 cells in relation to the IOSE 364 cell line: (1) SF2/ASF: hnRNP A1, (2) SRSF1: SRSF3, and (3) SRSF5: SRSF6 (Figure 3). In comparison to IOSE 364 cells, in both TOV-122D and SKOV-3 cells, the ratio values for 2 out 3 of the tested antagonistic SF pairs indicated higher transcript levels of hnRNP A1 and SRSF3 at their corresponding SF pairs. Also, the calculated ratio for TOV-122D was higher for the SRSF5 transcript levels than SRSF6. Otherwise, SKOV-3 cells had ratios that are indicative of similar expression levels to these SF transcripts. These data indicate that TOV-112D and SKOV-3 OC cells exhibited higher hnRNP A1 and SRSF3 expression levels at their antagonistic SF pairs in relation to IOSE 364 cells, which is a SF expression pattern typically related to exon exclusion at splicing events.

Antagonistic splicing factors’ (SFs) pairs exhibit differential expression in OC cell in relation to IOSE 364 cells. Graph bars represent the relative expression ratio between the transcriptional level of three distinct SF antagonistic pairs, namely, SRSF1: hnRNP A1, SRSF1, SRSF3, and SRSF5: SRSF6 in TOV112-D and SKOV-3 cells in relation to IOSE 364 cells. We calculated the ratio between the relative expression level of the first member of each pair by the relative expression of the second member in each OC cell (TOV112-D or SKOV-3) in relation to IOSE 364 cells, which has been used as the reference sample.
OPN exon 4 and their adjacent intronic genomic sequences contain putative SF binding sites
While it is known that several of these SFs regulate AS, 14 to the best of our knowledge, there is only a single recent description regarding OPN splice variants as a target of a SF. 15 Accordingly, the genomic sequence of the OPN exon 4 and adjacent introns were analyzed using matrices to predict sequences required for binding of SFs belonging to the SR and hnRNP families.
Supplementary Figure 2 shows the exact position of each high-score SF-predicted binding sites on the OPN exon 4 and adjacent upstream and downstream introns. This analysis showed that exon 4 coding sequence contains three high-score binding sites for SRSF5 and one for SRSF6, SRSF1, and hnRNP A1 SFs (Supplementary Figure 2A). Similarly, exon 4 upstream and downstream introns (intron 3 and 4, respectively) contain several putative binding sites for these same SF factors (Supplementary Figure 2B and 2C). Most predicted binding sites at the exon 4 coding sequence and intronic regions are putative binding sites for classical exon inclusion activators, such as SRSF1, SRSF5, and SRSF6. Remarkably, several of these high-score putative binding sites are superimposed or positioned very closely at their corresponding intronic or exonic regions, specifically at the intronic sequences. Several additional putative binding sites for these SFs have also been found in these OPN genomic regions, but presented low threshold score values (data not shown).
Discussion
Currently, data are lacking regarding the molecular mechanisms that control aberrant OPN splicing in tumor cells. In this context, how OPNc is overexpressed in OC samples in relation to non-tumoral specimens is unknown. As a first step to investigate this issue, we hypothesized that differential expression of SR and hnRNP splicing factors could be one of the molecular mechanisms associated with OPNc upregulation in OC cancer cells. The expression of 11 classical SFs was analyzed in ovarian cell lines exhibiting distinct OPNc transcript levels. We showed that in OC cells that ectopically overexpress OPNc (OVCAR-3/OPNc++), most tested SFs were upregulated in relation to other OC and ovarian non-tumoral cells. Strikingly, among those upregulated SFs, OVCAR-3/OPNc++ cells displayed higher hnRNP transcript levels than most tested SR family members. A similar hnRNP and SR differential expression pattern was observed when comparing TOV-122D and SKOV-3 OC cells and IOSE non-tumoral cells. Furthermore, we analyzed the OPN exon 4 and the intronic adjacent sequences for the occurrence of some of these tested SF binding sites. Several putative binding sites for SRSF1, SRSF5, SRSF6, and hnRNP A1 were found on these target genomic regions.
We showed that the OVCAR-3/OPNc++ cells overexpress OPNc in relation to the other two OC cell lines and to the non-tumoral ovarian cells. TOV-112D, and SKOV-3 OC cells, in turn, also overexpress OPNc compared to the IOSE cells. We found that most SFs tested are upregulated in OVCAR-3/OPNc++ cells in comparison OC and to IOSE non-tumoral cells. Among these upregulated SFs, the hnRNP family member transcripts were expressed at higher levels than the SR transcripts. Higher hnRNP than SR expression levels were also found when comparing their transcriptional levels in TOV-112D and SKOV-3 OC in relation to IOSE cells. Previously observed hnRNP and SR transcripts with differential expression and their association with tumor progression have also been reported in cancer cells.16–18 For instance, in metastatic melanoma, differential expression of some SFs has prognostic implications and is correlated to specific splicing profiles. 16 Furthermore, it has also been reported in gastrointestinal tract tumors that several SFs, including SRSF1 and SRSF2 expression levels, differed compared to healthy tissues. 17 These data have established SFs as tumor biomarkers.19,20 The expression level of hnRNPs has also been altered in many types of cancer, suggesting their role in tumorigenesis, as well as presenting functional versatility within the hnRNP family members. 21 Proteins from the hnRNP family can repress splicing by directly antagonizing the recognition of splice sites, interfering with the binding of proteins associated with enhancers or hindering communication between factors attached to different splice sites. 7 Similar to the present data, imbalanced expression of SFs in tumors has been correlated to a shift in the splicing program during cancer progression, especially in the epithelial–mesenchymal transition (EMT) program. 14 Previously, OPN has been pointed as a key regulator of EMT in tumors22–24 and we also showed in this study that OPNc transcript levels are associated with SR and hnRNP differential expression. We therefore propose that the observed SF splicing patterns may also be associated with OPNc aberrant levels in the OC cells. Although there are a few cases where specific mutations at splicing regulatory sequences are the primary cause for aberrant splicing of cancer-specific genes, global alterations in AS in cancer cells may be primarily derived from changes in the expression of RNA-binding proteins that control splice site selection.25,26
Further validation of our proposal regarding aberrant SF expression as one of the mechanisms possibly associated to OPNc expression would require functional assays in which altered expression of SFs and subsequent impacts on OPNc levels and tumor progression features could be evaluated. However, post-translational modifications (PTMS), not investigated here, could also modulate the activity of the tested SF. Hence, protein expression and PTMs of these SFs should also be further evaluated to better understand the mechanism that could be involved in OPNc expression and exon 4 splicing control.
We also found that known antagonistic SFs pairs are differentially expressed in OC cells overexpressing OPNc in comparison to IOSE non-tumoral cells. These results also indicate that factors generally promoting exon exclusion properties in the SF antagonistic pairs tested, such as hnRNP A1 and SRSF3, are expressed in higher levels in OC cells in relation to ovarian non-tumoral cells. It has been reported that the SRSF1 and hnRNP A1 pair behaves as SFs that exhibit opposite activities. Excess of SRSF1 promotes proximal splice site selection, while excess of hnRNP A1 favors a distal splice site. Specific members of the SR family may also act antagonistically, such as SRSF1 and SRSF3 27 and SRSF1 and SRSF2. 12 Equally, other authors have also proposed the evaluation of SF expression ratios as an index of EMT and tumor aggressiveness in breast cancer, which are correlated to the differential expression of ESRP1, ESRP2, and RBFOX2 SFs. 20 Although differential expression of these SFs has been suggested as a hallmark in AS control in cancer cells, it is well known that the functions of these activating and repressor factors must work coordinately with the core spliceosome machinery. 10 Thus, based on the observed expression pattern regarding the SF antagonistic pairs, we argue that upregulated hnRNP A1 and SRSF3 SFs at their corresponding antagonistic pairs may be an additional feature that possibly stimulates exon 4 exclusion in OC cells, thus contributing to OPNc overexpression.
In this report, several putative binding sites for SRSF1, SRSF5, SRSF6, and hnRNP A1 on exon 4 and adjacent introns were also found. Although a score above threshold does not necessarily mean that the identified binding sites perform roles as exonic or intronic regulatory elements, these results together with an association between high OPNc levels and hnRNP and SR differential expression, suggest that these factors may play a regulatory role in OPN splicing. This issue needs further validation by experimental data, displaying direct binding between these SFs and OPN splicing regulatory regions. In addition, several of the tested putative binding sites, for both known splicing activators and repressors, were superimposed according to the matrix-predicted analysis. Considering that the hnRNP factor transcripts are overexpressed above most tested SR members, it is possible that, as has been previously described, that the hnRNP members can promote displacement of SR activators or otherwise interfere with their binding activities,21,28,29 favoring splicing inhibition and OPN exon 4 exclusion.
We conclude that OPNc overexpression is associated with SR and hnRNP differential transcriptional levels in OC cells. Based on these data, we hypothesized that higher exon 4 exclusion events, generating high OPNc levels in OC cells, may be favored by the preferential binding of upregulated hnRNP exon inclusion repressors to their abundant binding sites located at OPN exon 4 and at adjacent introns. A better understanding of how these SFs control OPN splicing should contribute to innovative strategies to modulate OC progression by regulating OPNc levels by targeting these SFs in therapeutic approaches.
Footnotes
Declaration of conflicting interests
The author(s) declared no potential conflicts of interest with respect to the research, authorship, and/or publication of this article.
Funding
The author(s) disclosed receipt of the following financial support for the research, authorship, and/or publication of this article: This work was jointly supported by grants from Conselho Nacional de Pesquisa (CNPq), Fundação de Amparo à Pesquisa do Estado do Rio de Janeiro (FAPERJ), Universidade Federal Fluminense (UFF)/ Pró-reitoria de Pesquisa (Proppi); Fundação para a Ciência e a Tecnologia (FCT) e a Fundação Coordenação de Aperfeiçoamento de Pessoal de Nível Superior (CAPES), and Ministério da Sáude (MS)-Fundação do Câncer.
References
Supplementary Material
Please find the following supplemental material available below.
For Open Access articles published under a Creative Commons License, all supplemental material carries the same license as the article it is associated with.
For non-Open Access articles published, all supplemental material carries a non-exclusive license, and permission requests for re-use of supplemental material or any part of supplemental material shall be sent directly to the copyright owner as specified in the copyright notice associated with the article.