
Abstract
The BRAFV600E-specific inhibitor vemurafenib blocks mitogen-activated protein kinase pathway and induces cell cycle arrest at G0/G1 phase leading to apoptosis of melanomas. To gain an understanding of the dynamics of cell cycle regulation during vemurafenib therapy, we analyzed several vemurafenib-resistant human melanoma sublines derived from BRAFV600E harboring vemurafenib-sensitive parental lines. Vemurafenib provoked G0/G1 phase arrest in parental but not in vemurafenib-resistant sublines. We hypothesized that refractoriness of vemurafenib-resistant sublines to vemurafenib-mediated cell cycle inhibition can be partially rescued by the chromatin modifier suberoylanilide hydroxamic acid. Suberoylanilide hydroxamic acid promoted G2/M arrest at expense of S phase irrespective of vemurafenib sensitivity. In parental lines, combination of suberoylanilide hydroxamic acid and vemurafenib induced both G0/G1 arrest and apoptosis, whereas in vemurafenib-resistant sublines combination induced G0/G1 as well as G2/M arrest resulting in dramatic cytostasis. Vemurafenib-resistant sublines exhibited extracellular signal–regulated protein kinases 1 and 2 but not AKT and hyperphosphorylation. Gene expression profiling revealed mitogen-activated protein kinase hyperactivation and deregulations of cyclins and cyclin-dependent kinases in vemurafenib-resistant sublines, all of which were reversed by suberoylanilide hydroxamic acid; changes that may explain the cytostatic effects of suberoylanilide hydroxamic acid. These results suggest that unresponsiveness of vemurafenib-resistant sublines to the biological effects of vemurafenib may be amenable by suberoylanilide hydroxamic acid. These in vitro results, while require further investigation, may provide rational biological basis for combination therapy in the management of vemurafenib-resistant melanoma.
Keywords
Introduction
Treatment of metastatic melanoma in Western countries has remarkably advanced in recent years owing to the development of modern immunotherapeutic approaches (PD-1/PD-L1 and CTLA-4 checkpoint blockades and adoptive cell transfer (ACT)) as well as BRAFV600E targeted therapy. 1 BRAFV600E is found in approximately 50% of cutaneous melanomas2–4 and promotes constitutive activation of the mitogen-activated protein kinase pathway (MAPK), particularly extracellular signal–regulated protein kinases 1 and 2 (ERK1/2). 5 The small molecule inhibitor of this driver oncogene, vemurafenib (PLX4032), binds specifically to the adenosine triphosphate (ATP) pocket of activated BRAFV600E, blocks ERK1/2 activation, and induces cell cycle arrest and apoptosis.6,7 Vemurafenib blocks MAPK activation, which in turn controls cell cycle progression through G1, a mitogen-dependent step controlled by the restriction point R, 8 thus halting cell cycle progression at the G0/G1 phase. 4
Although initial response rates to vemurafenib treatment are generally high, 9 the majority of patients present disease progression after 6-8 months due to the development of drug resistance. 10 Melanomas survive BRAFV600E inhibition through a multitude of mechanisms involving dysregulation of several key mediators (gene products) controlling the activation of survival pathways (e.g. NRAS secondary mutations leading to constitutive MAPK pathway activation), overexpression of various receptor tyrosine kinases (RTKs; IGF1R, Met, cKIT, platelet-derived growth factor receptor beta (PDGFR-β)), 11 COT kinase activation, 12 phosphatase and tensin homolog (PTEN) loss and phosphoinositide 3-kinase (PI3K)/AKT activation, 13 genomic BRAF amplification, 14 and CRAF dimerization. 15 Thus, overcoming vemurafenib resistance is an active area of basic and clinical research.
Cancer is considered a disease of the cell cycle: While normal cells have constraints in cell cycle progression allowing them to discontinue cellular division under certain conditions (DNA damage, metabolic and energy imbalances, etc), cancer cells have unhindered cell cycle progression. 16 Regulation of cell cycle progression is a complex process and requires the coordinated action of cyclins, cyclin-dependent kinases (CDKs), and CDK inhibitors (CDKIs). Progression through each phase is controlled by sensor mechanisms called checkpoints. 17 Most tumors including melanoma have abnormal G1 to S phase transition, mainly due to deregulated activity of CDK2, 4 and 6.18–20
Inhibition of cell cycle progression is a promising target for cancer treatment. 21 Regulation of G1 phase is frequently interrupted in cancer cells, thus, offering G1-related regulatory proteins as suitable targets for therapy. Restoring R point control in tumor cells is another potential strategy to force cancer cells to enter quiescence. In fact, several compounds targeting cell cycle–related molecules are being tested in various phases of clinical trials, some have even received the Food and Drug Administration (FDA) approval. 22
Histone deacetylase inhibitors (HDACis) are a new class of anti-cancer agents. 23 In addition to their well-established effects on histone tail modifications and chromatin configuration, HDACis also regulate acetylation of non-histone proteins, 24 thus exerting broad gene regulatory effects. 25 HDACis have been shown to regulate various phases of cell cycle including G1, G2, and M phases. 26 For example, HDACis regulate the expression levels of CDKN1A locus that expresses p21WAF1 and other proteins associated with G1 transition, 27 and upregulate CDKIs such as p15INK4B and p19INK4D.28–30 HDACis also play a complex role in G2 phase by increasing acetylation of cyclin A, therefore promoting its degradation. 31 These events culminate in cell cycle arrest at G1 and G2 phases.
To gain a better understanding of the molecular mechanisms of resistance to vemurafenib, we have recently reported the establishment of several vemurafenib-resistant (VemR) melanoma sublines from BRAFV600E harboring vemurafenib-sensitive parental line, and have shown that drug-resistant melanomas develop cross-resistance to immune effector cells due to deregulated expression of apoptotic gene programs. These effects were reversed by the HDACi suberoylanilide hydroxamic acid (SAHA). 32 Consistent with previous reports, 33 we have observed that unlike parental cells, VemR sublines progress through G1 in response to vemurafenib treatment. In this study, we tested the hypothesis that the refractoriness of VemR sublines to vemurafenib-mediated cytostasis can partially be rescued by SAHA.
We observed different responses of various parental and VemR sublines to vemurafenib and SAHA (used as single agents and/or in combination). These differences can be explained by differences in the activation/mutational status of the cells, modes of acquisition of vemurafenib resistance, as well as their different original anatomical isolation site and their grade. However, our results indicate that during acquisition of resistance to vemurafenib, VemR sublines do not undergo cell cycle arrest upon vemurafenib treatment, acquire ERK1/2 hyperphosphorylation, and have deregulated expression of MAPK-dependent cell cycle regulatory genes. The chromatin modifier SAHA restored gene expression profile and induced cell cycle arrest, an effect that was more pronounced in conjunction with vemurafenib.
Materials and methods
Cell lines
Human melanoma cell lines were established from surgical specimens as described. 34 The VemR sublines were established by growing BRAFV600E harboring vemurafenib-sensitive parental lines in the presence of stepwise increasing concentrations of vemurafenib (0.1–10 μM for 3 months). Cells were grown in vemurafenib-free medium for at least 1 week prior to each analysis. Cultures (0.3–0.5 × 10⁶ cells/mL) were incubated at 37°C in an incubator with controlled atmosphere with saturated humidity and were used at 50% to 70% confluency for each experiment. 32 Cultures were routinely (once/month) checked for mycoplasma contamination (Lonza Group Ltd, Basel, Switzerland).
Reagents
Rabbit anti-human polyclonal antibodies specific to AKT, phosphorylated (phospho)-AKT (Ser473 and Thr308), ERK1/2, and phospho-ERK1/2 (Thr202/Tyr204) were purchased from Cell Signaling Technology (Beverly Hills, MA). Mouse anti-tubulin monoclonal antibody (mAb) was obtained from Millipore (Temecula, CA). The BRAF inhibitor (BRAFi) vemurafenib (PLX4032) was purchased from Selleck Chemicals (Houston, TX). Stock vemurafenib was stored at −80°C at 10 mM in dimethyl sulfoxide (DMSO) prior to use in assays. The HDACi SAHA (vorinostat) procured commercially was diluted in DMSO. DMSO concentration did not exceed 0.1% in any of the assays.
Cell proliferation assays
Cells were plated onto a 96-well plate at a density of between 5 × 10⁴ and 1 × 10⁵ cells/mL and allowed to adhere overnight. The following day, cells were treated with increasing concentrations of vemurafenib ± SAHA as indicated and were grown for additional 24–72 h before being treated with sodium 3′-[1-(phenylamino-carbonil)-3,4-tetrazolium]-bis(4-methoxy-6-nitro)benzene (XTT) assay reagent for 5 h. Background corrected absorbance was measured at 450 nm subtracting the reference at 700 nm. Relative growth was calculated as the absorbance of untreated cells (UAF) divided by the absorbance of treated cells (TAF; under various conditions) after subtracting the initial absorbance (IA).
Analysis of cell cycle distribution
Melanomas, seeded in six-well plates, were treated with SAHA (1 µM) or vemurafenib (0.01–0.5 µM) for various time points (24–72 h). Cells were then trypsinized, collected, fixed with 75% ethanol (1–2 h at −20°C), and stained with propidium iodide (PI; 30 min; light protected). The percentage of apoptotic cells was determined by evaluation of PI-stained preparations of the cells accumulated at the sub-G0 phase of the cell cycle (>2 N) as described previously35,36 in vemurafenib and/or SAHA-treated melanomas (not shown). Cell cycle analysis and apoptosis were determined using an LSRII flow cytometer. A minimum of 10,000 events was collected on each sample and acquired. Cellular debris (included disintegrated apoptotic cells) was excluded from analysis by raising the forward scatter threshold, and the DNA content of the intact nuclei was recorded on a logarithmic scale. Analysis was performed using ModFit software.
Analysis of gene expression profile using focused array quantitative real-time polymerase chain reaction
Samples were analyzed with iQ SYBR Green Supermix by iCycler Sequence Detection CFX-96 RT-PCR System (Bio-Rad, Hercules, CA) using RT 2 profiler MAPK focused polymerase chain reaction (PCR) array plates. Total RNA was extracted from 5 × 10⁶ melanomas (±SAHA (1 μM—16 h)) with RNeasy Mini Kit (QIAGEN, Germantown, MD) and quantified by NanoDrop ND-1000 spectrophotometer. A total of 2.5 μg of total RNA was reverse transcribed to first-stranded complementary DNA (cDNA) for 1 h at 42°C with SuperScript II RT and random hexamer primers. A volume of 25 µL of cDNA was loaded into each well of RT 2 Profiler plate and data were analyzed by software provided by the manufacturer (http://pcrdataanalysis.sabiosciences.com/pcr/arrayanalysis.php).
Apoptosis assessment by evaluation of active caspase-3 levels
Cells were treated under the conditions described for PI staining. At the end of the incubation period, the cells were washed once with ice-cold 1× phosphate-buffered saline (PBS)/0.1% bovine serum albumin (BSA) and resuspended in 100 μL of ice-cold 1× PBS/0.1% BSA. A total of 2 × 10⁶ cells (in 50 μL) for each sample were fixed with the perm/fix solution (PharMingen, San Jose, CA) for 20 min. The cells were then washed twice with 1× perm/wash solution and stained with the fluorescein isothiocyanate (FITC)-labeled anti-active caspase-3 antibody (1:1000 dilution) for 30 min (light protected). Samples were then washed with 1× perm/wash solution followed by analysis using LSRII flow cytometer (Coulter Electronics, Miami, FL). As negative control, the cells were stained with isotype control (pure IgG1 (immunoglobulin G1)) under the same conditions described above.
Immunoblot analysis
Melanomas were lysed at 4°C in radioimmunoprecipitation assay (RIPA) buffer (50 mM Tris-HCl (pH 7.4), 1% NP40, 0.25% sodium deoxycholate, and 150 mM NaCl, supplemented with one tablet of protease inhibitor mixture, cOmplete Mini (Roche, Indianapolis, IN)). Protein concentration was determined by a DC Protein Assay Kit (Bio-Rad). An aliquot of total protein lysate was diluted in an equal volume of 2× sodium dodecyl sulfate (SDS) sample buffer and boiled for 10 min. Cell lysates were then electrophoresed on 12% SDS–polyacrylamide gel electrophoresis (PAGE) and were subjected to western blot analysis. Immunoblots were transferred from the gels onto Hybond nitrocellulose membranes (Amersham Life Science, Arlington Heights, IL) in a semidry transblotting cell apparatus (Bio-Rad). Non-specific binding sites were blocked for 1 h at room temperature with freshly prepared 5% non-fat skim milk in Tris-buffered saline (TBS)/0.1% Tween 20. The membranes were then incubated for overnight at 4°C with constant agitation with the following antibodies: AKT, phospho-AKT (S473), phospho-AKT (T308), ERK1/2, and phospho-ERK1/2 (T202/Y204). After washing with TBS/0.1% Tween 20 twice, the membranes were incubated for 90 min with horseradish peroxidase–conjugated anti-rabbit IgG antibody (New England BioLabs, Beverly Hills, MA) and developed with Super-Signal Chemiluminescence Kit (Pierce, Waltham, MA). Previously labeled membranes were stripped by heating in a microwave for 60 s at 900 W with Restore Western Blot Stripping Buffer (25 mM glycine–HCl (pH 2.1)/1% SDS; Thermo Fisher Scientific, Rockford, IL) followed by extensive (four times) washing with 1× PBS. Subsequently, the blot was blocked for 1 h at room temperature in the blocking buffer containing 5% milk with 0.1% Tween-20 and then subjected to immunoblot analysis
iReport
We identified the biological processes, pathways, and/or diseases that were most significant to the data set. Genes from the data set were associated with biological processes, pathways, and/or diseases in Ingenuity’s Knowledge Base and were considered for the analysis.
Statistical analysis
Statistical analysis was performed by determining the p values (p < 0.05: significant) and unpaired student t test. Two-way analysis of variance (ANOVA) test was used for determination of significance among groups.
Results
Regulation of cell cycle distribution by vemurafenib and SAHA in melanomas harboring BRAFV600E
To understand the dynamics of cell cycle regulation during vemurafenib therapy, we have generated VemR sublines11,32 and have evaluated the regulation of cell cycle progression by vemurafenib and the HDACi SAHA. Flow cytometric analysis of cell cycle distribution upon treatment with vemurafenib demonstrated potent G0/G1 arrest in M249 and M238 melanoma cell lines harboring BRAFV600E that correlated with vemurafenib concentrations used, an effect that was clearly evident by 0.01 and 0.1 μM of vemurafenib. However, this effect was not evident at 72 h. SAHA induced G0/G1 arrest of M249 cells which progressed with time. G0/G1 arrest was only observed in M238 cells at 24 h post SAHA treatment. Moreover, SAHA induced delayed G2/M arrest of M238 and M249 parental cells starting at 48 h post treatment (Figure 1(a) and (d)). Combination of SAHA and low concentration of vemurafenib (0.01 μM) also induced G2/M arrest of M238 and M249 cells which was not superior to those observed by SAHA treatment alone. G2/M arrest induced by SAHA + vemurafenib in M249 cells accompanied significant reduction in the percentage of S phase cells. Higher vemurafenib concentrations resulted in apoptotic cell death of the parental cells but not the VemR sublines (see below). In contrast, no G0/G1 arrest induced by vemurafenib was observed in VemR sublines (Figure 1(b), (c), (e), and (f)).
Analysis of cell cycle distribution in a panel of BRAFV600E harboring parental and vemurafenib-resistant (VemR) human melanoma cells. Parental melanoma cell lines (a) M238 and (d) M249 and VemR sublines (b) M238(VemR1), (c) M238(VemR2), (e) M249(VemR1), and (f) M249(VemR2) were left either untreated or treated with single agent vemurafenib (0.01–0.5 µM) and SAHA (1 µM) or combination of vemurafenib + SAHA for various intervals (24–72 h) and subjected to cell cycle analysis using FACS analysis. Results are representative of three independent experiments.
Treatment with SAHA promoted cell cycle arrest at the G2/M phase of M28(VemR1) and M238(VemR2) sublines concurrent with a reduction in the percentage of the G0/G1 and S phase cells. Combination of SAHA + vemurafenib had a biphasic effect on M238(VemR) cells. At 24 h post combination treatment, an increase in the percentage of G0/G1 and G2/M (to lesser extent) concomitant with a reduction in the percentage of S phase cells was observed. However, at later time points (48 and 72 h), the percentage of cells accumulated at G2/M increased at the expense of S and G0/G1 (to lesser extent) phase arrested cells (Figure 1(b) and (c)).
A different pattern emerged while analyzing the effects of SAHA on M249(VemR) sublines. In M249(VemR1) subline, initially the percentage of cells at the G2/M phase slightly increased (24 h post SAHA treatment) with progressive reduction with time. This event was accompanied by increase in G0/G1 cells and decrease in cells residing at the S phase (Figure 1(e)). In M249(VemR2) subline, a progressive increase in the proportion of G2/M cells with time (peak at 48 h) along with significant S phase reduction and modest increase in G0/G1 cells (except at 48 h) were observed (Figure 1(f)). As single agent, vemurafenib had no effect on cell cycle distribution of M249(VemR) cells (Figure 1(e) and (f)).
In M249(VemR1) subline, combination of SAHA + vemurafenib for 24 h significantly reduced the percentage of S phase cells and increased the proportion of G0/G1 cells, while no significant change in the percentage of G2/M phase cells was observed. At 48 h post combination treatment, slight reduction in S phase cells concurrent with slight increase in G0/G1 cells and no significant change in G2/M cells were noticed. These effects were more pronounced at 72 h post combination treatment: significant G0/G1 arrest along with significant S phase reduction and G2/M reduction (Figure 1(e)). A more consistent pattern was observed in M249(VemR2) cells compared to M249(VemR1) subline upon combination treatment: significant increase in the percentage of the cells accumulated at G0/G1 phase (less pronounced at 48 h) concomitant with significant decrease in S phase cells (less pronounced at 48 h) and G2/M arrest (Figure 1(f)). We presume that cells arrested at various phases of the cell cycle (G0/G1, S, or G2/M) eventually undergo apoptosis (see below). The observed inconsistencies may be explained by differences in the anatomical and histological origin of the cells, differences in the mutational/activation status, as well as the mode of acquisition of vemurafenib resistance.11,32,34 Collectively, these results suggest that refractoriness of VemR cells to the cytostatic effects of vemurafenib can be partially rescued by the addition of SAHA.
VemR cell lines exhibit elevated activity of survival pathways
We performed western blot analysis to assess phosphorylation profile of key components of the p44/42 MAPK (ERK1/2) and AKT survival pathways. VemR sublines showed hyperphosphorylation of ERK1/2 (Thr202, Tyr204), which was more pronounced in M249(VemR1, 2) sublines compared to M238(VemR; Figure 2). Analysis of AKT phosphorylation status did not reveal increased phosphorylation of either Thr308 or Ser473 residues in the VemR sublines (Figure 2).

Analysis of ERK1/2 and AKT phosphorylation in a panel of BRAFV600E harboring parental and vemurafenib-resistant (VemR) human melanoma cells. Antibodies specific to p-AKT (Thr308, Ser473), basal AKT (top panels), basal ERK, and p-ERK (Thr 202, Tyr 204) were used in western blotting for the analysis of the activity of the AKT/PI3K and ERK signaling cascades. Levels of α-tubulin were used to confirm equal sample loading.
Cytostatic effects of vemurafenib ± SAHA in parental and vemurafenib-resistant melanomas
To assess the cytostatic effects of these drugs, we performed time kinetics analysis of changes in the metabolic activity of melanoma cell lines treated with various concentrations of vemurafenib ± SAHA. Metabolic activity of untreated cells at each time point was set as 100%, and the percentage of control was used to demonstrate any changes in the metabolic activity of the cells. We observed a reduction in the metabolic activity of parental melanomas, which correlated with the concentration of BRAFi used. The cytostatic effects of BRAFi were further enhanced by the addition of SAHA in some instances. However, VemR sublines did not respond to the cytostatic effects of BRAFi; in fact, both SAHA and vemurafenib slightly potentiated their metabolic activity. The rate of metabolic activity of VemR sublines was reduced only in the presence of combination of SAHA and vemurafenib, which correlated with vemurafenib concentration used (Figure 3). M249(VemR1) cells only show modest reduction in metabolic activity by the combination of vemurafenib + SAHA at high vemurafenib concentration (0.5 μM) and at later time points (72 h). This contrasts with M238(VemR1) cells which showed reduced metabolic activity as early as 24 h post combination treatment at high vemurafenib concentrations; the origin of these two parental cells and their mutational/activation status as well as the mode of acquisition of vemurafenib resistance are not the same in these sublines.11,32,34
Cytostatic effects of vemurafenib ± SAHA in a panel of BRAFV600E harboring parental and vemurafenib-resistant cells. (a) M238 and M238(VemR1) and (b) M249 and M249(VemR1) melanoma cells were grown in the absence (control) or presence of vemurafenib (0.01–0.5 µM) ± SAHA (1 µM) for the indicated time points (24–72 h), and proliferation was assessed by XTT assay. Samples were set up in triplicates, and results are presented as mean ± SEM of two independent experiments.
Apoptosis induction by vemurafenib ± SAHA in parental and vemurafenib-resistant melanomas
We evaluated the apoptotic effects of BRAFi and SAHA (alone and in combination) on parental and VemR melanomas by measuring the levels of active (cleaved) caspase-3 (Figure 4) and by assessing the percentage of PI+ cells using flow cytometric analysis (data not shown). We observed that parental M238 cells were sensitive to vemurafenib in a concentration-dependent SAHA-pretreated manner but not to SAHA irrespective of SAHA exposure time. M238 cells were sensitive to vemurafenib similar to parental cells. M238(VemR1) cells (resistant to vemurafenib) showed cross-resistance to SAHA and combination of SAHA + vemurafenib was not superior to vemurafenib and/or SAHA alone (Figure 4(a)).
Apoptotic effects of vemurafenib ± SAHA in a panel of BRAFV600E harboring parental and vemurafenib-resistant cells. (a) M238 and M238(VemR1) and (b) M249 and M249(VemR1) melanoma cells were grown in the absence (control) or presence of vemurafenib (0.01–0.5 µM) ± SAHA (1 µM) for the indicated time points (24–72 h), and apoptosis was assessed by measuring the levels of active caspase-3.
Parental M249 melanoma cell line did not show significant sensitivity to vemurafenib and SAHA (as single agents) and were not sensitive to combination of SAHA + vemurafenib irrespective of vemurafenib concentration and exposure time. Pretreatment of M249 cells with SAHA and high concentration of vemurafenib (2.5 μM) induced apoptosis in a time- and concentration-dependent manner. M249(VemR1) cells followed the same pattern as the parental cells: no apoptosis was observed in M249(VemR1) subline by either agent alone. Vemurafenib (only at high doses) induced significant killing in SAHA-pretreated M238(VemR1) cells similar to parental M249 pretreated with SAHA (Figure 4(b)).
Expression profile of cell cycle–related genes in parental and VemR sublines and their regulation by SAHA
Focused apoptosis array quantitative real-time PCR (qPCR) analysis showed that the expression of several groups of cell cycle–associated genes, all of which regulated by the MAPK pathway, was altered in M249(VemR) and M238(VemR) sublines compared to their parental cells. The expression levels of positive regulators of cell cycle (e.g. cyclins, CDK inhibitors, CDKs) were reduced (−2.25 to −19.51-fold; Tables 1 and 2), which was consistent with a more proliferative phenotype. Treatment of these VemR sublines with SAHA reversed the expression levels of positive regulators of cell cycle and decreased the expression levels of several negative regulators of cell progression, consistent with a cell cycle inhibitory gene program. Overall, we observed 1.71- to 19.36-fold induction in the messenger RNA (mRNA) levels of these genes upon exposure to SAHA. In comparison, a larger number of cell cycle regulators were modified in M238(VemR) (±SAHA) sublines compared to their parental counterparts; however, a very similar trend was observed in M249(VemR; Tables 1–4).
M238(VemR1) and M238(VemR2) compared to M238.

VemR: vemurafenib resistant; mRNA: messenger RNA; CDK: cyclin-dependent kinase.
M249(VemR1) and M249(VemR2) compared to M249.
VemR: vemurafenib resistant; mRNA: messenger RNA; CDK: cyclin-dependent kinase.
M238(VemR1) + SAHA and M238(VemR2) + SAHA compared to M238(VemR1) and M238(VemR2).

VemR: vemurafenib resistant; mRNA: messenger RNA; CDK: cyclin-dependent kinase.
M49(VemR1) + SAHA and M49(VemR2) + SAHA compared to M249(VemR1) and M249(VemR2).

VemR: vemurafenib resistant; mRNA: messenger RNA; CDK: cyclin-dependent kinase.
Schematic representation of modifications of cell cycle regulators and their modulation by SAHA
Using the iReport online pathway analysis tool, we developed a schematic representation of the dynamics of cell cycle regulators (cyclins and CDK, and CDKI) in M249 melanomas upon acquisition of vemurafenib resistance and their modulation by SAHA (as these lines showed highest levels of mRNA changes). Dark gray shades depict downregulation of cell cycle regulators associated with G0/G1, S, and G2/M progression in VemR subline, suggesting their contribution to unresponsiveness of the VemR sublines to the cytostatic effects of vemurafenib. Expression levels of these genes were reversed by SAHA, implicating their role in the cytostasis of VemR sublines observed in Figure 5.
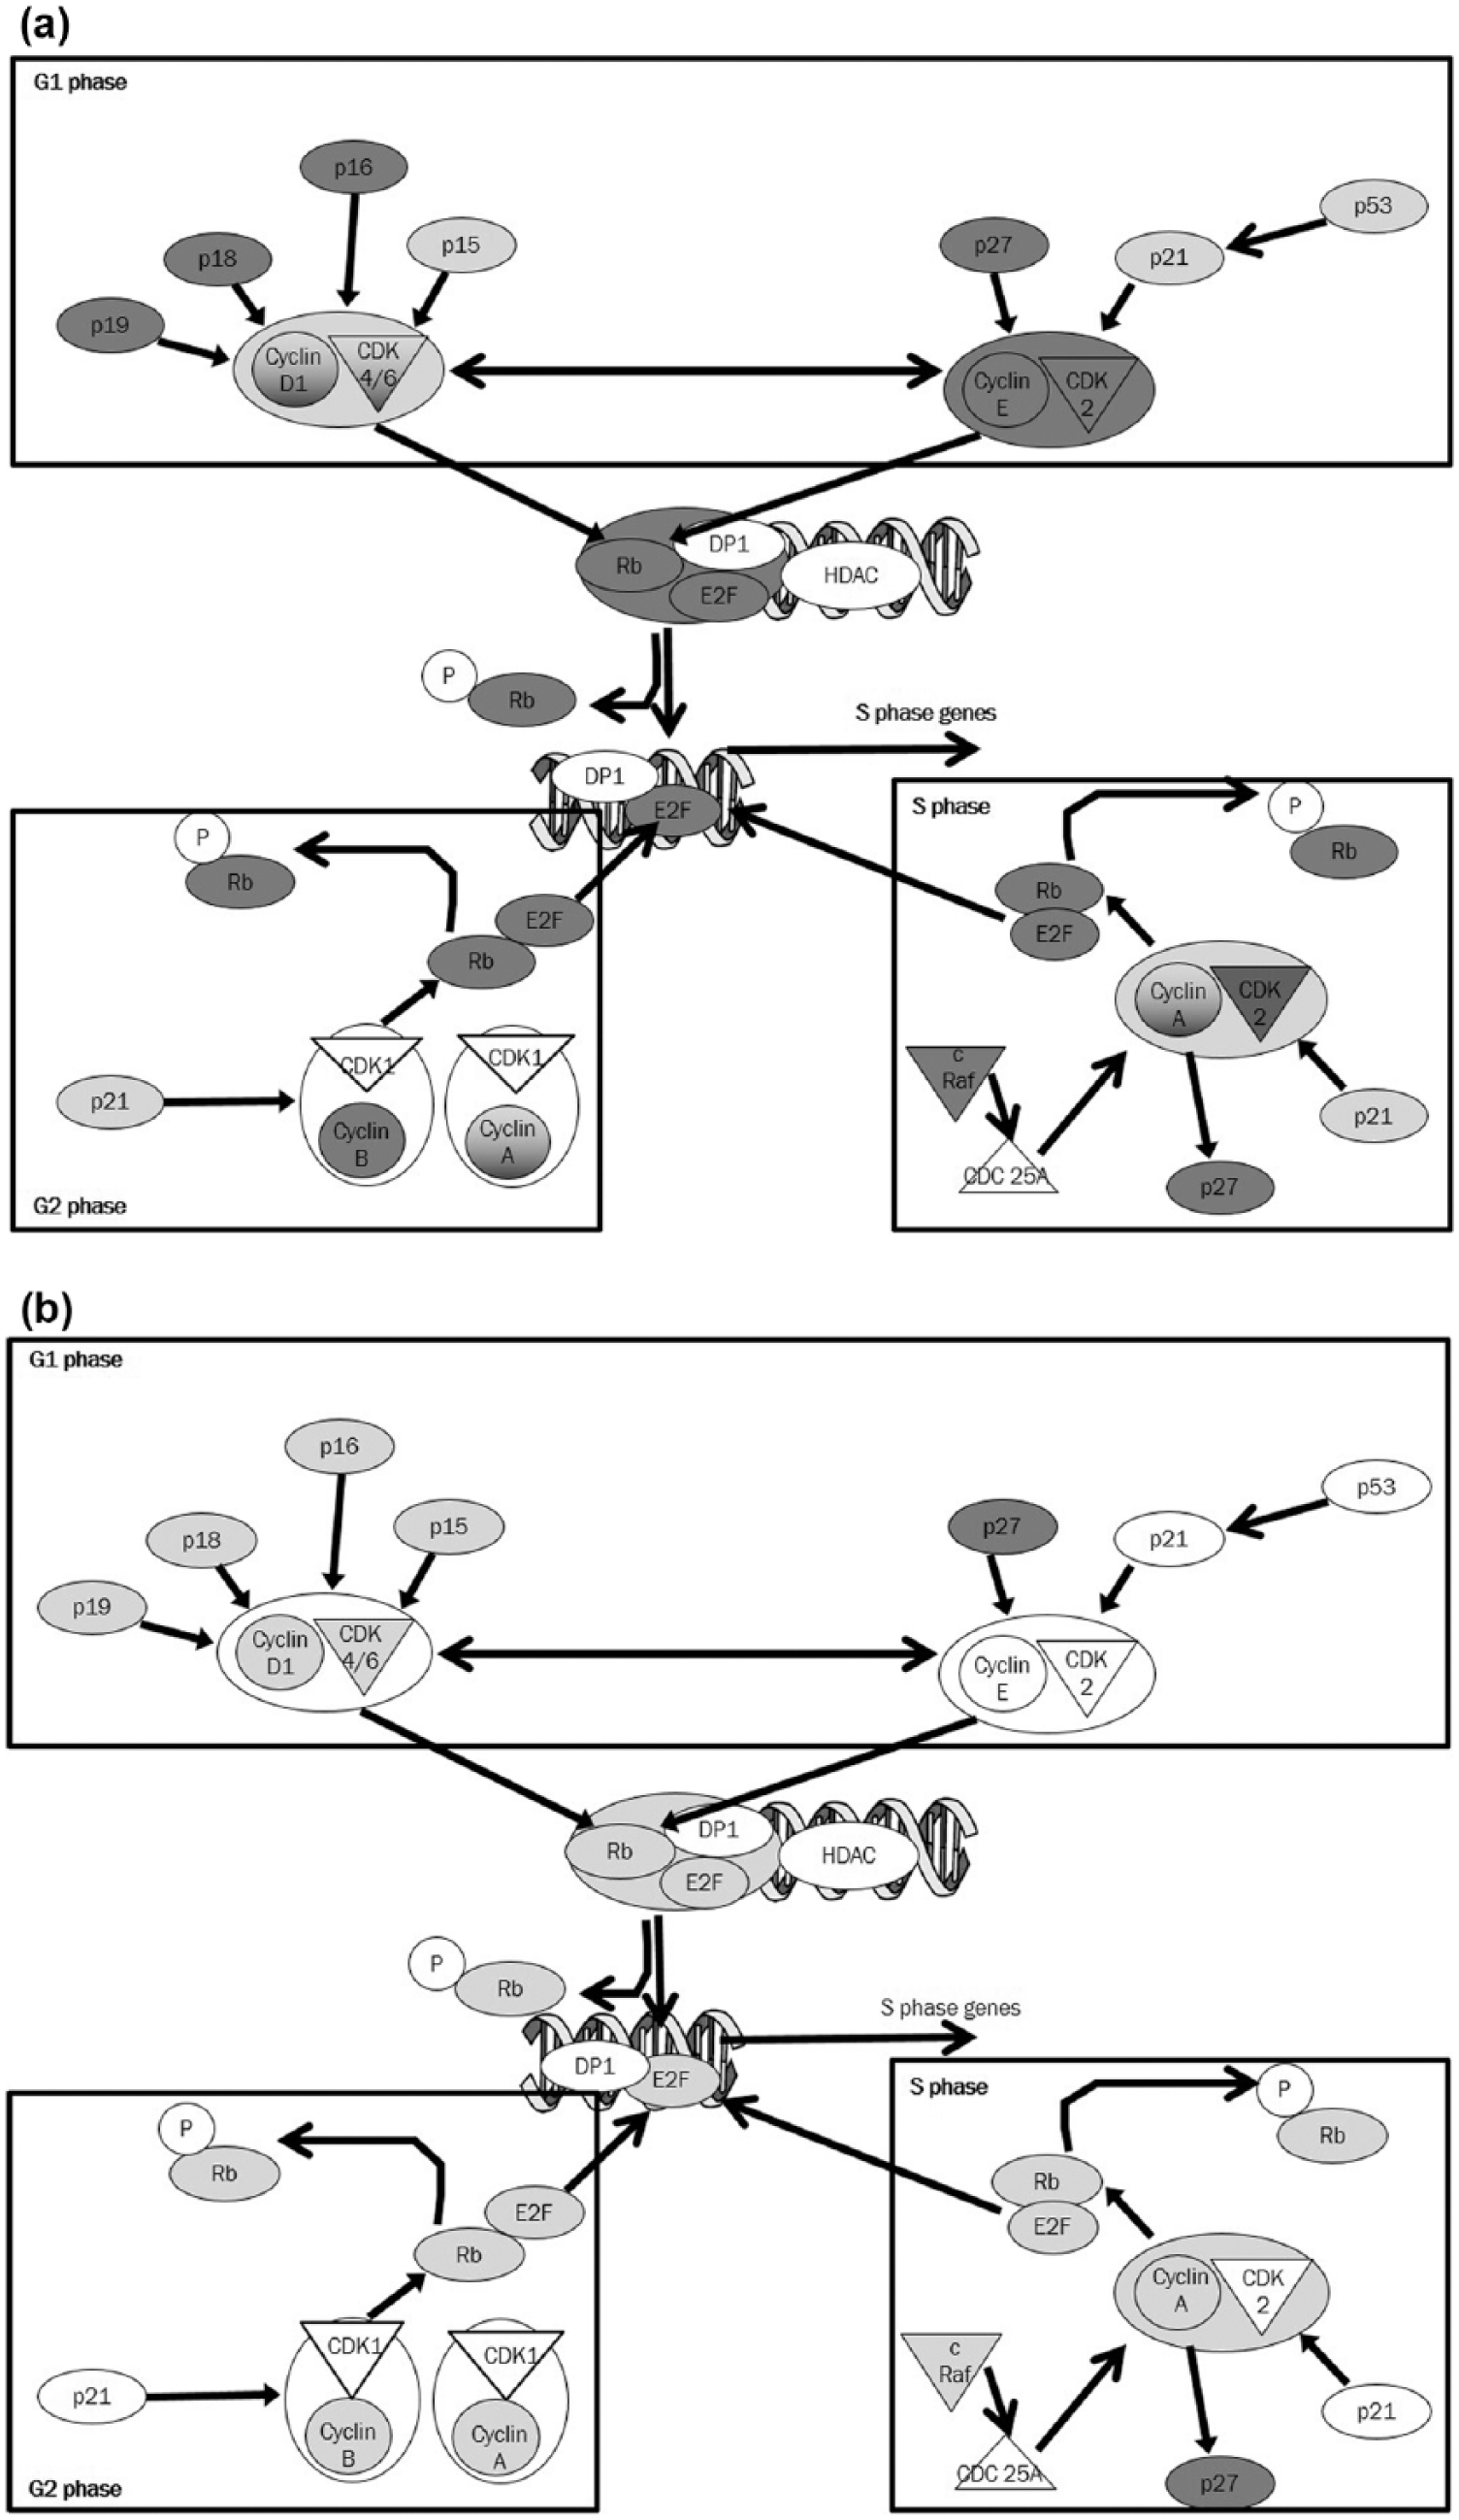
Schematic representation of differentially expressed cell cycle regulatory genes in M249(VemR2) subline. The iReport (Ingenuity® Systems, www.ingenuity.com) was used to construct a model based on (a) comparison of genes differentially expressed in M249 and M249(VemR2) and (b) genes differentially expressed in M249(VemR2) cell line following SAHA treatment (1 μM—16 h), compared to the M249(VemR2) cell line.
Discussion
Vemurafenib exerts its anti-melanoma effects, in part, via arresting cell cycle progression at the G1 phase,4,37–39 which promotes the effects of radiation. 39 However, VemR cells have adopted mechanism to survive despite inhibition of MAPK survival pathway.
The underlying molecular mechanisms of melanoma resistance to BRAFi have been the subject of intense research by numerous investigators. VemR melanoma sublines used in our studies, M238(VemR) and M249(VemR), were previously derived from their isogenic parental BRAFV600E melanoma cell lines; however, their grade and anatomical site of isolation vary. 34 Nazarian et al. 11 discovered that M238(VemR) sublines confer vemurafenib resistance through PDGFR-β upregulation, and M249(VemR) sublines confer resistance through NRAS Q61R/L mutation and overexpression. This pioneering study paved the way for future preclinical and clinical studies of combination therapies. We have also previously reported that M238 and M249 VemR sublines develop cross-resistance to apoptosis induced by T cell receptor (TCR)-engineered melanoma-specific cytotoxic T (CTLs) and natural killer (NK) cells and the acquired resistance was partially reversed by SAHA. 32 However, each VemR subline had its own unique set of distorted expression of apoptotic genes (although some overlap existed). Moreover, the regulatory effects of SAHA on individual apoptotic genes was not identical in various VemR sublines; however, the collective effect of SAHA on various groups of apoptotic genes favored the generation of a pro-apoptotic gene program. In this study, we analyzed the underlying mechanism of inability of vemurafenib to induce cell cycle arrest in VemR sublines and investigated whether the addition of HDACi can partially restore the cell cycle inhibitory effects of vemurafenib. Vemurafenib induced G0/G1 phase arrest in parental but not in VemR sublines, whereas HDACi SAHA stimulated G2/M arrest at the expense of S phase irrespective of vemurafenib sensitivity. In BRAFV600E harboring parental lines, combination of SAHA and vemurafenib induced both G0/G1 arrest and apoptosis, whereas in VemR sublines, combination induced both G0/G1 and G2/M arrest resulting in dramatic cytostasis with no potentiation of apoptosis. VemR sublines exhibited ERK1/2 but not AKT and hyperphosphorylation. Large scale gene expression analysis showed MAPK hyperactivation and deregulation of cyclins and CDKs in VemR sublines, all of which were reversed by SAHA (albeit to varying degrees). Alterations in MAPK gene expression profile are consistent with the cytostatic effects of SAHA. Our results show that unresponsiveness of VemR sublines to the biological effects of vemurafenib may be amenable by SAHA. Our data may also assist clinicians to design combination treatment modalities to overcome resistance to vemurafenib.
BRAFi reduces expression of genes implicated in G1 cell cycle progression such as pRb, cyclin D, and cyclin E and induces expression of CDKN1A (p21) and CDKN1B (p27).4,40 In addition to these genes, our studies suggest that the overall balance of the expression profile of a larger number of genes dictates whether the cells undergo cytostasis or progress through the cell cycle. In an in vivo model of hepatocellular carcinoma, SAHA partially restored the expression levels of p27. 41 In addition to confirming these data, we observed decrease of CDKN2A (p16), CDKN2C (p18), and CDKN2D (p19) that regulate CDK4/6 and cyclin D complex formation. Significantly, expression levels of p15, p16, p18, and p19 are globally downregulated in VemR sublines, which is restored by SAHA. However, these changes alone are insufficient to promote G1 arrest in VemR sublines.
HDACi increases p21 expression and G0 arrest in prostate cancer cell lines. 42 We also observed p21 induction by SAHA with subsequent G2/M arrest, a phenomenon consistent with a study using tamoxifen-resistant cell lines and xenografts. 43 Consistent with our findings, treatment of gliomas with vorinostat increases p21 expression and decreases cyclin B1. This was associated with decrease in phosphorylation (activity) of the CDK1/cyclin B complex, resulting in G2 arrest. 44 Exposure of neural stem cells to SAHA promotes G1 arrest and induction of p21 and p27 due to H3K9 hyperacetylation. 45 Similarly, SAHA treatment of acute myeloid leukemia (AML) cells induces p19 and p21 expression, prompting G2/M arrest. 46 Similar effects were noticed in M249(VemR) but not in M238(VemR) sublines, which requires further study. It is postulated that vorinostat-induced G2/M arrest is via oxidative DNA damage. 47 Also, hyperactivation of ERK in VemR cells increases the production of reactive oxygen species (ROS) that are known to facilitate G0 to G1 passage, 48 which explains the unresponsiveness of VemR to vemurafenib-induced cell cycle arrest. The mRNA profile of p53, p21, cyclin E, CDK2, 4, and 6 is more consistent with G1 arrest; however, VemR cells progress through cell cycle in the presence of vemurafenib, possibly due to inadequate translation of these genes. Concurrently, in vivo genetic studies challenge the idea of the necessity of certain CDKs for cell cycle progression (e.g. CDK2, 4, and 6).49–51 Mice lacking these CDKs are viable, suggesting the presence of redundant/compensatory mechanisms performed by other cell cycle regulators. 52
Analysis of patient samples responsive to vemurafenib shows reduced levels of cyclin D1. 53 Accordingly, our VemR sublines showed increased mRNA expression of cyclin D. Reduced levels of cyclin D1 subunits in M249(VemR) subline were restored by SAHA, whereas other investigators observed the opposite. 54 This discrepancy can be explained by different histological origin of the cell lines used, differences in the activation/mutational status of the cells, dose and drug exposure time, as well as modulation of various gene groups by SAHA in different models studied.
The retinoblastoma (Rb) protein is downregulated in Vem(R) sublines compared to their parental counterparts. Rb sequesters E2F and hampers gene transcription.55–59 We also observe E2F downregulation, yet it appears that expression of genes promoting cell cycle progression to S phase are restored. This warrants further scrutiny.
Similar to our findings, vemurafenib fails to induce cell cycle arrest in BRAFV600E harboring VemR melanomas. However, it promotes apoptosis upon exposure to SAHA by inducing pro-apoptotic genes. 60 VemR cells were arrested at G2/M upon SAHA exposure; however, the amount of cytotoxicity was not improved in combination with vemurafenib; the difference can possibly be explained by the concentration of the drugs used and the exposure time, factors that directly regulate temporal expression profile of various apoptotic genes. We have reported positive regulation of apoptotic machinery in Vem/CTL dual-resistant melanomas after SAHA treatment where dual-resistant cells underwent significant apoptosis delivered by MART-1-specific CTLs. In this instance, SAHA served as an immunosensitizer. 32
Although the parental melanomas and their VemR derivatives used in this study follow very similar response patterns to BRAFi and SAHA; however, they exhibit several differences in expression level and the nature of the genes affected by the drugs. This variance is evidently related to the clinical course of the disease the cells were originally isolated from, as well as various genetic and epigenetics differences in these cells.
In this study, we focused on establishing the phenomenon of refractoriness of VemR melanoma sublines to cell cycle inhibitory effect of vemurafenib and to design possible approaches to modify the expression profile of genes involved in cell cycle progression. Undoubtedly, the scheduling and dosage of the combination treatment of VemR cells can be further optimized which requires further investigation. It would be interesting to evaluate how changes in the sequence of drug treatment (vemurafenib pretreatment followed by SAHA or simultaneous combination treatment) will affect cell cycle distribution. Identification of the main cell cycle regulatory gene(s) responsible for lack of cell cycle inhibition of VemR cells and its regulation by SAHA in each resistant subline (depicted in Tables 1–4) requires thorough biochemical and functional analysis, warrants further examination, and is beyond the scope of the this study. The responses of VemR sublines to vemurafenib and SAHA (as single agents and/or combined) did not follow an identical pattern. The inconsistencies can be attributed to the activation/mutational status of the cells, modes of acquisition of vemurafenib resistance, as well as their different original anatomical isolation site and their grade.
Clearly, tumors employ various mechanisms to bypass cell cycle checkpoint modulators including vemurafenib, PD-1, and CTLA-4-blocking antibodies. More detailed functional analysis of the genes implicated in cell cycle progression and cell cycle regulatory mechanisms will provide useful information to optimize treatment of VemR patients using combination therapy. However, the results presented here suggest that unresponsiveness of VemR sublines to the biological effects of vemurafenib may be amenable by SAHA. The results presented here can serve as a platform for future studies to use combination therapy (e.g. chromatin modifiers + vemurafenib) to manage melanoma patients who have developed resistance to vemurafenib despite initial responsiveness.
Footnotes
Declaration of conflicting interests
The author(s) declared no potential conflicts of interest with respect to the research, authorship, and/or publication of this article.
Funding
The author(s) disclosed receipt of the following financial support for the research, authorship, and/or publication of this article: This project was supported in part by the UCLA Department of Medicine Start Up Funds (to R.N.) and the National Institutes of Health (NIH; Grant No. 1R21CA149938 to A.R. J.).