
Abstract
Gastrointestinal cancer is a leading contributor to cancer-related morbidity and mortality worldwide. Early diagnosis currently plays a key role in the prognosis of patients with gastrointestinal cancer. Despite the advances in endoscopy over the last decades, missing lesions, undersampling and incorrect sampling in biopsies, as well as invasion still result in a poor diagnostic rate of early gastrointestinal cancers. Accordingly, there is a pressing need to develop non-invasive methods for the early detection of gastrointestinal cancers. Biomedical optical spectroscopy, including infrared spectroscopy, Raman spectroscopy, diffuse scattering spectroscopy and autofluorescence, is capable of providing structural and chemical information about biological specimens with the advantages of non-destruction, non-invasion and reagent-free and waste-free analysis and has thus been widely investigated for the diagnosis of oesophageal, gastric and colorectal cancers. This review will introduce the advances of biomedical optical spectroscopy techniques, highlight their applications for the early detection of gastrointestinal cancers and discuss their limitations.
Introduction
Gastrointestinal cancer (GIC) is a leading contributor to cancer-related morbidity and mortality worldwide. 1 Early diagnosis followed by surgical operations is critical to prolong the survival time of patients with GIC and save direct medical costs. Endoscopy with biopsy is currently the principal method to detect early GIC. However, it has 10%–15% rates of missed lesion depending on the skill and experience of endoscopists, preparation methods before examinations and endoscopic equipment. 2 The result of biopsy may be falsely negative due to undersampling, incorrect sampling adjacent to the lesion or pathologist error. 3 In addition, occasionally unavoidable and unnecessary biopsies taken for precautionary reasons may be invasive to patients. 4 Biomarkers that can improve patient satisfaction and enhance the predictive results for GICs have been intensively sought and validated in recent years. In spite of the great progress in this field, few biomarkers have become practical screening tools with high sensitivities and specificities. 5
The emergence of optical spectroscopy (OS) offers great promise for wide use in medical fields, especially for early detection of GICs. The changes in the body leading to diseases such as cancer are thought to be due to structural alterations and biochemical transformations of proteins, nucleic acids, lipids and carbohydrates.6,7 As a rapid photonic technology, OS is sensitive to characterize all of these changes and consequently generate a unique optical fingerprint (FP) via the absorption and scattering of photons after interactions with different chemical elements and compounds.8,9 Thus, analysing optical spectra can reveal a superposition of all constituents in the measured sample and consequently provide a vast amount of potentially useful disease-related information. 10 In the context of clinical diagnostics, the technique has the advantages of small sample sizes, ease of sample preparation and not destroying a sample’s biochemistry. 11 Furthermore, it has the ability to provide a real-time, non-invasive and in situ optical signature, thus allowing the analysis of complex biological substrates and biofluids. 12 Generally, OS is a cost-effective tool for diagnosis.13–15
In this review, we provide an overview of the state-of-the-art OS techniques and their possible future applications in the early detection of GICs.
Techniques of OS for diagnosis
Infrared spectroscopy
Infrared (IR) spectroscopy is spectroscopy that considers the IR region of the electromagnetic (EM) spectrum. The IR portion of the EM spectrum is usually divided into three regions: the near infrared (NIR; 14,000–4000 cm−1), middle infrared (MIR; 4000–400 cm−1) and far infrared (FIR; 400–10 cm−1), which are named for their relation to the visible spectrum. 16 The MIR region provides the most important spectral information about the double-bond region (2000–1500 cm−1 associated with C = C, C = N and C = O stretching) and the FP region (1500–600 cm−1, which identifies bending and skeletal FP vibrations). 17 Many biomolecular constituents are known to be absorbed at this region, such as Amide I at ~1650 cm−1, Amide II at ~1550 cm−1, Amide III at ~1260 cm−1, lipids at ~1750 cm−1, glycogen at ~1030 cm−1 and carbohydrates at ~1155 cm−1. 18 The asymmetric and symmetric phosphate stretching vibrations of DNA are located at ~1225 and ~1080 cm−1, respectively. 19
Absorption in the NIR region is typically due to the H-containing functional groups of the constituent molecules such as C–H, N–H and O–H. 20 The absorption bands are typically broad and overlapping and primarily correspond to the overtone and combination of the fundamental molecular vibrations. 21 Consequently, a quantitative analysis with NIR spectroscopy in complex clinical samples is complicated without distinct signatures of individual components. Therefore, a variety of chemometric methods have been used to analyse NIR spectra. 22 Chen et al. 23 employed diverse statistical methods to extract NIR spectral features and construct effective diagnostic algorithms for classifying colorectal cancer (CRC) and healthy tissues, including partial least-square (PLS) discriminant analysis, K-nearest neighbour (KNN), classification and regression tree (CART) and random forest (RF) classifiers. The KNN, CART and RF models have the same performance (sensitivity 94.9%, specificity 100%) in the training set, but the CART and RF models exhibit lower misclassified ratios (4/94) than does KNN (7/93) in the test set. Fourier transform infrared (FTIR) spectroscopy is a promising technique that uses the mathematical Fourier transform process to extract quantitative information from the featureless IR spectra. 24 Recently, various new clinical applications of FTIR have been reported in the biomedical diagnosis of GICs. It has shown promising performance for identifying neoplasia in the stomach, with a sensitivity of 100% and a specificity of 83.3%. 25
Raman spectroscopy
Raman spectroscopy represents a unique optical technique that relies on the inelastic scattering of photons exchanging energy via molecular vibrations after irradiation with a light laser.26,27 It is a powerful tool for providing details of the chemical composition and molecular structures in cells and tissues due to its major advantages of being label-free and non-destructive, not requiring sample preparation and having high spatial resolution, weak water scattering and no photobleaching, compared with the other optical diagnostic techniques.28–30 However, the major obstacle in the development of clinical Raman applications is the weak Raman signal, which is attributed to only small fraction of photons (approximately 1 in 106–108) undergoing Raman scattering and strong fluorescence background in biological samples. 31
Using NIR or ultraviolet (UV) wavelengths as excitation sources can minimize the spectral overlap between the Raman and fluorescence spectra, thereby reducing the fluorescence background. 32 As a result of the sample degradation and photo damage at UV excitation, Raman spectroscopy with NIR laser light excitation is particularly attractive with an additional advantage of deeper penetration into the tissue. 33 Therefore, NIR Raman spectroscopy has been studied for the detection of malignant lesions in a number of organs, including the cervix, 34 skin, 35 breast, 36 and kidney. 37 High diagnostic accuracies have been achieved for discriminating early gastric cancer (GC; 93%) and CRC (93.2%) from normal tissues.38,39
Surface-enhanced Raman spectroscopy (SERS) is also a promising solution that can greatly enhance the Raman signal level depending on the nanoscale metal or colloid surface. It is commonly thought that EM enhancement is the dominant contribution of SERS enhancement, which refers to the extent of 104–107.40,41 An additional chemical contribution (referred to as chemical enhancement) can be observed with a minor extent (typically 10–102) to the overall enhancement. 42 Additionally, this technique has been expanded to novel nanoprobes (SERS tags) that fabricate antibodies or other targeting molecules onto metallic nanoparticles. 43 A chief advantage of SERS tags is the possibility for multiplexed measurements contributing to the narrow spectral features. 44 There is still very much work in progress for standard measures of different SERS tags within and between laboratories. 45 In addition, some sophisticated techniques, such as multi-excitation, 46 Wiener estimation, 47 and mathematical statistical methods,48,49 have been employed to suppress or remove the fluorescence background.
Currently, Raman spectroscopy for the detection and evaluation of cancer and precancerous conditions is mostly focused on the FP region between 800 and 1800 cm−1.50,51 A comparison study by Short et al. 52 suggested that the use of high-wavelength (HW) Raman spectroscopy (2050–3100 cm−1) can improve the identification of neoplastic lesions compared with FP. This is probably because HW spectra can offer complimentary information related to both the CH2/CH3 stretching of lipids/proteins and the considerably reduced tissue fluorescence background.53–56 Furthermore, the development of the integrated FP/HW Raman technology provides diagnostic advantages over either the FP or HW modality alone. The receiver operating characteristic (ROC) curve analysis showed that FP/HW Raman technology gave an area under the ROC curve (AUROC) of 0.92 (FP: 0.89, HW: 0.86) for gastric intestinal metaplasia classification. 57
Diffuse reflection spectroscopy
When a beam of incident light penetrates into an object and undergoes absorption and scattering, part of this radiation ultimately leaves the object in all directions and constitutes so-called diffusely reflected light. 58 Thus, changes in diffuse reflection spectroscopy (DRS) result primarily from a combination of optical absorption and scattering, which allows valuable information to be obtained on the biochemical composition and microarchitecture of the medium.59,60 As is known, tumour growth depends on angiogenesis, which can lead to an increase in the haemoglobin concentration. Consequently, this alteration can increase the absorption coefficient and reduce the diffuse reflectance signal. 61 Moreover, in the progression to cancer, dysplasia can be represented as an increase in epithelial thickness, which gives rise to a reduced quantity of light into the deeper tissues and results in a decrease in tissue scattering and, consequently, the intensity of diffuse reflectance. 62 Currently, studies have incorporated DRS into current imaging modalities (e.g. magnetic resonance imaging, sonography) to improve the diagnostic performance. 63 The derivations of diffuse optics, such as diffuse optical tomography (DOT) and the time gated scanning diffuse optical imaging (DOI) method, also enhance the sensitivity to absorbing targets. 64
Autofluorescence
When fluorescent molecules absorb light energy in a specific wavelength, they are activated from the ground state to an excited singlet state and then return to their ground energy state by releasing energy that generates fluorescent light. 65 The signal amplitude and spectral shape depend strictly on the concentration, excitation wavelength, light scattering and absorption properties of the fluorescent molecules.66,67 On the basis of the material source, fluorescent molecules can be either endogenous or exogenous fluorophores. Autofluorescence (AF) is a natural fluorescence of the organisms that differs from the ‘induced fluorescence’ that is obtained by the introduction of an exogenous fluorochrome. 68 Compared with induced fluorescence, AF has aroused widespread concern because of its convenience and biosecurity.
Neoplasia can cause oxidation of nicotinamide adenine dinucleotide (NADH) that yields decreased AF intensity. 69 The angiogenesis in tumour is able to lead the difference of absorption effect of haemoglobin and therefore influence the spectral characteristics of the measured fluorescence. 70 A number of biological fluorophores, such as flavin adenine dinucleotide (FAD), tryptophan, collagen, elastin and endogenous porphyrin, can give rise to fluorescence signals.71–73 Thus, the fluorescence signals characterize changes in endogenous fluorophores related to the physiological state on the occurrence of a pathological process. 74 The logistic models constructed with 30 or 40 of the most important AF spectra selected by principal component analysis (PCA) could clearly differentiated between colorectal carcinoma and normal tissues with AUROCs of 0.88 and 0.91, respectively. 75 However, there are still some limitations to be addressed when applying AF to guide the clinical diagnosis of digestive tract tumours, such as the weak intensity of tumour AF, 76 unsatisfactory specificity with inflammation and hyperplasia. 77 To improve AF applications, a combination with DRS and narrow band image (NBI) is often used in tissue analysis.78,79
In vivo OS based on endoscopy
Early detection followed by the adequate treatment of precancerous/premalignant lesions with the potential to progress to invasive cancer is a critical factor in the prognosis of patients with GIC. However, the performance of early detecting dysplasia and malignancy remains poor when using conventional white-light reflectance (WLR) imaging. Recent advancement of enhancement technologies has led to efficient evolutions in endoscopic images. Magnification endoscopy equipped with a system of movable lenses enables the size and visible details of mucosa to be magnified up to 150 times. 80 NBI via a narrow-bandwidth filter allows penetration at peak wavelengths of 415 (blue) and 540 (green) nm, which highlights the superficial mucosal vasculature.81,82 However, these advances heavily rely on visual information of gross morphologic changes and not on biochemical or molecular analysis, resulting in poor ability for an early diagnosis. 83
Currently, endoscopic biopsy is the standard criterion for the clinical localization and diagnosis of GICs. However, a single biopsy from the worst-appearing area is associated with sampling errors and demands for doctors with abundant clinical experiences.50,83 Furthermore, multiple-biopsy protocols can maximize disease ascertainment but at the same time bring a great deal of discomfort to patients. 84 Along with successful spectroscopic outcomes, the combination of spectroscopy and an endoscopic system achieved dramatic results in real time and objective diagnosis of malignant and premalignant gastrointestinal lesions with high specificity.
OS diagnosis based on tissues
Histopathology is the gold standard for cancer diagnosis, but it is invasive and prone to interobserver variability.85,86 The kappa values between two pathologists ranged from 0.59 to 0.69 in tumour pathological diagnosis.87–89 OS is able to permit non-invasive and objective analysis of biochemical and subcellular alterations of tissues, and the results are well correlated with histopathology. In the diagnosis of dysplasia in Barrett’s oesophagus (BE), a high level of agreement (kappa value 0.89) was observed between spectral data and consensus opinion of pathology. 90 Good correlation between DR spectroscopy and histopathology was also observed in the classification of intestinal ischemic-reperfusion injuries (r = 0.91). 91 Moreover, OS offers the facility of analysis in vivo and targeting biopsy, which can assist in making a real-time decision during endoscopic operations. Hence, an enticing application of OS is to help distinguish malignant tissues from benign ones.
Oesophageal cancer
Oesophageal cancer is the sixth leading cause of cancer-related mortality and has 5-year survival rates of 15%–25%. 92 With delayed symptoms, the disorder is frequently diagnosed at an advanced stage. To improve the outcomes, it is important to diagnose oesophageal cancer in the early stages. There is increasing evidence that OS is a powerful technique in the early diagnosis of cancer. Ishigaki et al. 93 performed an ex vivo Raman spectroscopy analysis in early-stage (stages 0 and I) oesophageal cancer tissues and obtained a discriminative sensitivity of 81.0% and a specificity of 94.0% between cancerous and normal samples.
BE is considered to be a precursor lesion to oesophageal adenocarcinoma. 94 It is thought to evolve through low-grade dysplasia (LGD), high-grade dysplasia (HGD) and adenocarcinoma. 95 Patients with BE carry a risk of adenocarcinoma 30–40 times greater than those without this condition. 96 In particular, the annual risk of malignant progression in BE patients with HGD is higher than nondysplastic BE (5%–20% vs 0.12%–0.5%). 97 Detection of dysplasia and early neoplasia in the setting of BE can potentially improve patient outcomes and prevent progression to invasive malignancy. 98 In an ex vivo study of 673 samples of BE (acquired from 62 patients), endoscopic Raman spectroscopy demonstrated a sensitivity of 86% and a specificity of 88% for distinguishing advanced neoplasia (HGD/adenocarcinoma) from LGD, nondysplastic BE and normal squamous oesophagus tissue. 99
BE tissues with various conditions show different optical physiological characteristics which are valuable for discriminant diagnosis. Bergholt et al. 100 utilized confocal Raman spectroscopy to detect BE in vivo and recorded a series of peaks that reflected expression levels of different substances (proteins, lipids and porphyrins) in columnar-lined epithelium (CLE) and nondysplastic BE and HGD BE, by which they obtained a sensitivity of 87% (67/77) and specificity of 84.7% (610/720) for detecting HGD in BE and AUROCs of 0.88, 0.84 and 0.90 for the discriminations of CLE versus nondysplastic and HGD BE, nondysplastic BE versus CLE and HGD BE and HGD BE versus CLE and nondysplastic BE, and the suspicious BE according to this technique was also confirmed by subsequent biopsy and histopathology.
GC
GC is the fifth most common cancer worldwide, 101 with an estimated new cases of 951,000 (6.8% of the total) and 745,000 deaths (9.1% of the total) in 2012. The survival rate mainly depends on GC stages; 102 therefore, detection in the early stage is vitally important in ensuring an excellent prognosis.
The carcinogenesis of GC is a multistep process that is largely initiated from infection with Helicobacter pylori (H. pylori), and it is progressively involved in the transformation from intestinal metaplasia (IM) to dysplasia before the onset of neoplastic transformation. 103 Accurate screening for early detection in high-risk pathological lesions is crucial to reducing mortality. Teh et al. 104 assessed the capability of NIR Raman spectroscopy for early diagnosis of H. pylori infection and IM lesions and found that the PCA–linear discriminant analysis (LDA) diagnostic algorithms were able to identify normal mucosa with a sensitivity of 91.7% and a specificity of 80.0%, H. pylori infection with a sensitivity of 80.0% and a specificity of 100% and IM with a sensitivity of 80.0% and a specificity of 92.7%. Huang et al. 105 acquired significant differences between normal and dysplastic gastric tissues within 0.5 s under the PCA-LDA algorithm and yielded a diagnostic sensitivity of 94.4% (17/18) and a specificity of 96.3% (52/54).
Some gastric ulcers are ulcerated gastric carcinomas; therefore, differentiating malignant from benign ulcers is quite important. Gastric ulcers have different optical physiological characteristics from gastric adenocarcinoma. Li et al. 106 measured the DR spectra of four types of stomach tissues (normal mucosa, chronic gastric ulcer, poorly differentiated and undifferentiated gastric adenocarcinomas) under wavelengths ranging from 400 to 650 nm and found that malignant tissues showed an increase in optical absorption at the HbO2 band (DR spectral intensity: undifferentiated adenocarcinoma < differentiated adenocarcinomas < gastric ulcer < normal mucosa) with concomitant significant decrease in the DR ratio of R540/R575. Bergholt et al. 107 assessed the diagnostic potential of Raman endoscopy for in vivo discrimination of benign and malignant gastric ulcers. They used a partial least-square discriminant algorithm (PLS-DA) to analyse a total of 1102 Raman spectra from 71 patients, with a sensitivity of 90.8% and a specificity of 93.8% for identifying normal mucosa, 84.7% and 94.5% for identifying benign ulcers and 82.1% and 95.3% for identifying malignant ulcerous lesions.
CRC
In recent years, many published articles have reported the application of OS for the detection of CRC. Compared with normal tissues, malignant colorectal tissues in FTIR analysis showed increased bands at positions of 1460 cm−1 (related to lipid), 3260 cm−1 (related to nitrogen-containing compounds and water), 1640 and 1550 cm−1 (amide groups related to protein) and 1080 cm−1 (related to nucleic acid) and decreased peaks at positions of 2925, 1400 and 1740 cm−1 (related to lipid) and 1160 cm−1 (related to carbohydrate), 108 by which a diagnostic sensitivity of 96.6% was gained via Fisher’s discriminant analysis (FDA). With the integration of NIR AF and NIR DRS, normal and malignant colonic tissues were successfully classified with a high diagnostic accuracy of 95.8%. 109
CRCs are usually adenocarcinomas, and more than 70% of them occur from the transformation of adenomatous polyps.110,111 Therefore, the early detection and removal of colorectal adenomas can effectively prevent CRC. Considerable efforts of colonoscopy in the field have been spent on optimizing the yield of polyp detection. Rodriguez-Diaz et al. 112 successfully applied elastic-scattering spectroscopy to the real-time classification of polyps as neoplastic or non-neoplastic lesions with a sensitivity of 91.5%, specificity of 92.2% and accuracy of 91.9%. In particular, a high-confidence rate of approximately 90% was associated with accuracies of 90.6% for polyps smaller than 1 cm and 90.1% for polyps equal to or smaller than 5 mm. Inelastic-scattering spectroscopy provides a diagnostic sensitivity of 90.9% and a specificity of 83.3% for differentiating adenoma from hyperplastic polyps. 113 Another endoscopic method based on laser-induced AF spectroscopy has been considered as a complimentary technique for the real-time prediction of polyp histology.114–116
OS diagnosis based on biofluids
Detection of biomarkers in biomedical fluids is the well-known and widely accepted laboratory test for tumour diagnosis. However, traditional tumour markers, such as carcinoembryonic antigen (CEA), CA19-9 and CA12-5, are not recommended for diagnosing oesophagus and stomach cancers due to their low sensitivities, and emerging biomarkers need more extensive validation.117,118 OS can provide comprehensive information of a liquid sample, which is reasonable for diagnosis and coincided with the recent trend that combination of multiple bio-markers instead of single one for improving diagnostic performance. 119
Blood
Peripheral blood samples are an ideal material for minimally invasive diagnosis, which can be performed expediently and repeatedly, and continuous sampling and testing are suitable for monitoring high-risk subjects. 120 A variety of studies have been conducted to evaluate the diagnostic performance of OS techniques in blood samples. Lualdi et al. 121 found that a blood fluorescence emission peak around 615–635 nm significantly differed between 172 patients with CRC and 169 health donors, with an AUROC of 0.724. Multivariate analysis of the IR spectral characterization of peripheral blood mononuclear cells (PBMCs) and plasma principal components yielded a sensitivity of 81.5% and a specificity of 71.4% for distinguishing patients with CRC from healthy individuals, and when comparing CRC with the healthy population and patients with dysplastic adenomatous polyps, a sensitivity of 85% and a specificity of 60.8% were obtained. 122
Due to the advantages of weak water scattering, Raman spectroscopy analysis of blood has been applied for separating cancerous samples from normal ones on a finer scale. Li et al. 123 achieved a sensitivity of 94.4%, specificity of 100% and accuracy of 97.7% for the differentiation of oesophageal cancer (n = 36) and normal blood plasma (n = 50). Feng et al. 124 achieved a sensitivity of 100% and a specificity of 97% for non-invasive GC detection. Lin et al. 125 confirmed the capability of SERS for CRC detection, with a diagnostic sensitivity of 97.4% and a specificity of 100%.
The potential application of SERS for the early detection of cancer-related serum-constituents is of greatest concern. Ito et al. 126 compared the SERS peak heights of blood samples among patients with GC, CRC or benign diseases and found that the SERS peak heights of samples from patients with stage II–IV GC, stage II–IIIa CRC or stage IIIb–IV CRC were significantly higher than those from patients with benign diseases. A significant difference also existed between stage I and advanced GC. The peak heights of SERS spectra from patients with benign diseases were lower than those from patients with stage I GC, although no statistically significant differences (p = 0.068) were observed. These results indicated that SERS spectra intensified with progression of the disease. Feng et al. 127 explored the use of SERS-based blood plasma analysis for the early detection of precancerous lesions and found that the diagnostic sensitivity and specificity for differentiating polyp samples were 71.4% and 95.6% from CRC and 91.3% and 80% from normal subjects.
SERS detection is prone to interference from any constituent changes in the blood due to its high sensitivity. 128 To further improve this blood test, several reports demonstrated that SERS spectra of the purified serum proteins helped determine the magnitude of the SERS enhancement due to the elimination of other native plasma constituents and exogenous substances.128,129 Serum albumin and globulin from CRC patients (n = 103) and healthy volunteers (n = 103) were analysed, and the diagnostic performance was evaluated by the algorithms combined with PCA or PLS and LDA. 129 The various models showed different diagnostic sensitivities and specificities: 100% and 100% for an albumin PCA model, 100% and 99% for a globulin PCA model, 95.6% and 91.3% for an albumin PLS model and 91.3% and 95.6% for a globulin PLS model. Similarly, using a purification procedure, SERS detection had a sensitivity and specificity of 100% for differentiating GC patients from healthy volunteers. 128
The levels of circulating nucleic acids are frequently associated with tumour development and have been proposed to be a liquid biopsy for the detection and monitoring of cancers.130,131 Recently, SERS as a label-free tool for the ultrasensitive detection of RNA/DNA with the ability to detect a single base change has generated tremendous interest.132–134 It has been shown that silver nanoparticles can be used as an excellent SERS-active substrate for detecting serum RNA in several investigations. The sensitivity and specificity of serum RNA SERS spectra were 100% and 94.1% for identifying GC (n = 31) from healthy volunteers (n = 34) 135 and 89.1% and 95.6% detecting CRC (n = 55) from normal controls (n = 45). 136
It has been confirmed that the efficient discrimination of circulating tumour cells (CTCs) is expected to provide valuable information for tumour diagnosis, prognosis, recurrence and metastasis. 137 An integrated approach based on magnetic trapping and SERS imaging has been reported for CTC detection and enumeration. Sun et al. 138 synthesized biotin-labelled aptamers specific to DLD-1 cells (a colorectal adenocarcinoma cell line) and subsequently conjugated them to magnetic beads via the biotin–streptavidin interaction to develop a capture system for CTCs, which identified CTCs readily and accurately with a SERS imaging technique. Shi et al. 139 used magnetic scattering nanoparticles (MNPs) decorated with folate (its receptor is overexpressed in many cancer cells) to target cancer cells and found that an increasing SERS signal was detected from the cells targeted by both SERS NPs and MNPs; this system was able to effectively trap cells within a large flow velocity range (0.2 to 12 cm s−1).
Gastric juice
The feasibility of detecting GC in gastric juice has been investigated. Zhou et al. 140 demonstrated that the first peak of intrinsic fluorescence intensity (P1FI) in gastric juice was able to detect GC from benign gastric diseases with a sensitivity of 83.2%, specificity of 80.7% and accuracy of 82.0%, and it was also valuable for the diagnosis of early GC, with a sensitivity of 69.7%, specificity of 57.1% and accuracy of 63.2%. 141 Furthermore, measuring the fluorescence intensity of gastric juice by mass spectra offers the possibility of detecting fluorescence biomarkers. 142 Three aromatic amino acids in gastric juice could correctly predict gastric malignancies with AUROCs of 0.838, 0.856 and 0.816 for tyrosine, phenylalanine and tryptophan, respectively. Additional work is required to clarify the reasons for the changes in the fluorescence emission spectrum, and its diagnostic performance should be further validated in future studies.
Limitations and prospects
So far, OS techniques have not been conventionally used for clinical diagnosis. There are two obstacles to the clinical translation of the techniques: (1) Intrinsic limitations of OS. For example, conventional Raman spectroscopy suffers from weak signals and strong background AF. (2) Diagnostic validation of OS. For instance, it is difficult to compare the results from different research groups due to the variability of instruments, measurement protocols and procedures for data analysis.
Each spectroscopic technique suffers from certain drawbacks. The depth of penetration of IR radiation depends on the wavelength. MIR can only examine the penetration depth of ~10 µm through tissue, but NIR penetrates to great depths in the range of millimeter–centimeter. 143 In Raman spectroscopy, excitation of light can be UV, visible or NIR; therefore, different tissue types and samples require optimization of excitation wavelengths. 7 The biggest drawback of SERS is the introduction of metal into the measurement system, the variation of which in size and structure may result in a large variability of the SERS spectrum. 144 The point monitoring of DR spectroscopy is time-consuming for screening a larger area.145,146
Related studies involve different analytical techniques and methods, which makes it difficult to comprehensively assess the diagnostic value of a technology. For example, the diagnostic performance of AF spectroscopy is still controversial. Some studies have indicated that the detection rate of neoplasms was not significantly different between AF imaging and WL systems,147,148 and some studies showed that AF endoscopy slightly elevated sensitivity for the detection of neoplasia, but its clinical value is limited probably due to over-diagnosis in regenerative hyperplasia, intestinal metaplasia, ulcerations or inflammation observations.149,150 Therefore, there is a need for more investigations on reliability for large-scale applications.
The integrated Raman and NIR AF endoscopy method holds great promise for enhancing in vivo gastric tissue diagnosis and characterization, 151 with an AUROC of 0.985 for diagnosing GC, which is superior to either the Raman or NIR AF alone. In addition, the combination of multiple excitation wavelengths can augment the available information. Liu et al. 152 used 337, 375, 405 and 460 nm as excitation wavelengths to characterize the AF of fresh colon tissues and found that under 337 nm excitation, the AF spectrum provided more diagnostic information for recognizing neoplastic changes, and compared with single excitation, the combination of feature extractions of four excitation wavelengths by multispectral data analysis improved the specificity (91.4% vs 80.0%) and classification accuracy (90.3% vs 83.9%) while maintaining the same sensitivity (88.9%). Therefore, future studies may focus on an OS combination to overcome the limitations of any single one.
Technical development over the past decades has resulted in large and overlapping datasets that increase the difficulty of interpretation. Currently, to reduce the dimensionality of such datasets, many dimension reduction methods have been developed for this purpose. PCA is one of the most common and popular linear dimension reduction approaches that use an orthogonal transformation to convert a larger set of possibly correlated variables into a smaller set of uncorrelated variables with minimal loss of information.153,154 However, many high-dimensional data in real-world applications may lie on a low-dimensional nonlinear manifold. 155 Recently, there have been some renewed interests on the algorithms for constructing nonlinear low-dimensional manifolds, such as ant colony optimization (ACO), KNN, CART, RF, supervised neighbourhood preserving embedding (SNPE) and support vector machine (SVM).23,156–158
In summary, biomedical OS, including IR spectroscopy, Raman spectroscopy, diffuse scattering spectroscopy and AF, is capable of providing structural and chemical information about biological specimens with the advantages of non-destruction, non-invasion, reagent-free and waste-free analysis and has thus been widely investigated for the diagnosis of oesophageal, gastric and colorectal neoplasms. OS detected in situ via endoscopy is valuable for the early identification of premalignant and malignant lesions, and the OS of blood, particularly its components, is valuable in the diagnosis of GICs. OS techniques have their individual characteristics in cancer diagnosis (Table 1), and the multi-technical approach is a tendency to make more efficient diagnosis. During the investigation, innovative modalities for data analysis have been developed to reduce the dimensionality of spectroscopic datasets, and the combination of multiple spectral signals via mathematical models becomes a frequent method for the diagnostic application of spectral data because a single signal is usually not enough for highly sensitive and specific diagnoses. Incorporating different OS techniques with other biological techniques, such as nanotechnology, can effectively overcome their drawbacks alone. However, it is difficult to compare the results from different research groups due to the variability of instruments, measurement protocols and procedures for data analysis. It is expected that standardization in this field will occur, which is necessary for translating these approaches into routine clinical diagnoses.
Characteristics of various optical spectroscopy techniques in diagnosis.
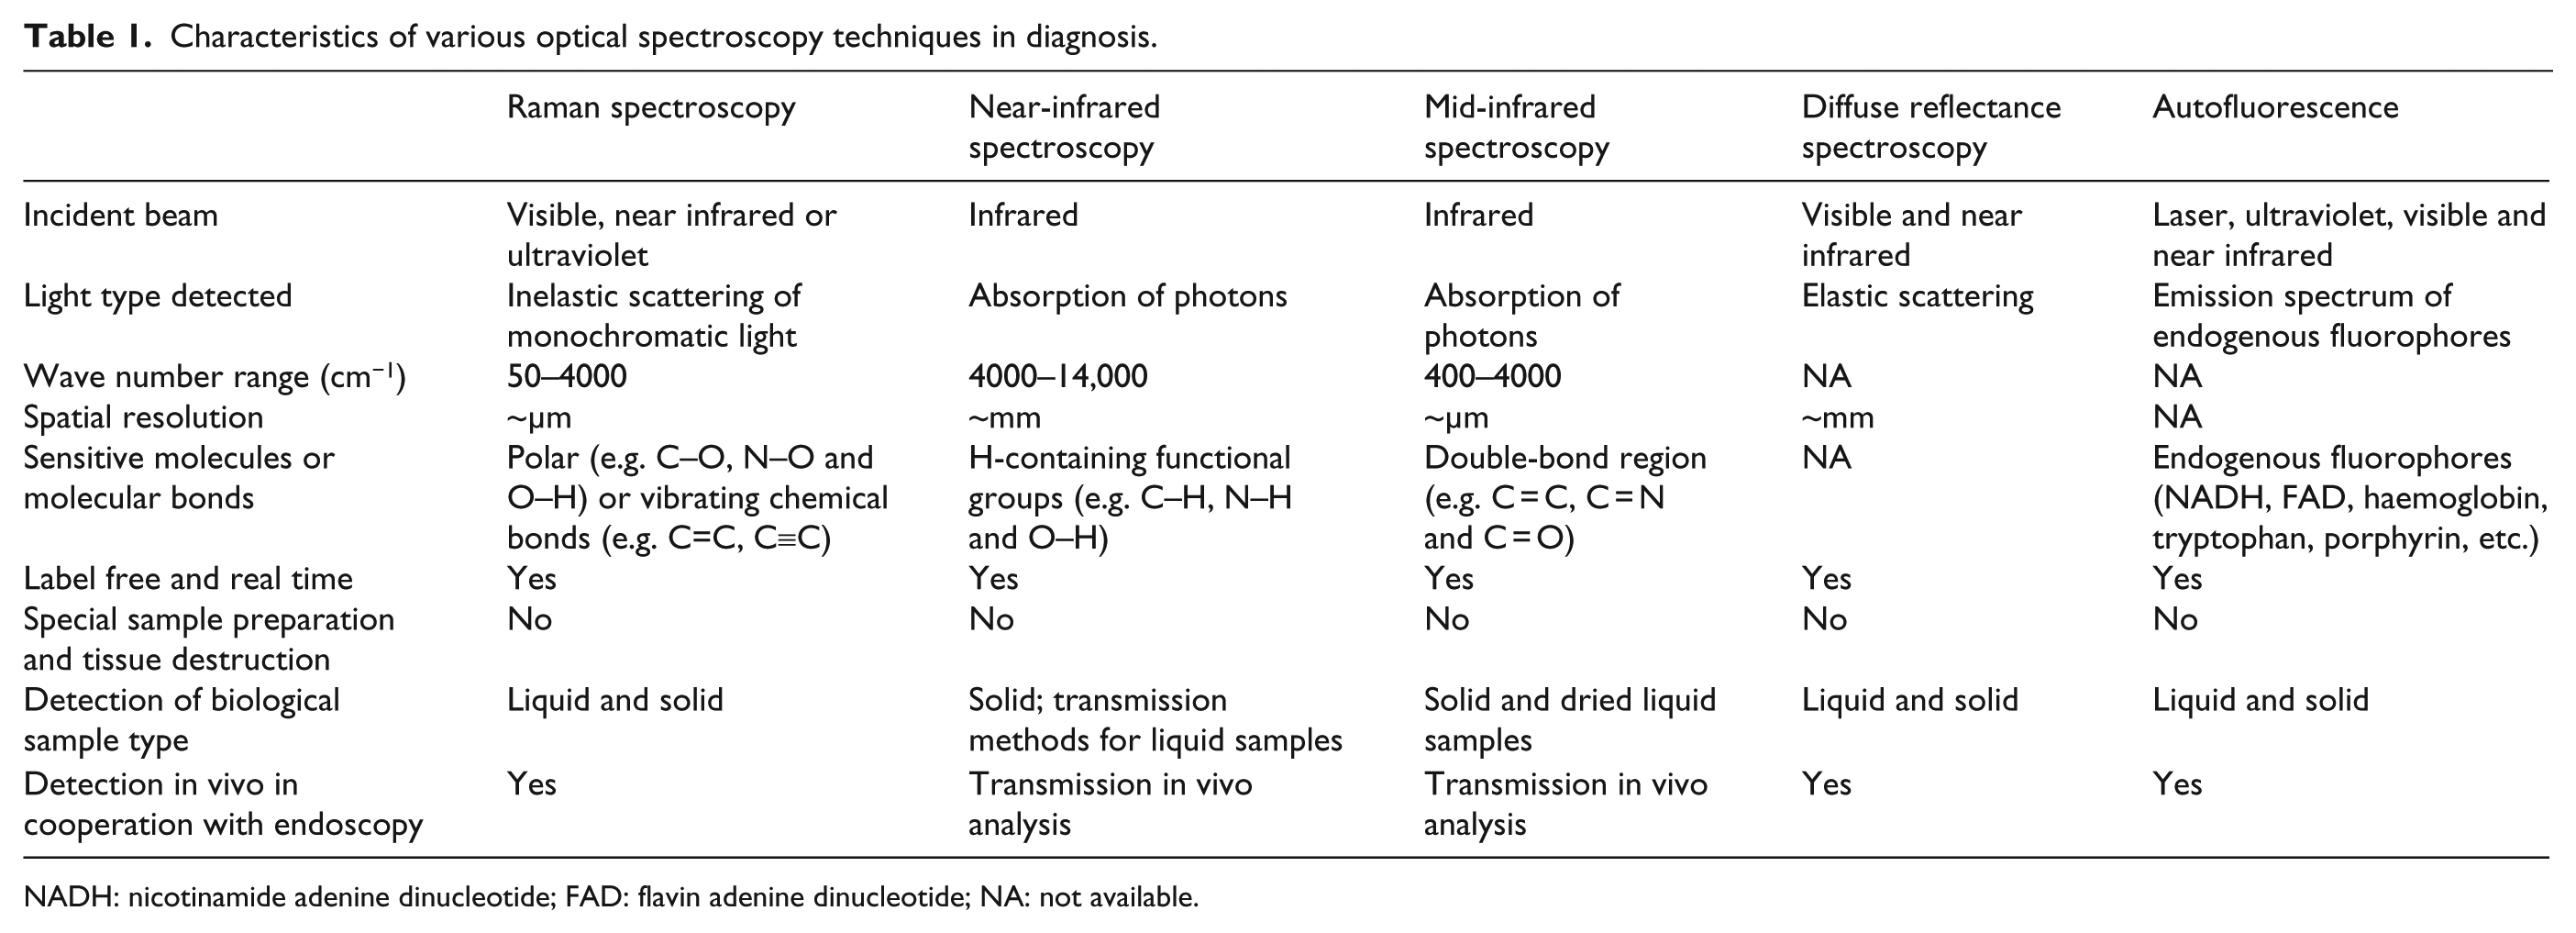
NADH: nicotinamide adenine dinucleotide; FAD: flavin adenine dinucleotide; NA: not available.
Footnotes
Acknowledgements
Q.-S.W. prepared the article and T.W. and K.-H.Z. reviewed and provided beneficial comments and discussions.
Declaration of conflicting interests
The author(s) declared no potential conflicts of interest with respect to the research, authorship, and/or publication of this article.
Funding
The author(s) disclosed receipt of the following financial support for the research, authorship, and/or publication of this article: This study was supported by National Natural Science Foundation of China (No. 81560479) and Science and Technology Project of the Education Department of Jiangxi Province (No. KJLD13014).