
Abstract
Colon adenocarcinoma is the third leading cause of cancer-related deaths across the world, developing novel and non-invasive diagnostic and prognostic biomarkers for the early-stage colon adenocarcinoma at molecular level is essential. In our study, RNA-sequencing was performed to identify the differentially expressed genes and miRNAs (DEmiRNAs) in early-stage colon adenocarcinoma compared to tissues of precancerous lesions, colonic intraepithelial neoplasia. The DEmiRNA-target interaction network was constructed and functional annotation of targets of DEmiRNAs was performed. The Cancer Genome Atlas was used to verify the expression of selected differentially expressed genes. The receiver operating characteristic analyses of selected differentially expressed genes was performed. In total, 865 differentially expressed genes, 26 DEmiRNAs, and 329 DEmiRNA-target pairs were obtained. Based on the early-stage colon adenocarcinoma network, miR-548c-5p, miR-548i, and miR-548am-5p were the top three DEmiRNAs that covered most differentially expressed genes. NTRK2, DTNA, and BTG2 were the top three differentially expressed genes regulated by most DEmiRNAs. Cancer and colorectal cancer pathways were two significantly enriched pathways in early-stage colon adenocarcinoma. The common differentially expressed genes in both the pathways were AXIN2, Smad2, Smad4, PIK3R1, and BCL2. The expression levels of eight differentially expressed genes (NTRK2, DTNA, BTG2, COL11A1, Smad2, Smad4, PIK3R1, and BCL2) in The Cancer Genome Atlas database were compatible with our RNA-sequencing. All these eight differentially expressed genes and AXIN2 had the potential diagnosis value for Colon adenocarcinoma. In conclusion, a total of ten differentially expressed genes (NTRK2, DTNA, BTG2, COLCA1, COL11A1, AXIN2, Smad2, Smad4, PIK3R1, and BCL2) and four DEmiRNAs (miR-548c-5p, miR-548i, mir-424-5p, and miR-548am-5p) may be involved in the pathogenesis of early-stage colon adenocarcinoma which may make a contribution for developing new diagnostic and therapeutic strategies for early-stage colon adenocarcinoma.
Keywords
Introduction
As the most frequent subtype of colon cancer, colon adenocarcinoma (COAD) is the third leading cause of cancer-related deaths across the world. 1 Although the current diagnostic and therapeutic strategies for COAD have been well established, some patients benefit little, and the COAD-related mortality remains increased.1,2 Since early detection of colorectal cancer is correlated with a higher 5-year survival rate, it is crucial to diagnose colon cancer in the early stage. 3 COAD is a multi-factorial disease. Lifestyle, genetic, and epigenetic alterations are associated with COAD. 2 Developing novel and non-invasive diagnostic and prognostic biomarkers for the early-stage COAD at molecular level is essential.
At present, the known genetic alterations were not enough to fully explain the pathogenesis of COAD, and COAD-specific biomarkers remain scanty. Identification of key genes in early-stage COAD is needed. As a class of endogenous, small non-coding RNAs, microRNAs (miRNAs) have been indicated to be involved in COAD as well. 1 MiRNAs not only can act as oncogenes and tumor suppressors directly4,5 but also play a role in COAD by regulating the expression of their targeting genes.6,7 Hence, identifying the key miRNAs in early-stage COAD is also crucial. With advanced high-throughput technology, both RNA-sequencing and microarray analysis can be used to identify differentially expressed genes (DEGs) and miRNAs (DEmiRNAs).
In this study, RNA-sequencing was performed to identify DEGs and DEmiRNAs in early-stage COAD compared to tissues of precancerous lesions, colonic intraepithelial neoplasia. The early-stage COAD-specific DEmiRNA-target network was constructed and functional annotation was performed. Hopefully, our study can identify key miRNAs and genes and pathways in early-stage COAD and make contribution to developing novel biomarkers for early-stage COAD.
Materials and methods
Patients
In total, three patients with early-stage COAD and three patients with colonic intraepithelial neoplasia were enrolled in our study. The three serous tissue samples of COAD (case 1–3) from three patients with early-stage COAD and three mucosal tissue samples of colonic intraepithelial neoplasia (control 1–3) from three patients with colonic intraepithelial neoplasia were biopsy samples obtained from surgery (case 2) or colonoscopy (case1, case 3, and control 1–3). All the patients were diagnosed based on the pathological analyses of biopsy samples from surgery (case 2) or colonoscopy (case1, case 3, and control 1–3). The detailed characteristics of patients are displayed in Table 1. All the participants submitted the signed informed consents, and the protocol was approved by the ethical committee of our hospital.
Patient characteristics.

TNM: tumor–node–metastasis.
RNA isolation and sequencing
Total RNA was isolated from samples using a TRIzol reagent (Invitrogen, Carlsbad, CA, USA). By using a Nanodrop ND-2000 spectrophotometer (Thermo Fisher Scientific, Wilmington, DE, USA), we checked the concentration and purity of RNA (quantity >5 µg and concentration ≥200 ng/µL). The 1.5% agarose gel electrophoresis was performed to check the integrity of RNA. The RNA integrity number (RIN) value (RIN > 7) was obtained by an Agilent 2100 Bioanalyzer (Agilent, Palo Alto, CA, USA). We purified messenger RNA (mRNA) by oligo-d(T) probes for polyA selection. Purified mRNA was fragmented into size of 200 bp by TruSeq RNA Library Preparation Kit (Illumina, San Diego, CA, USA). The complementary DNA (cDNA) was generated. After purification by Qiaquick PCR Purification Kit, end repair and adapter ligation were performed. Then, we performed gel purification (2% TAE (Tris base, acetic acid, and ethylenediaminetetraacetic acid (EDTA)) to isolate 300 nt fragments. The mRNA library was constructed by QIAquick PCR Purification Kit. The 18–30 nt RNA was obtained from the total RNA. Adapter ligation was performed and reverse transcription polymerase chain reaction (PCR) was performed to obtain the cDNA by TruseqTM Small RNA Sample Prep Kit. Sequencing was performed by A HiSeqTM 2500 platform (Illumina).
Quality control of raw sequence
By using base-calling, the raw image data of mRNAs and miRNAs derived from high-throughput RNA-sequencing was translated into raw FASTQ sequence data. Then, we performed the quality control of FASTQ data (Read QC) by using FastQC v0.11.4. By using cutadapt v1.9.1, we removed low-quality sequences (adapter sequences, sequences with a quality score <20, and sequences with N base rate of raw reads >10%) from sequencing data of mRNAs and miRNAs to obtain the high-quality clean data.
Identification of DEGs in early-stage COAD compared to colonic intraepithelial neoplasia
Based on Genome human UCSC (University of California, Santa Cruz) reference annotation, the alignment between the cleaned mRNA sequencing reads was aligned to the human genome (GRCh38.p7 assembly) via TopHat (http://tophat.cbcb.umd.edu/). Using Cufflinks (http://cufflinks.cbcb.umd.edu/), we processed fragment assembly and relative expression of the reads with the normalized RNA-sequencing fragment counts. We used fragments per kilobase of exon per million mapped reads (FPKM) to determine the transcription abundance of mRNAs. FPKM of each reads was calculated by Cuffdiff (http://cufflinks.cbcb.umd.edu/). Paired t tests were performed to test the expression between early-stage COAD and colonic intraepithelial neoplasia. Then, we performed multiple comparisons using the Benjamini and Hochberg’s method to obtain the false discovery rate (FDR). DEGs in early-stage COAD compared to colonic intraepithelial neoplasia were identified with FDR <0.05. The heatmap of top 100 DEGs in early-stage COAD was obtained by a heatmap tool (heatmap.2) in the gplots package within the statistical program R 3.1.2.
Identification of DEmiRNAs in early-stage COAD compared to colonic intraepithelial neoplasia
Based on Genome human UCSC reference annotation, the alignment between the cleaned miRNA sequencing reads was aligned to the human genome (GRCh38.p7 assembly) via Bowtie (bowtie-bio.sourceforge.net). miRDeep2 (https://www.mdc-berlin.de/8551903/en/) was used to determine the transcription abundance of miRNAs. Based on the read count of each sample, the DEmiRNAs in early-stage COAD compared to colonic intraepithelial neoplasia were calculated via an R-bioconductor package, DESeq2 (http://bioconductor.org/packages/DEGseq/). For DEmiRNAs in early-stage COAD compared to colonic intraepithelial neoplasia, the threshold was defined as p value <0.05. The heatmap of DEmiRNAs in early-stage COAD was obtained by a heatmap tool (heatmap.2) in the gplots package within the statistical program R 3.1.2.
DEmiRNA-target DEG analysis
Since miRNAs contribute to downregulating the expression of their target genes in post-transcription, the DEGs whose expression was inverse with corresponding DEmiRNAs were selected as putative targets of DEmiRNAs. Moreover, these putative targets of DEmiRNAs were checked by six bioinformatics algorithms (RNA22, miRanda, miRDB, miRWalk, PICTAR2, and Targetscan) which predicted the putative target genes of DEmiRNAs as well. These targets recorded by more than four algorithms were selected. Verified targets of DEmiRNAs obtained by miRWalk (http://www.umm.uni-heidelberg.de/apps/zmf/mirwalk/) were selected as well. Based on these DEmiRNA-target pairs, we constructed the early-stage COAD-specific DEmiRNA-target interaction network by Cytoscape software (http://www.cytoscape.org/).
Functional annotation of DEmiRNA targets
To further research the biological function of the target DEGs of DEmiRNAs, we performed Gene ontology (GO) and Kyoto Encyclopedia of Genes and Genomes (KEGG) pathway analysis using the online software GeneCodis (http://genecodis.cnb.csic.es/analysis). FDR < 0.05 was defined as the criteria of statistical significance.
Validating the expression of DEmiRNA targets by The Cancer Genome Atlas
The Cancer Genome Atlas (TCGA; https://tcga-data.nci.nih.gov/tcga/) is a public-funded project which consists of multi-dimensional data of for multiple cancers at DNA, RNA, and protein levels. The mRNA profile of 285 COAD cases and 41 adjacent non-tumor controls was derived from the TCGA illuminahiseq_rnaseqv2 data obtained by high-throughput RNA-sequencing from TCGA. We employed the TCGA illuminahiseq_rnaseqv2 data to validate the expression of selected targeted DEGs of DEmiRNAs. We compared the expression levels of selected targeted DEGs between COAD cases and adjacent non-tumor controls, and the difference of expression levels was displayed by box plots.
Receiver operating characteristic analyses
By using pROC package in R language, we performed the receiver operating characteristic (ROC) analyses to assess the diagnostic value of DEmiRNA targets. The area under the curve (AUC) under binomial exact confidence interval was calculated and ROC curve was generated.
Results
DEGs and DEmiRNAs in early-stage COAD
A total of 865 DEGs (229 downregulated and 636 upregulated genes) were obtained. A total of 26 DEmiR1NAs (12 downregulated and 14 upregulated genes) were obtained. The heapmaps of top 100 DEGs and DEmiRNAs are displayed in Figures 1 and 2, respectively. The top 20 DEGs and DEmiRNAs are displayed in Tables 2 and 3, respectively.

The heatmap of top 100 DEGs in early-stage COAD. Row and column represented DEGs and tissue samples. The color scale represented the expression levels of DEGs. Red and green color represented upregulation and downregulation in early-stage COAD, respectively.

The heatmap of DEmiRNAs in early-stage COAD. Row and column represented DEmiRNAs and tissue samples. The color scale represented the expression levels of DEmiRNAs. Red and green color represented upregulation and downregulation in early-stage COAD, respectively.
The top 20 DEGs in early-stage COAD.
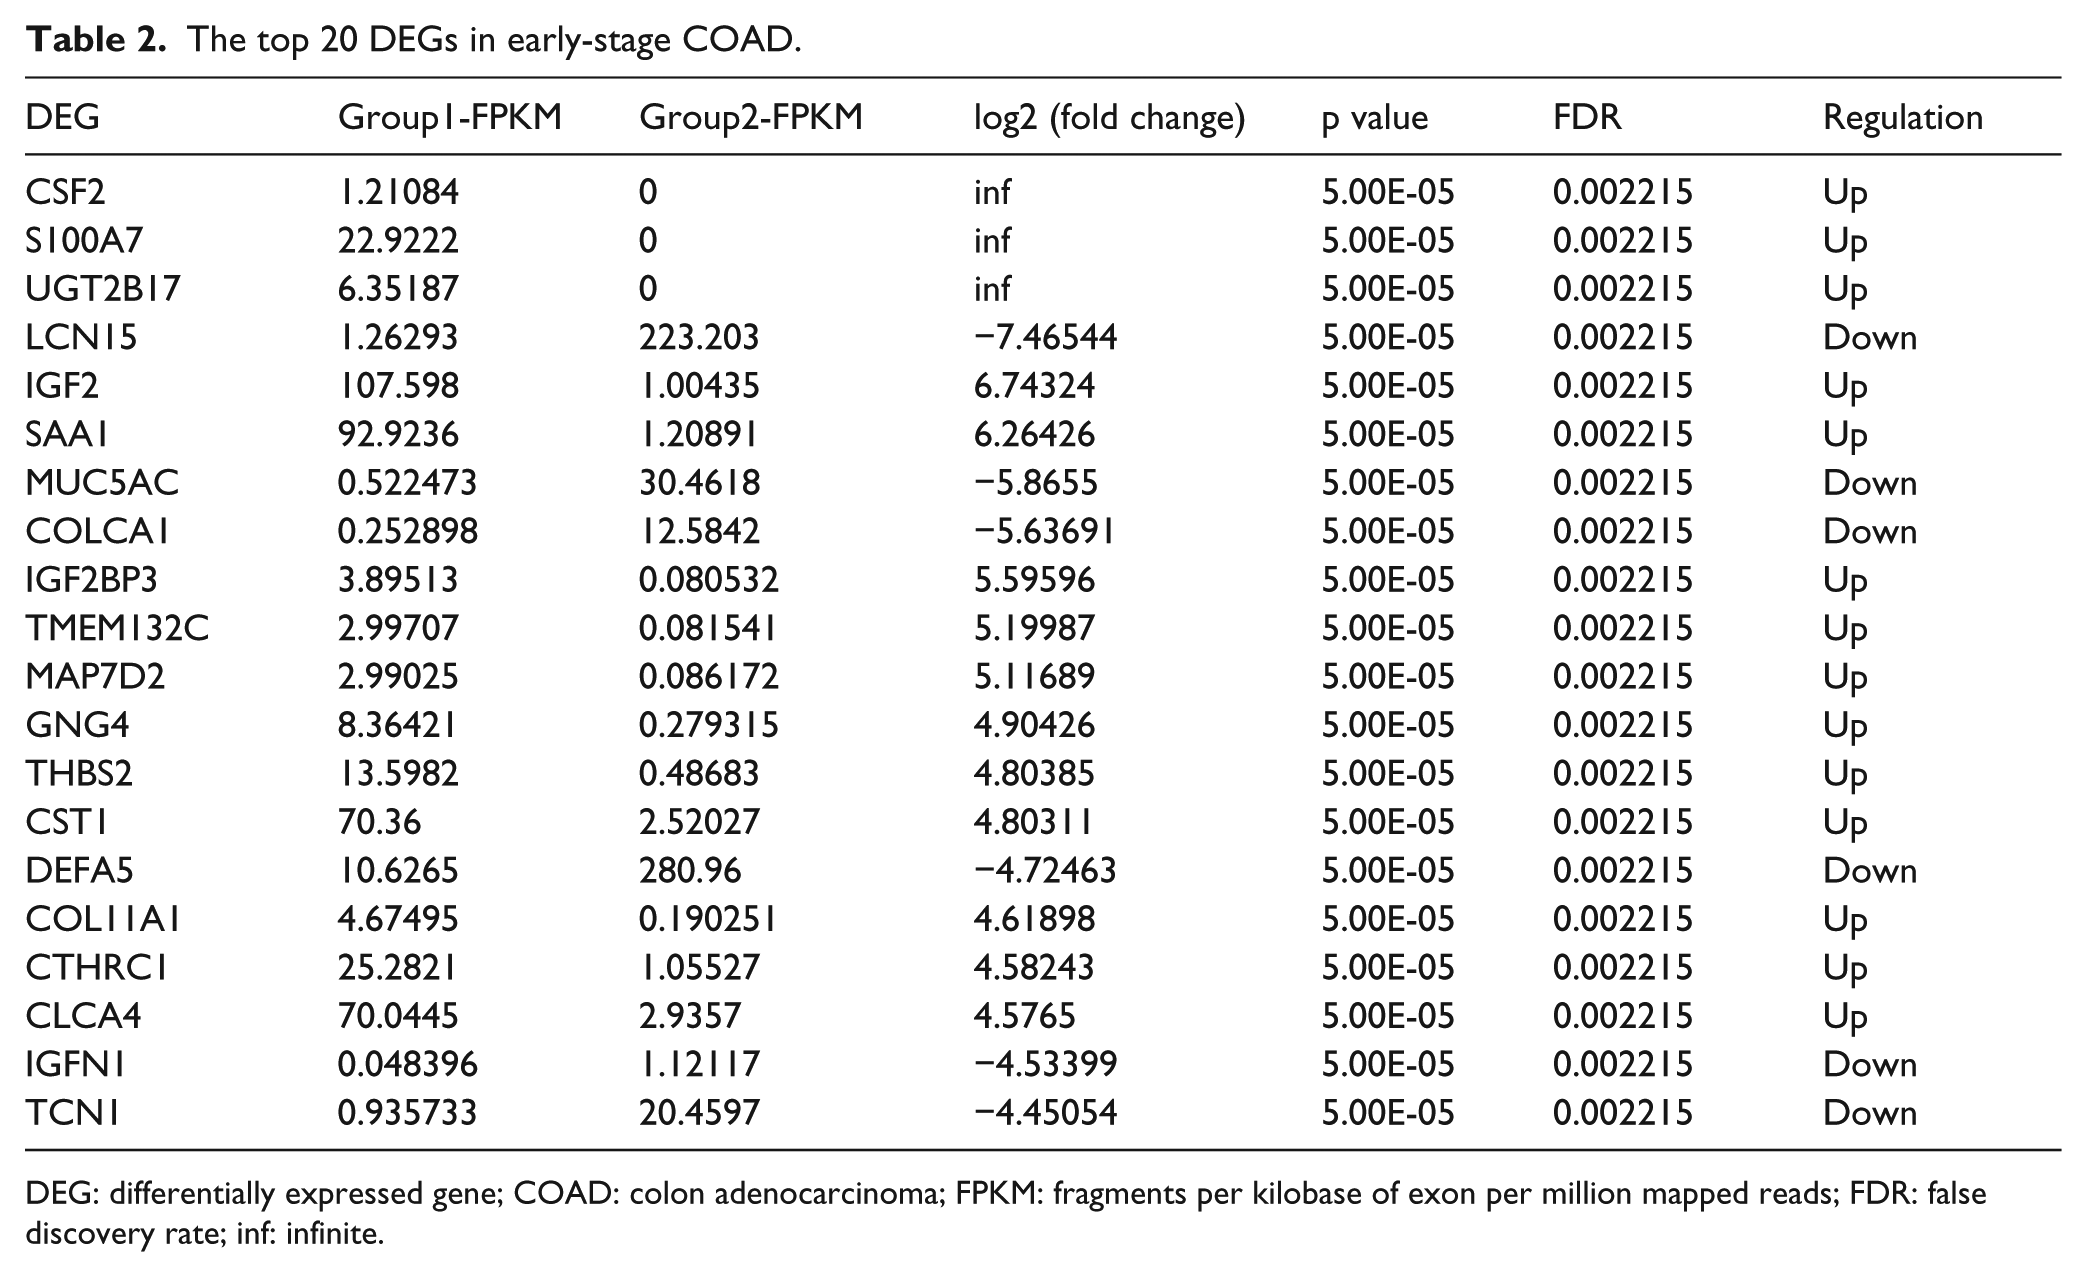
DEG: differentially expressed gene; COAD: colon adenocarcinoma; FPKM: fragments per kilobase of exon per million mapped reads; FDR: false discovery rate; inf: infinite.
DEmiRNAs in early-stage COAD.

COAD: colon adenocarcinoma; lfcSE: log fold change standard error; Stat: wald statistic.
DEmiRNA-target interactions
A total of 329 DEmiRNA-target pairs including 79 upregulated miRNA-downregulated target pairs and 218 downregulated miRNA-upregulated target pairs were obtained. Among which, there were 32 DEmiRNA-target pairs that have been confirmed by miRWalk. Based on the early-stage COAD-specific DEmiRNA-target interaction network (Figure 3), miR-548c-5p (degree = 72), miR-548i (degree = 67), and miR-548am-5p (degree = 49) were the top three DEmiRNAs that covered most DEGs. NTRK2 (neurotrophic tyrosine kinase receptor type 2), DTNA (degree = 9), and BTG2 (degree = 8) were the top three DEGs regulated by most DEmiRNAs. The degree of NTRK2, DTNA, and BTG2 was 9, 9, and 8, respectively. All these three DEGs and three DEmiRNAs were downregulated in early-stage COAD based on our sequencing data.

Early-stage COAD-specific DEmiRNA-target interaction network. The early-stage COAD-specific DEmiRNA-target interaction network consisted of 227 nodes and 501 edges. Ellipses and triangles were used to represent the DEGs and DEmiRNAs in early-stage COAD, respectively. Ellipses and triangles with black border were DEGs and DEmiRNAs derived from the top 20 DEGs and DEmiRNAs in early-stage COAD. Red and blue colors were used to represent upregulation and downregulation in early-stage COAD, respectively. The green edges were used to represent the DEmiRNA-target pairs verified by miRWalk.
Functional annotation of DEmiRNA targets
Based on the GO enrichment analysis (Figure 4), response to organic cyclic compound (FDR = 1.42e-07), response to hypoxia (FDR = 1.59e-07), protein binding (FDR = 9.72e-12), extracellular matrix structural constituent (FDR = 6.55e-08), cytoplasm (FDR = 4.01e-12), and plasma membrane (FDR = 2.69e-12) were the most significantly enriched GO terms in early-stage COAD. Pathways in cancer (FDR = 1.92e-05) and colorectal cancer (FDR = 0.000803746) were two significantly enriched pathways in early-stage COAD (Figure 4). The common DEGs in both the pathways were AXIN2, Smad2, Smad4, PIK3R1, and BCL2. All these five common DEGs were downregulated in early-stage COAD based on our sequencing data.

The top 20 most significantly enriched GO terms and KEGG pathways of DEGs in early-stage COAD. (a) The top 20 most significantly enriched GO terms of biological process in early-stage COAD. The x-axis shows −log FDR and y-axis shows the terms of biological process. (b) The top 20 most significantly enriched GO terms of cellular component in early-stage COAD. The x-axis shows −log FDR and y-axis shows the terms of cellular component. (c) The top 20 most significantly enriched GO terms of molecular function in early-stage COAD. The x-axis shows −log FDR and y-axis shows the terms of molecular function. (d) The top 20 most significantly enriched KEGG pathways in early-stage COAD. The x-axis shows −log FDR and y-axis shows the KEGG pathways.
Validation the expression of DEmiRNA targets by TCGA
We obtained the mRNA expression profile of 285 COAD tissues (case group) and 41 adjacent non-tumor tissues (normal group). Based on our sequencing data, nine downregulated DEGs (NTRK2, DTNA, BTG2, COLCA1, AXIN2, Smad2, Smad4, PIK3R1, and BCL2) and an upregulated DEG (COLL11A1) in early-stage COAD were selected to perform the expression validation by TCGA illuminahiseq_rnaseqv2 data (Figure 5). According to these 10 DEGs, the expression data of COLCA1 was not found in TCGA illuminahiseq_rnaseqv2 data. The different expression levels of other nine DEGs between COAD and non-tumor tissues were analyzed and depicted through box plots. These box plots were displayed by median and inter-quartile range visually. The expression levels of seven DEGs including NTRK2, DTNA, BTG2, Smad2, Smad4, PIK3R1, and BCL2 (Figure 5(a)–5(c) and (f)–(i)) were significantly downregulated in case group compared to normal group, while the expression level of COL11A1 (Figure 5(d)) was significantly upregulated in case group compared to normal group. Compared to normal group, the expression levels of these eight DEGs in case group were consistent with our RNA sequencing data. AXIN2 (Figure 5(e)) was significantly upregulated in case group compared to normal group which was inconsistent with our RNA sequencing data.
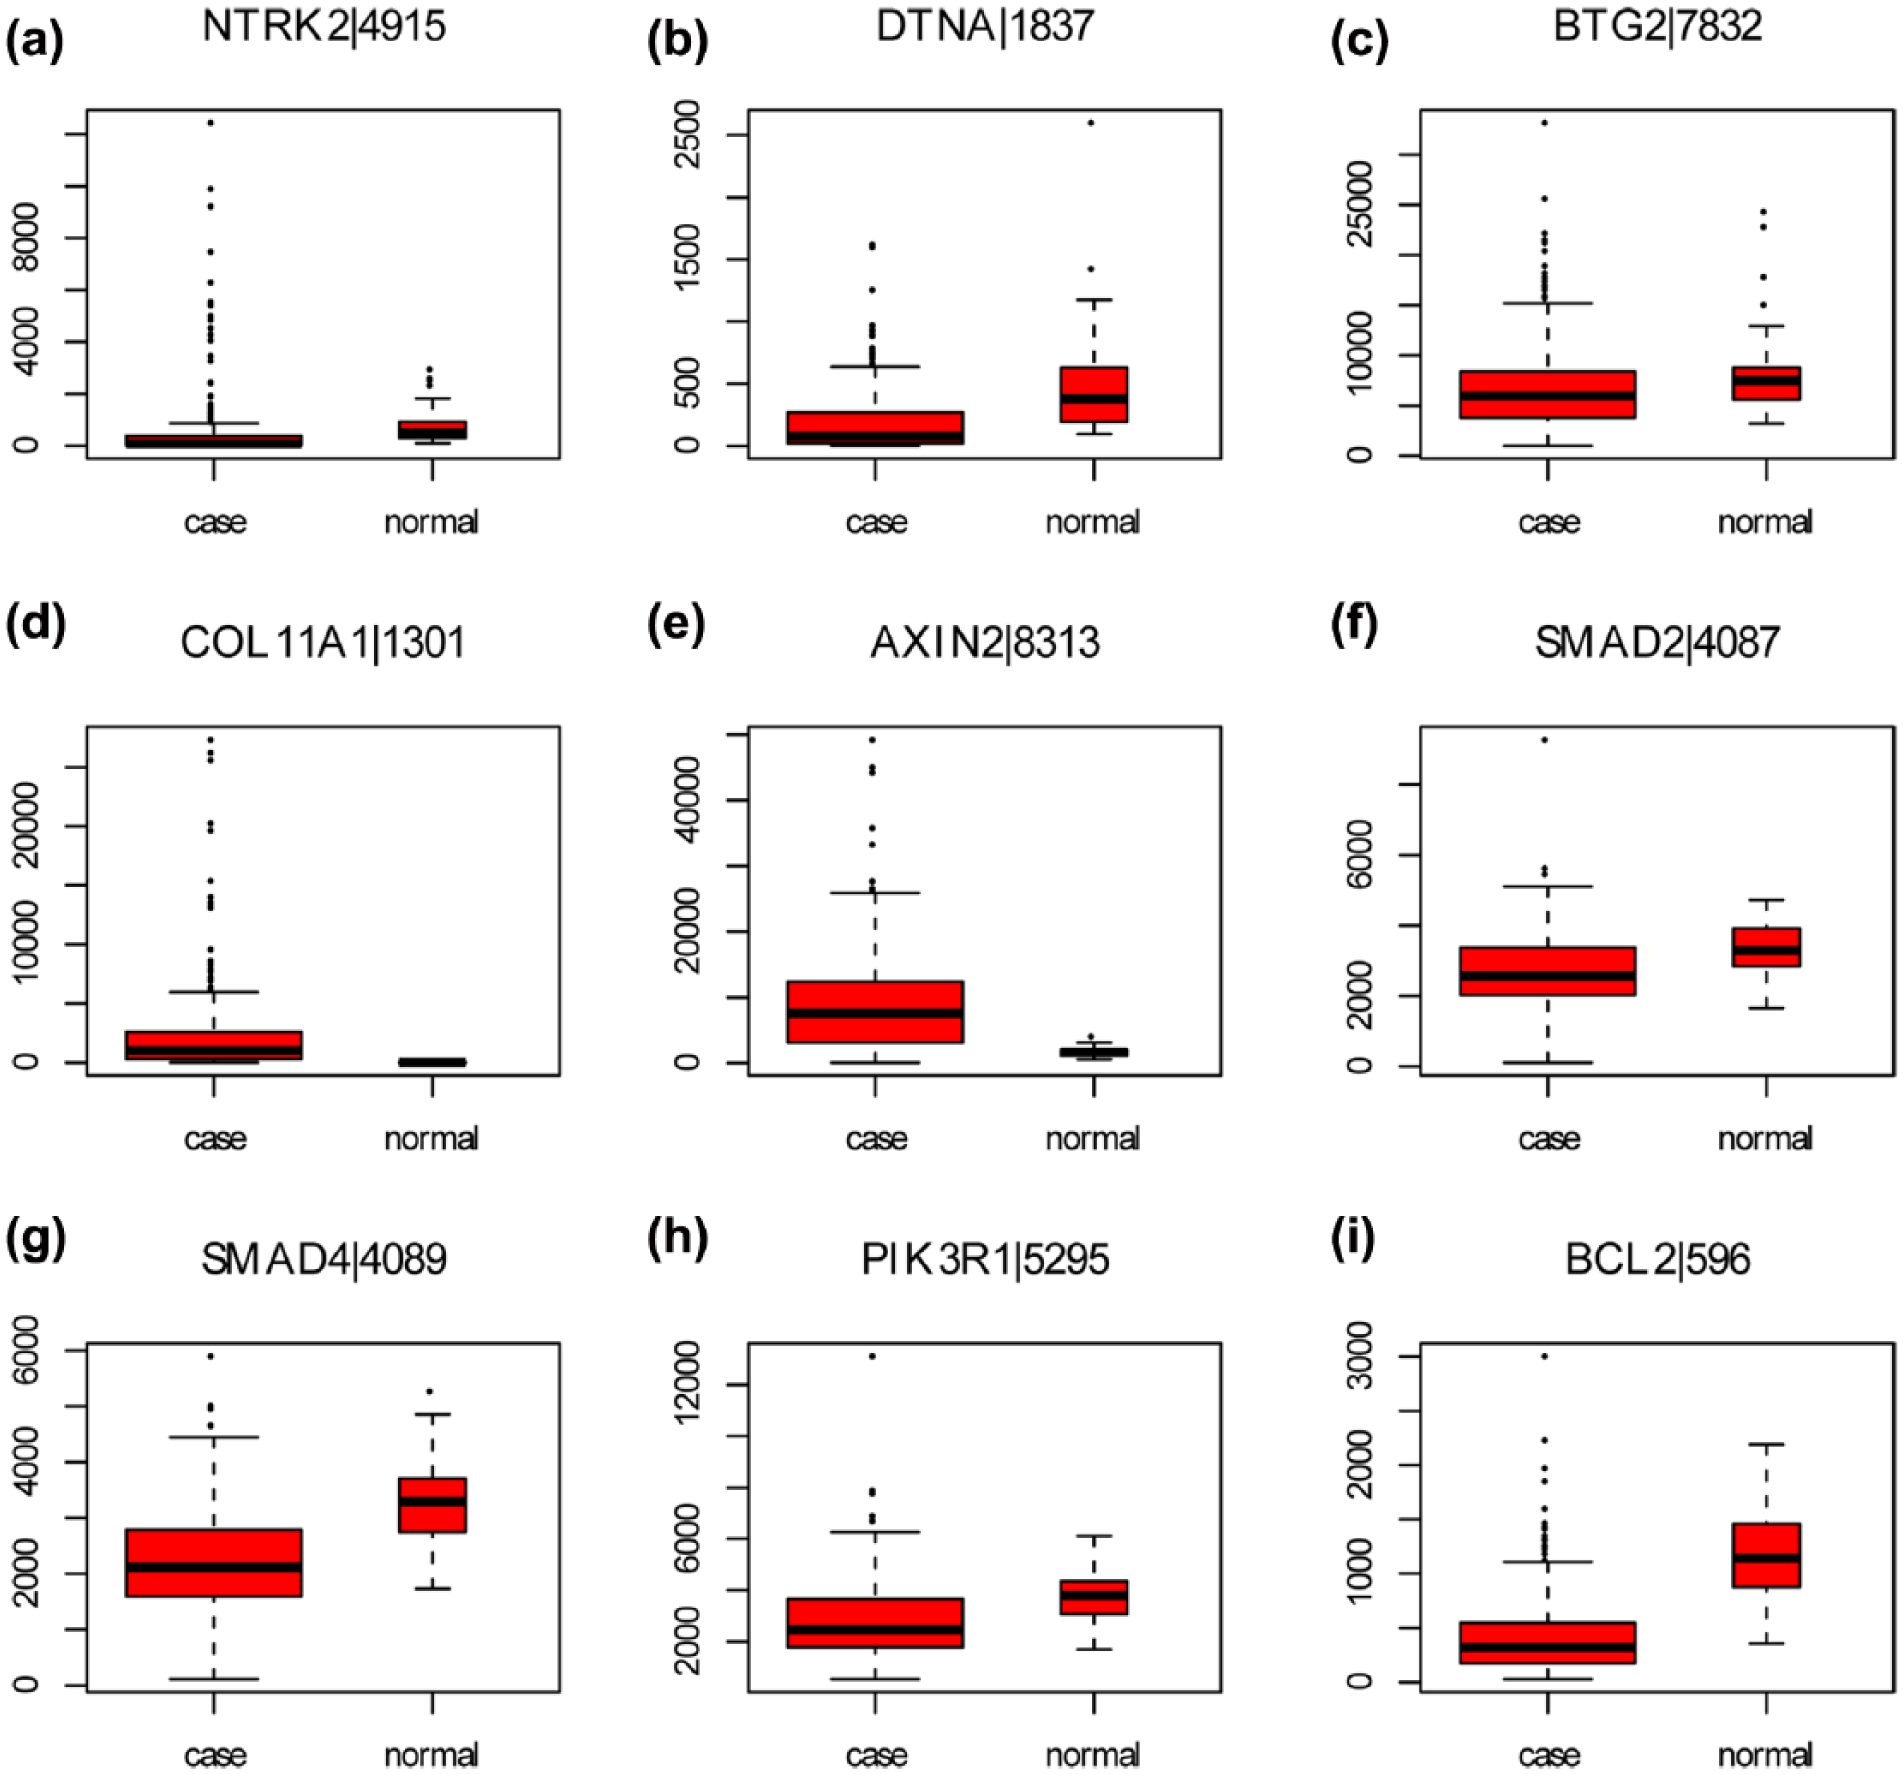
The validation of the expression levels of selected DEGs in COAD based on TCGA database. The x-axis shows case and normal groups and y-axis shows expression reads counts: (a) NTRK2, (b) DTNA, (c) BTG2, (d) COL11A1, (e) AXIN2, (f) Smad2, (g) Smad4, (h) PIK3R1, and (i) BCL2. Case group and normal group indicated COAD tissues and adjacent non-tumor tissues.
ROC curve analysis
We performed ROC curve analyses and calculated the AUC to assess the discriminatory ability of these nine DEGs among 285 COAD tissues and 41 adjacent non-tumor tissues derived from TCGA. The AUC of eight DEGs including NTRK2 (0.784), DTNA (0.807), COL11A1 (0.989), AXIN2 (0.863), Smad2 (0.707), Smad4 (0.823), PIK3R1 (0.702), and BCL2 (0.923) was more than 0.7 (Figure 6(a), (b), (d)–(i)). Only the AUC of BTG2 (0.626) was less than 0.7 (Figure 6(c)). COL11A1, BCL2, and AXIN2 had the largest AUC among these nine DEGs. For COAD diagnosis, the sensitivity (proportion of true positive) and 1 − specificity (proportion of false positive) of COLCA1 were 97.5% and 97.6%, respectively (Figure 6(d)); the sensitivity and 1 − specificity of BCL2 were 84.2% and 94.7%, respectively (Figure 6(i)); the sensitivity and 1 − specificity of AXIN2 were 81.1% and 92.7%, respectively (Figure 6(e)).

The ROC curves of selected DEGs between early-stage COAD patients and healthy controls. The ROC curves were used to show the diagnostic ability of these selected DEGs with sensitivity (the proportion of true positive) and 1 − specificity (the proportion of false positive). The x-axis shows 1 − specificity and y-axis shows sensitivity: (a) NTRK2, (b) DTNA, (c) BTG2, (d) COL11A1, (e) AXIN2, (f) Smad2, (g) Smad4, (h) PIK3R1, and (i) BCL2.
Discussion
COAD remains one of leading cause of death worldwide. To diagnose COAD in early stage will make contribution to reducing the COAD-related deaths. In our study, we identified several DEGs and DEmiRNAs in early-stage COAD which may provide clues for developing potential biomarkers for early-stage COAD.
Tyrosine kinase receptor B (TrkB) is the target receptor of brain-derived neurotrophic factor (BDNF) which is encoded by NTRK2. BDNF–TrkB was also mainly expressed in nervous system and other types of tissues including glandular cells of the salivary gland, small intestine, colon, endocrine pancreas, and so on. 8 Previous studies have indicated that the interaction between BDNF and TrkB plays a role in activation of adhesion, angiogenesis, apoptosis, and proliferation pathways. 9 Upregulated TrkB has been found in various cancers such as colorectal cancer, non–small cell lung cancer, and neuroblastoma where it served as an oncogene.10 –12 Moreover, upregulated TrkB was found to be closely associated with poor prognosis of patients with various cancers.10 –12 However, our study indicated that NTRK2 was significantly downregulated in early-stage COAD which was regulated by most DEmiRNAs. In addition, NTRK2 had a great diagnostic value for COAD based on our ROC analysis. NTRK2 may play a role in the pathogenesis of early-stage COAD, while the underlying mechanism needs further research.
Besides NTRK2, BTG2 and DTNA were other top two DEGs regulated by most DEmiRNAs. BTG2 is a member of TOB/BTG family which was indicated to be a potential tumor suppressor gene.13 –15 Suppression of BTG2 expression plays a role in tumor development, invasion, and metastasis of patients with lung cancer or breast cancer.13,15 However, increased BTG2 was reported to promote tumorigenesis in patients with bladder cancer. 16 Downregulated BTG2 was detected in COAD in our study. We speculated that the expression difference of BTG2 in various cancers may be due to the difference of tissues. BTG2 may involve in the pathogenesis of COAD, while the underlying mechanism needs further research. High levels of DTN2 were found in gastric adenocarcinoma and thus served as a negative prognostic biomarker. There is no previous study reported the correlation between DTN2 and COAD. Based on our study, DTNA was downregulated in COAD which had a great diagnostic value for COAD. The detailed function of DTNA in the pathogenesis of COAD needs to be further studied.
COL11A1 encodes the alpha 1 chain of type XI collagen, a minor fibrillar collagen. 17 Previous studies have indicated that COL11A1 was upregulated in various cancers including lung, ovary, pancreas, and colon cancer, thus it is closely associated with tumor progression and migration.18 –20 In our study, increased COL11A1 was also found in COAD, and COL11A1 had a great diagnostic value for COAD which provided evidence for the importance of COL11A1 in carcinoma progression.
COLCA1 encodes a transmembrane protein, which is expressed in granular organelles of various cells in the gastrointestinal microenvironment including eosinophils, mast cells, neutrophils, macrophages, and dendritic cells. 21 Previous studies have indicated that COLCA1 plays a role in inflammation and cancer. 22 Moreover, COLCA1 has been implicated as a susceptibility locus for colorectal cancer. 23 In our study, COLCA1 was significantly downregulated in COAD compared to colonic intraepithelial neoplasia which was a hub protein of DEmiRNA-target interaction network. We speculated that downregulated COLCA1 may be a crucial regulator of the pathogenesis of COAD, which may serve as a diagnostic and prognostic biomarker for patients with COAD.
Based on the KEGG pathway enrichment analysis, the DEGs of COAD were significantly enriched in cancer and colorectal cancer pathways. The common DEGs in both the pathways were AXIN2, Smad2, Smad4, PIK3R1, and BCL2. Increased AXIN2 has been demonstrated to be an early marker for malignant transformation of colorectal cancer. Based on our RNA-sequencing data, AXIN2 was downregulated in early-stage COAD. However, AXIN2 was upregulated in COAD according to the TCGA datasets. Further studies with larger sample size were needed. Both Smad2 and Smad4 are involved with transforming growth factor beta (TGF-β)/Smad signaling pathway and serve as two suppressor genes for colorectal cancer.24,25 PIK3RI suppresses tumor cell migration by reducing phosphoinositide 3-kinase (PI3K)/AKT pathway. Moreover, the cross-talk between PI3K/AKT and TGF-β/Smad signaling pathways promotes the malignant progression of cancers. In our study, the expression of Smad2, Smad4, and PIK3R1 in COAD was downregulated, which supported previous studies and emphasized the importance of these three DEGs in early-stage COAD. BCL2 is a well-known protein which prevents apoptosis in solid tumors. In our study, BCL2 was downregulated in early-stage COAD which suggested that BCL2 may be a regulator in early-stage COAD as well. It is worth noting that all these five DEGs (AXIN2, Smad2, Smad4, PIK3R1, and BCL2) had great diagnostic values for COAD which may serve as diagnostic biomarkers of COAD.
The miR-548 family is primate/human specific 26 and has been reported to play a role in cancer. 27 Multiple members of mir-548 family make a contribution to inhibit tumor cell growth. 27 The expression of miR-548 was significantly downregulated in lung tumors compared to adjacent normal tissues. 27 Previous studies have indicated that MiR-548c-5p served as a prognostic biomarker for triple-negative breast cancers. 28 MiR-548c-5p also served as a suppressor for primary liver cancer by regulating the proliferation, migration, and invasion of liver cancer cells. 29 In our study, miR-548c-5p is the most significantly downregulated DEmiRNA covering the most DEGs in COAD which supported previous studies. In addition, COL11A1 was a target of miR-548c-5p. We speculated that miR-548c-5p may be involved in COAD by targeting COL11A1. MiR-548i and miR-548am-5p were regulators of COL11A1 as well. These two DEmiRNAs were two of top 10 significantly downregulated miRNAs covering the most DEGs in early-stage COAD, which suggested that these two DEmiRNAs may be associated with COAD as well. However, more efforts are needed to elucidate them in an in-depth way.
Previous studies have reported that mir-424-5p is a key regulator in various cancers.30 –32 Mir-424-5p was indicated to be an anti-oncogene in cervical cancer by blocking cell growth. 30 Mir-424-5p also makes a contribution in preventing the proliferation, migration, and invasion in non–small cell lung cancer and esophageal squamous cells.31,32 Although there is no previous study reporting the association between mir-424-5p and COAD, our study indicated that mir-424-5p is a significantly upregulated miRNA in early-stage COAD. Moreover, mir-424-5p is a regulator of NTRK2, DTNA, PIK3R1, BCL2, and AXIN2 which suggested that mir-424-5p may play a key role in the process of COAD by regulating these DEGs.
In conclusion, ten DEGs (NTRK2, DTNA, BTG2, COLCA1, COL11A1, AXIN2, Smad2, Smad4, PIK3R1, and BCL2) and four DEmiRNAs (miR-548c-5p, miR-548i, mir-424-5p, and miR-548am-5p) may be involved in the pathogenesis of early-stage COAD which may make a contribution for developing new diagnostic and therapeutic strategies for early-stage COAD. However, the sample size for RNA-sequencing was small, which is a limitation of this study, so studies of larger sample size need to be conducted to confirm this conclusion.
Footnotes
Acknowledgements
J.L. and F.L. contributed equally to this study and share first authorship.
Declaration of conflicting interests
The author(s) declared no potential conflicts of interest with respect to the research, authorship, and/or publication of this article.
Funding
The author(s) disclosed receipt of the following financial support for the research, authorship, and/or publication of this article: This work was supported by the scientific and technological project of Qinghai Province (2015-ZJ-742).