
Abstract
Breast cancer has attracted substantial attention as one of the major cancers causing death in women. It is crucial to find potential biomarkers of prognostic value in breast cancer. In this study, the expression pattern of anterior gradient protein 2 in breast cancer was identified based on the main molecular subgroups. Through analysis of 69 samples from the Gene Expression Omnibus database, we found that anterior gradient protein 2 expression was significantly higher in non–triple-negative breast cancer tissues compared with normal tissues and triple-negative breast cancer tissues (p < 0.05). The data from a total of 622 patients from The Cancer Genome Atlas were analysed. The data from The Cancer Genome Atlas and results from quantitative reverse transcription polymerase chain reaction also verified the anterior gradient protein 2 expression pattern. Furthermore, we performed immunohistochemical analysis. The quantification results revealed that anterior gradient protein 2 is highly expressed in non–triple-negative breast cancer (grade 3 excluded) and grade 1 + 2 (triple-negative breast cancer excluded) tumours compared with normal tissues. Anterior gradient protein 2 was significantly highly expressed in non–triple-negative breast cancer (grade 3 excluded) and non–triple-negative breast cancer tissues compared with triple-negative breast cancer tissues (p < 0.01). In addition, anterior gradient protein 2 was significantly highly expressed in grade 1 + 2 (triple-negative breast cancer excluded) and grade 1 + 2 tissues compared with grade 3 tissues (p < 0.05). Analysis by Fisher’s exact test revealed that anterior gradient protein 2 expression was significantly associated with histologic type, histological grade, oestrogen status and progesterone status. Univariate analysis of clinicopathological variables showed that anterior gradient protein 2 expression, tumour size and lymph node status were significantly correlated with overall survival in patients with grade 1 and 2 tumours. Cox multivariate analysis revealed anterior gradient protein 2 as a putative independent indicator of unfavourable outcomes (p = 0.031). All these data clearly showed that anterior gradient protein 2 is highly expressed in breast cancer and can be regarded as a putative biomarker for breast cancer prognosis.
Introduction
As one of the leading causes of cancer-related death in women, breast cancer has become a major health burden worldwide. It was responsible for approximately 375,000 deaths in the year 2000.1,2 According to distinct transcriptomic features, breast cancer can be divided into three main subtypes, namely, luminal, basal-like and human epidermal growth factor receptor 2 (HER2)+. 3
Although substantial diagnostic and therapeutic improvements have been made in the treatment of breast cancer, molecular markers with prognostic and therapeutic significance are urgently needed.4,5 Triple-negative breast cancers (TNBCs) that lack the expression of oestrogen (ER), progesterone (PR) and HER2 receptors are more likely to be poorly differentiated and exhibit a higher histologic grade. 6 Therefore, the need of biomarkers for the treatment of TNBC is urgent. 7
Gene expression profiling will improve the currently used clinical parameters in the prediction of disease outcomes. 8 The main parameters defining treatment recommendations in early breast cancer are ER, PR and HER2. New genetic tests have emphasized the importance of proliferation-related genes. For example, Ki67 serves as prognostic and predictive marker in breast cancer. 9 Age, tumour size, status of lymph nodes, histologic type, pathological grade and hormone-receptor status are the dominating prognostic factors in breast cancer. 10 Furthermore, EZH2, 11 Fra-1, E-cadherin, BRCA1, 12 UK-PA, 13 β-catenin, 14 Kallikrein 5, tissue inhibitor of metalloproteinases 1, Ep-CAM, osteopontin, CD24 and SFRP1 4 are potential markers in breast cancer.
The human anterior gradient protein (AGR) family contains three members, namely, TXNDC12 (AGR1), AGR2, and AGR3. 15 The human homologue of anterior gradient protein 2 (AGR2) is a secretory protein that is highly expressed in adenocarcinomas, such as oesophagus, pancreas, breast and prostate cancers. It has been reported that the adenocarcinoma-related antigen AGR2 promotes tumour growth, cell migration and cellular transformation. 16 In a study of classification and prognosis of breast cancer based on gene expression profiles, it was shown that genes related to cell cycle, DNA replication and chromosomal stability were associated with poor prognosis. 17 By univariate analysis, Florian et al. found that patients with AGR2-positive tumours had significantly longer survival time. 4
In this study, we have identified the expression pattern of AGR2 in breast cancer subtypes based on microarray databases and The Cancer Genome Atlas (TCGA) patient samples. Moreover, quantitative reverse transcription polymerase chain reaction (qRT-PCR) was used to verify the expression of AGR2 in TNBC and non-TNBC tissues compared with that in normal breast tissues. Furthermore, tissue microarrays containing 30 normal breast tissues, 75 paracancer tissues and 146 breast cancer tissues were analysed by immunohistochemistry for the determination of the prognostic value of AGR2. The evidence suggests that AGR2 expression is closely correlated with breast cancer development. Thus, AGR2 might serve as a prognostic marker for breast cancer.
Materials and methods
Breast cancer tissue microarray
Microarray data were obtained from the Gene Expression Omnibus (GEO, https://www.ncbi.nlm.nih.gov/geo/). Database GDS3853 contained data on five normal breast tissues. Furthermore, GSE61724 contained data on 48 invasive ductal carcinomas (IDCs) from non-TNBC patients and 16 TNBC patients. A total of 69 samples were used for identifying the expression pattern of AGR2. Cluster analysis was performed with R/Bioconductor software. The microarray including 30 normal breast tissues, 75 paracancer tissues and 146 breast cancer tissues was obtained from Inner Mongolia University for Nationalities. All the patients provided written informed consent for the use of their tissue for research purposes. Data analysis was approved by Inner Mongolia University for Nationalities.
Analysis of TCGA data set
Raw Illumina HiSeq expression data and the corresponding clinical data from 622 samples were downloaded from TCGA (https://cancergenome.nih.gov/). Expression data for the samples were acquired with the Genomic Data Commons (GDC) Data Transfer Tool (https://gdc.cancer.gov/access-data/gdc-data-transfer-tool). Cluster analysis was performed with R/Bioconductor software.
qRT-PCR validation of AGR2 expression
Total RNA from eight cell lines was extracted with TRIzol reagent (Invitrogen, Carlsbad, CA, USA) according to the manufacturer’s instructions. Samples with A260/A280 nm ratio between 1.9 and 2.0 were used for further study. Then, complementary DNA (cDNA) was synthesized using 1 µg of total RNA. 18 First, RNA was maintained at 70°C for 10 min for heat denaturing. Then, reverse transcriptase, ribonuclease (RNase) inhibitor and oligo(dT)15 were mixed into the reaction system according to the instructions in the user manual. Primer Premier 5 was used to design the primers. qRT-PCR was performed using an ABI 7500 PCR system (Applied Biosystems, Life Technologies, Carlsbad, CA, USA) and SYBR Premix Ex Taq (Takara, Dalian, China) according to a previous publication. 19 The primer sequences are as follows: AGR2 forward: TGA CCA ACT CAT CTG GAC TCA GA and AGR2 reverse: CAT CAA GGG TTT GTT GCT TGT C; GAPDH forward: GCA CCG TCA AGG CTG AGA AC and AGR reverse: GGA TCT CGC TCC TGG AAG ATG.
Immunohistochemistry analysis
Immunohistochemistry for AGR2 was performed on the tissue microarray. Briefly, the tissue microarray was deparaffinized and rehydrated for 5 min. To block endogenous peroxidase activity, the slides were maintained in hydrogen peroxide for 20 min. Then, the tissue microarray was incubated with polyclonal rabbit anti-AGR2 antibody (1:1000; 12275-1-AP; Proteintech Group, Wuhan, China). After incubation with anti-goat antibodies, the slides were incubated with peroxidase-labelled streptavidin. 20 The tissue microarrays were scanned and analysed using CaseViewer (3DHISTECH Ltd, Budapest, Hungary). Finally, the assessment of the staining results was performed by a pathologist using a semi-quantitative method with a modified histochemical score (H-score) including the staining intensity (0, negative; 1+, weak; 2+, moderate; and 3+, strong) and percentage of stained cells. 21 The H-scores ranged from 0 to 300, and the optimal cut-off was 20 for high and low H-scores. 22
Statistical analysis
The microarray and RNA-Seq data analyses were conducted with R using the limma, survival, and cluster packages. 1 Statistical analysis was conducted with SPSS 20 software. Fisher’s exact test was used to determine the association of AGR2 expression with clinicopathological variables. p ≤ 0.05 indicated statistical significance. To estimate the prognostic outcomes of AGR2 expression, the univariate Kaplan–Meier (KM) survival method was applied with log-rank test. KM plotter (www.kmplot.com) was also used for survival analysis. 23 To verify the independence of AGR2 protein expression, a multivariate Cox regression analysis was conducted.
Results
The expression profile of AGR2 in breast cancer
To gain insight into the expression pattern of AGR2 in breast cancer, we studied 69 samples from the GEO database (Figure 1(a)). The results revealed that AGR2 expression was significantly higher in non-TNBC tissues than in TNBC and normal breast tissues (Figure 1(b)). The expression profile is shown as a heat map (Figure 1(c)). Furthermore, a cohort of 622 patients from TCGA was studied (Figure 1(d)). The data from cluster analysis of these patients are presented in Figure 1(f).

The expression pattern of AGR2 in breast cancer. (a) Histogram of 69 samples from the GEO database. (b) Box plot revealing the AGR2 expression pattern. (c) Heat map of 69 samples from the GEO database. (d) Box plot of patients from TCGA database. (e) qRT-PCR validation of AGR2 expression pattern. (f) Heat map of patients from TCGA database.
To identify the expression profile of AGR2, qRT-PCR was performed in seven cell lines containing one normal breast cell line (MDA-kb2 or Hs578Bst), three TNBC lines (MDA-MB-231, MDA-MB-435 and MDA-MB-468) and three non-TNBC lines (MCF-7, BT-474 and SK-BR-3). The qRT-PCR results from the expression pattern of AGR2 were consistent with the findings from the GEO and TCGA data sets (Figure 1(e)).
The immunohistochemistry of AGR2 in human breast cancer
Furthermore, we performed an immunohistochemical analysis of AGR2 protein level. AGR2 was mainly expressed in the cytoplasm of non-TNBC cells (Figure 2(c)). Only sporadic expression of AGR2 was observed in normal tissues (Figure 2(a) and (b)), whereas the staining for AGR2 protein was weak or absent in TNBC tissues (Figure 2(d)). AGR2 was highly expressed in breast cancer tissues compared with the paracancer tissues (Figure 2(e) and (f)).

Overexpression of AGR2 in breast cancer. (a) The staining results in normal breast tissues. (b) The staining results in normal breast tissue. (c) The staining results in non-TNBC tissues. (d) The staining results in TNBC tissues. (e) The staining results in non-TNBC tissues. (f) The staining results in paracancer tissues of patients included in Figure 2(e).
Comparison of quantification of AGR2 expression in normal, paracancer and breast cancer tissues
The results of immunohistochemical staining were quantified with H-scores. The results of quantification of AGR2 expression showed that the level of AGR2 was significantly higher in non-TNBC tissues (grade 3 excluded) compared with that in TNBC tissues (p < 0.01) (Figure 3(a)). The level of AGR2 was also significantly lower in TNBC tissues compared with that in normal tissues (p < 0.05) (Figure 3(a)). AGR2 expression was significantly higher in non-TNBC tissues (grade 3 excluded) compared with normal tissues (p < 0.05) (Figure 3(a)). When comparing AGR2 expression between paracancer and breast cancer tissues, AGR2 expression was found to be significantly high in non-TNBC tissues and low in TNBC tissues compared with the paracancer tissues (Figure 3(b)).
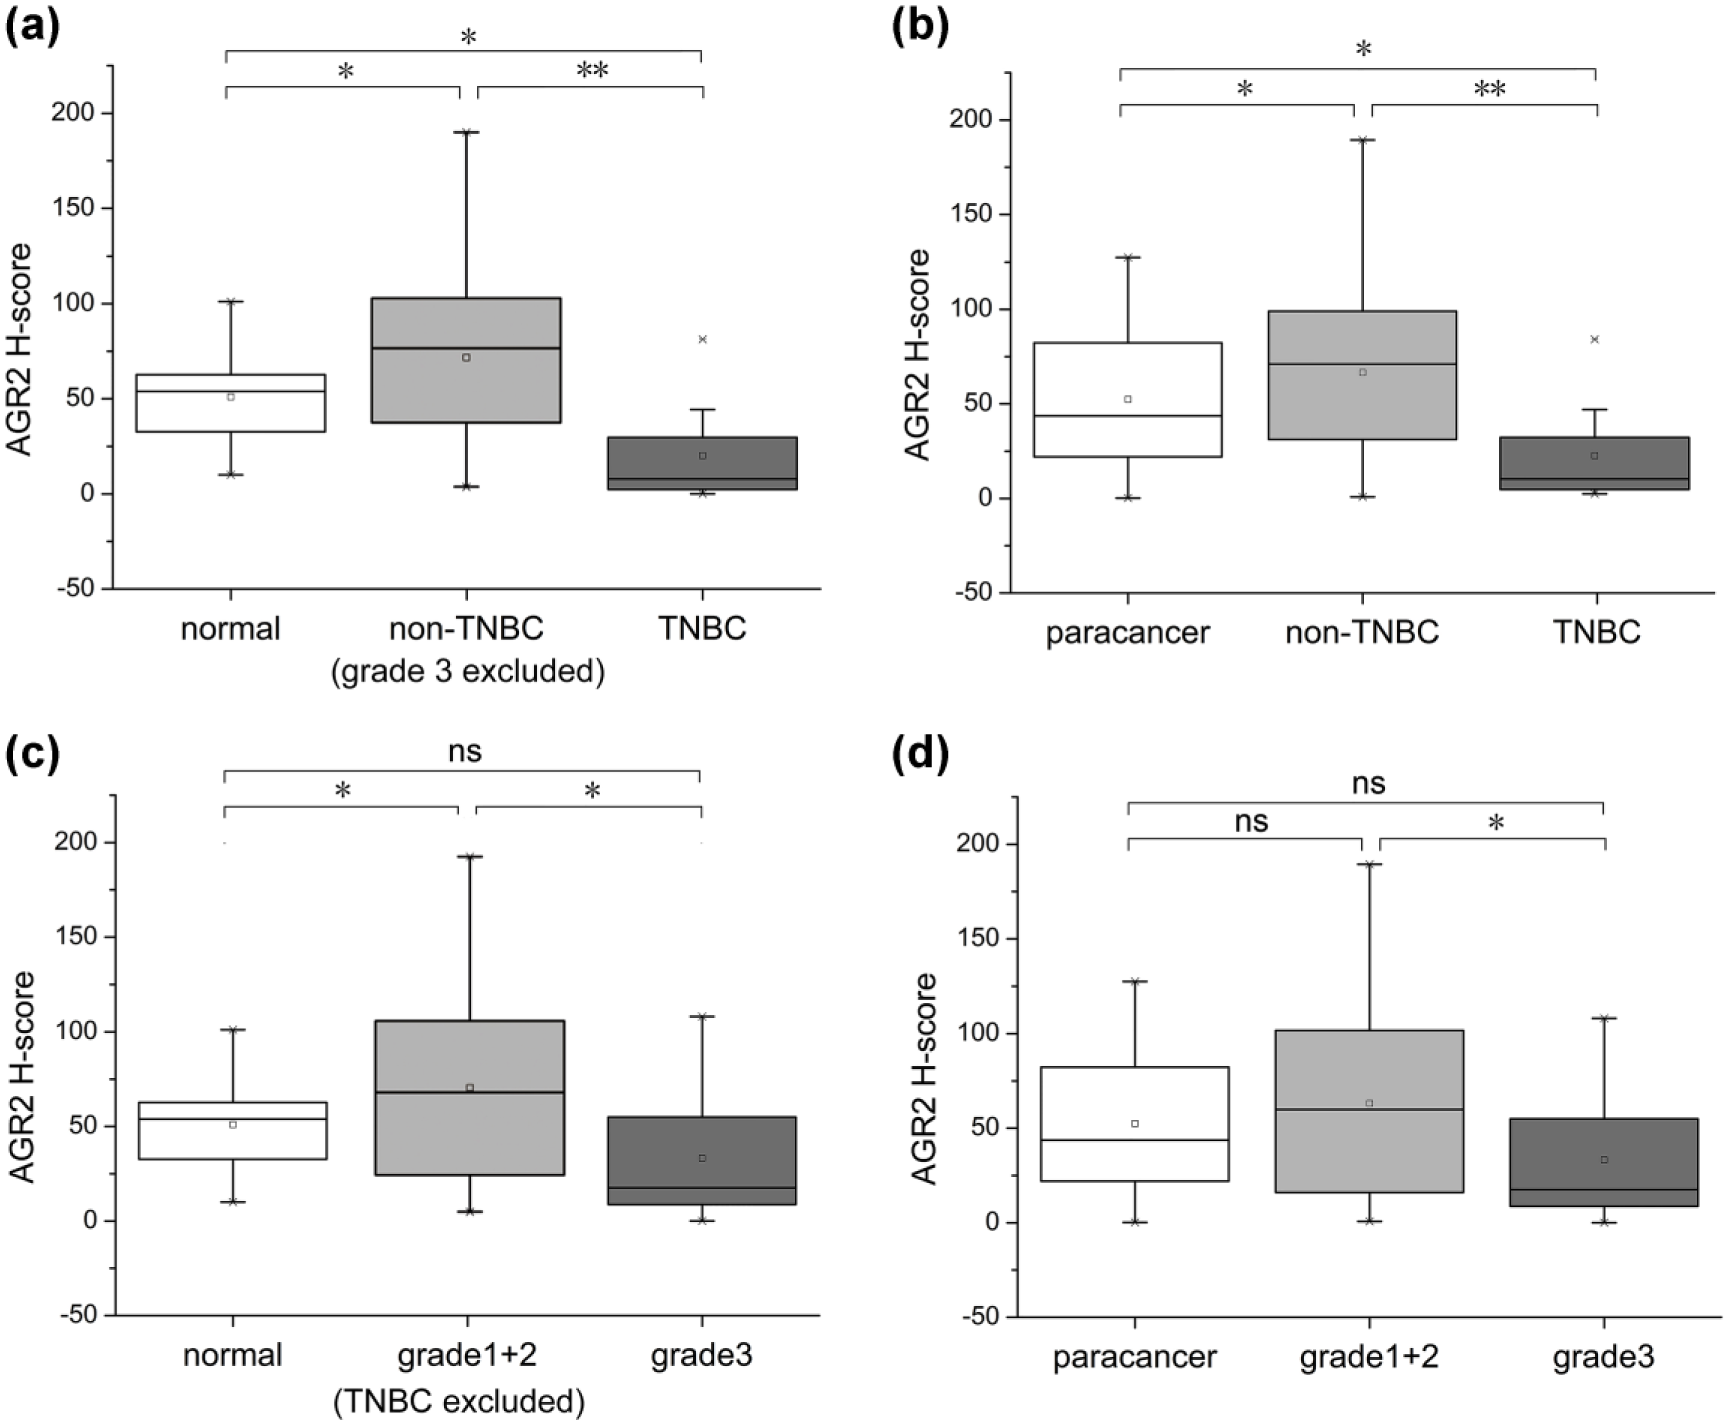
The quantification of immunohistochemical staining with H-scores. (a) Comparison of H-scores in normal, non-TNBC (grade 3 excluded) and TNBC tissues. (b) Comparison of H-scores in paracancer, non-TNBC and TNBC tissues. (c) Comparison of H-scores in normal tissues and grade 1 + 2 (TNBC excluded) and grade 3 tumours. (d) Comparison of H-scores in paracancer tissues and grade 1 + 2, grade 3 tumours.
In addition, breast cancers were divided into grade 1 + 2 and grade 3 subtypes. AGR2 was highly expressed in grade 1 + 2 tissues (TNBC excluded) compared with that in normal tissues and grade 3 tissues (Figure 3(c)). AGR2 protein levels between grade 1 + 2 and grade 3 tissues were significantly different (p < 0.05) (Figure 3(d)). There was no significant difference of AGR2 expression between grade 1 + 2 and paracancer tissues (Figure 3(d)).
Association of AGR2 expression with clinicopathological variables
Analysis of the association between AGR2 expression with clinicopathological variables demonstrated that AGR2 expression was significantly associated with histology, histological grade, ER status and PR status (p < 0.05) (Table 1), indicating the effectiveness of AGR2 as a biomarker for breast cancer.
The association between AGR2 expression and clinicopathological variables.
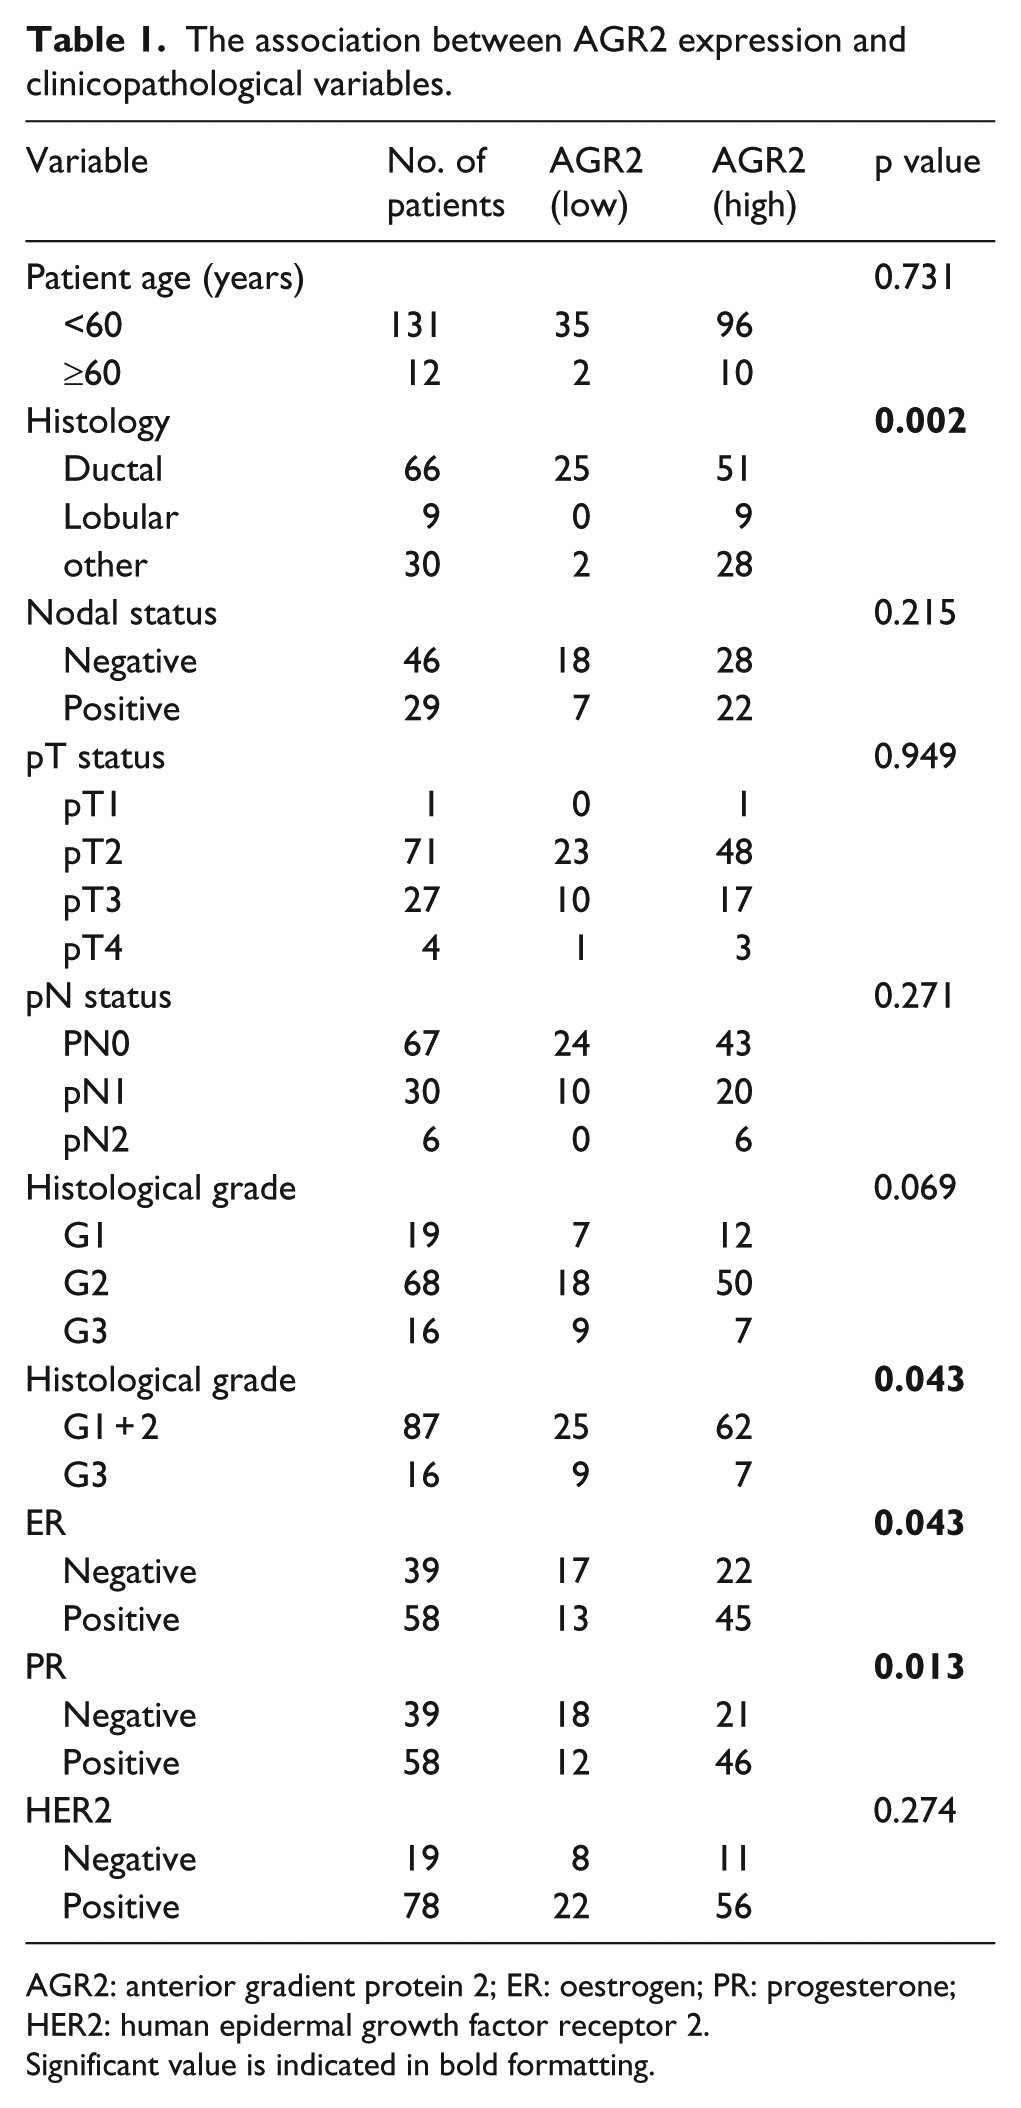
AGR2: anterior gradient protein 2; ER: oestrogen; PR: progesterone; HER2: human epidermal growth factor receptor 2.
Significant value is indicated in bold formatting.
Association of AGR2 with patient survival time
The association between overall survival of patients and AGR2 protein expression was analysed. The results of univariate analysis of pathological parameters related to overall survival in patients with grade 1 and 2 tumours are listed in Table 2. AGR2 expression, tumour size and lymph node status were significantly correlated with overall survival (Table 2).
Univariate analysis of clinicopathological variables for patient overall survival in the subgroup of grade 1 and 2 tumours.

AGR: anterior gradient protein; ER: oestrogen; PR: progesterone; HER2: human epidermal growth factor receptor 2.
Furthermore, the prognostic value of AGR2 was verified with KM plotter. When using data from patients with all tumour types, no significant association between AGR2 expression and overall survival was found (Figure 4(a)). Additionally, no significant association was found between AGR2 expression in grade 1 tumours and overall survival (Figure 4(b)). The results of analysis of the tissue microarray revealed that there was no significant association between AGR2 expression and overall survival (Figure 4(c)), but the high expression of AGR2 in both grade 1 and 2 breast cancer indicated shorter overall survival (p < 0.05) (Figure 4(d)).

The prognostic value of AGR2. (a) Overall survival analysis of all patients according to AGR2 expression using Kaplan–Meier plotter. (b) Overall survival analysis of patients with grade 1 tumours according to AGR2 expression using Kaplan–Meier plotter. (c) Overall survival analysis of all patients according to AGR2 expression using tissue microarray. (d) Overall survival analysis of patients with grade 1 + 2 tumours according to AGR2 expression using tissue microarray.
Furthermore, the patients were divided into different groups by their histological tumour grade based on the tissue microarray. The results showed that patients with high AGR2 expression had unfavourable prognosis compared with patients with low AGR2 expression.
To validate whether the significance between AGR2 expression and overall survival was independent of other variables, Cox multivariate analysis was conducted with only the significant variables identified by univariate analyses (Table 3). AGR2 was found to be a putative independent indicator of unfavourable outcomes when considering the Cox regression model including all clinicopathologic variables (p = 0.031) (Table 3).
Cox multivariate analysis for all factors potentially influencing patient overall survival in the subgroup of grade 1 and 2 tumours.
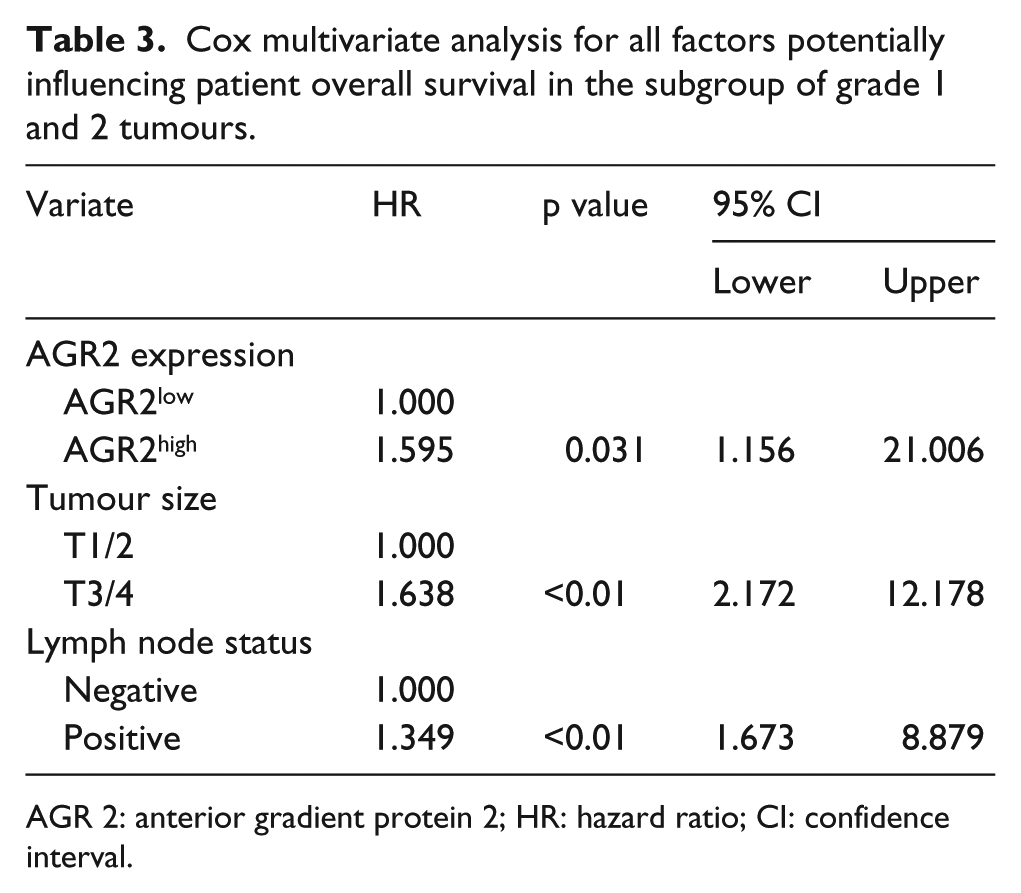
AGR 2: anterior gradient protein 2; HR: hazard ratio; CI: confidence interval.
Discussion
Breast cancer is a significant threat to women’s health. It has various subtypes and exhibits different biological features, prognostic outcomes and invasion and metastases patterns. Many biomedical studies have been designed to investigate breast cancer. A large amount of data on breast cancer can be obtained from the GEO. 24 In TCGA data sets, data can be found on 1098 cases of breast invasive carcinoma, including information such as simple nucleotide variation, transcriptome profiling, copy number variation, DNA methylation, biospecimen and clinical data. These data would help develop effective, sensitive and specific biomarkers for breast cancer.
This study aimed to identify the AGR2 expression pattern in different breast cancer subtypes based on GEO and TCGA data sets. Moreover, we evaluated the prognostic value of AGR2 protein as a biomarker in breast cancer using tissue microarray. In this study, we identified overexpression of AGR2 in non-TNBC tissues and reduced expression in TNBC tissues using breast cancer data sets in GEO and TCGA. Moreover, we identified the AGR2 expression pattern using eight cell lines (Figure 1(e)).
Kyoungsook Park et al. 25 have reported that AGR2 promotes cell proliferation and migration and is a biomarker for mucinous ovarian cancer. Elizabeth A Wayner et al. 26 have found that AGR2 is overexpressed in prostate cancer and that a urine test for AGR2 could be used for the diagnosis of prostate cancer. Using microarray, expressed sequence tag (EST) and serial analysis of gene expression (SAGE) analyses, Dejun Shen et al. 27 have identified that AGR2 is highly expressed in breast cancer, which is consistent with this study. AGR3 is a probable paralogue of AGR2. 28 Stefan Garczyk et al. 15 have reported that AGR3 and AGR2 are suitable serum-based biomarkers for the early detection of breast cancer. AGR2 and AGR3 proteins were significantly elevated in breast cancer patients (mainly low-grade tumours) compared to that in healthy controls. 15 Marcel Smid et al. 29 have reported that AGR2 is involved in bone metastasis of breast cancer. Marc Lacroix 30 reported that AGR2 is a differentially expressed gene between tumour (colorectal, prostate and breast cancer) and control samples and is known to be correlated with the epithelial cell phenotype. These studies are consistent with this study, showing the overexpression of AGR2 in breast cancer.
Evidence has revealed that AGR2, a member of the protein disulphide isomerase (PDI) family, 31 is associated with breast carcinogenesis. It has been reported that AGR2 can be associated with both reduced and increased survival of breast cancer patients. Dong L Barraclough et al. 32 have identified that AGR2 is correlated with poor survival in patients with operable (stage I and II) breast cancer. HE Innes et al. 33 have reported the significance of the metastasis-inducing protein AGR2 in the survival of hormonally treated breast cancer patients. AGR2 has been identified as a tumour marker that is specifically upregulated in response to the depletion of oxygen and serum. 34 Zweitzig et al. 34 have identified that physiological stress contributes to the induction of the metastasis marker AGR2. Michael L Salmans et al. have reported that AGR2 is targeted by ER-alpha and overexpressed in a subset of ER-negative tumours. AGR2 is a promising drug target and could serve as a useful prognostic indicator in breast cancer. 35 These studies have revealed the relevance of AGR2 as a prognostic or diagnostic protein biomarker. Initially, we investigated AGR2 expression in breast cancer tissues compared with that in normal breast tissues. More importantly, AGR2 exhibits different expression patterns in non-TNBC and TNBC. However, due to the molecular heterogeneity and complexity of breast cancer, the prognostic value of AGR2 in subtypes of breast cancer remains elusive. These data would contribute to the further prognostic analysis of AGR2.
Moreover, we have examined the association of AGR2 expression with clinicopathological variables in breast cancer. Statistical analyses have revealed that AGR2 expression is significantly associated with histologic type, histological grade, ER-alpha status and PR status (Fisher’s exact test, p < 0.05), as shown in Table 1. Furthermore, we determined the prognostic value of AGR2 in low-grade breast tumours. The result has revealed that the high expression of AGR2 indicated unfavourable prognostic outcomes in grade 1 + 2 tumours (Figure 4). This study is the first to analyse the prognostic value of AGR2 expression based on clinicopathology and molecular subtype using univariate analysis and Cox regression analysis.
Barraclough et al. 32 have reported that after 20 years of follow-up, only 26% of AGR2-positive patients (stage I and II) survived, while 96% of AGR2-negative patients survived (p < 0.0001). The expression of AGR2 protein is significantly associated with ER-alpha expression and low histological grade in hormonally treated breast cancer patients, 33 which is similar to the results of this study. By immunohistochemistry, Stefan Garczyk et al. 15 have reported that AGR3 protein is overexpressed in human breast tumours. In this study, we have identified high expression of AGR2 in non-TNBC and low expression in TNBC tissues, which is consistent with previous results. By Cox multivariate regression analysis, Barraclough et al. 32 have found that AGR2 is one of the most significant independent prognostic indicators. These data are concordant with those of this study.
In summary, the expression pattern of AGR2 has been identified by analysis of GEO and TCGA databases and validated by qRT-PCR. The results of integrated analyses revealed that AGR2 expression was higher in non-TNBC tissues compared with that in normal tissues. The H-score results revealed that AGR2 expression was significantly high in non-TNBC (grade 3 excluded) and grade 1 + 2 (TNBC excluded) tissues compared with normal tissues. This study provides additional information for a traditional validation method based on immunohistochemistry. The differential expression patterns of AGR2 protein demonstrate that AGR2 could be a potential marker for distinguishing TNBC from non-TNBC. AGR2 could also be treated as a potential biomarker for breast cancer in comparison with normal breast tissues. According to the results from Fisher’s exact test, AGR2 expression is significantly associated with the histologic type, histological grade, and ER and PR status. Univariate analyses of clinicopathological variables showed that AGR2 expression, tumour size and lymph node status are significantly correlated with the overall survival of patients with grade 1 and 2 tumours. Cox multivariate analysis revealed that AGR2 can be a putative independent indicator of unfavourable outcomes (p = 0.031). All these data showed that AGR2 could be a putative independent predictor of prognosis. AGR2 expression may be an indicator of unfavourable outcomes of patients with low and intermediate grades of breast cancer.
Footnotes
Declaration of conflicting interests
The author(s) declared no potential conflicts of interest with respect to the research, authorship, and/or publication of this article.
Funding
The author(s) disclosed receipt of the following financial support for the research, authorship, and/or publication of this article: This work was supported by the National Natural Science Foundation of China (NSFC81373573, NFSC81460655) and the Mongolian medicine systems biology science and technology innovation team plan of Inner Mongolia.