
Abstract
The use of trastuzumab in patients with breast cancer that overexpresses human epidermal growth factor receptor 2 has significantly improved treatment outcomes. However, a substantial proportion of this patient group still experiences progression of the disease after receiving the drug. Evaluation of the changes in expression of the human epidermal growth factor receptors could be of interest. Monoclonal antibodies against the extracellular domain of the human growth factor receptors, 2, 3, and 4, have been raised, and specific and sensitive immunoassays have been established. Sera from healthy individuals (Nordic Reference Interval Project and Database) were analyzed in the human epidermal growth factor receptor 2 assay (N = 805) and the human epidermal growth factor receptor 3 and 4 assays (N = 114), and reference limits were calculated. In addition, sera from 208 individual patients with breast cancer were tested in all three assays. Finally, the human epidermal growth factor receptor 2 assay was compared with a chemiluminescent immunoassay for serum human epidermal growth factor receptor 2/neu. Reference values were as follows: human epidermal growth factor receptor 2, <2.5 µg/L; human epidermal growth factor receptor 3, <2.8 µg/L; and human epidermal growth factor receptor 4, <1.8 µg/L. There were significant differences in human epidermal growth factor receptor 2 and human epidermal growth factor receptor 3 serum levels between the patients with tissue human epidermal growth factor receptor 2–positive and tissue human epidermal growth factor receptor 2–negative (p = 0.0026, p = 0.000011) tumors, but not in the serum levels of human epidermal growth factor receptor 4 (p = 0.054). There was good agreement between the in-house human epidermal growth factor receptor 2 assay and the chemiluminescent immunoassay. Our new specific antibodies for all the three human epidermal growth factor receptors may prove valuable in the development of novel anti-human epidermal growth factor receptor targeted therapies with sensitive immunoassays for measuring serum levels of the respective targets and in monitoring established treatment.
Introduction
The human epidermal growth factor receptor (HER) family comprises four members, epidermal growth factor (EGF) receptor (also termed ErbB1/HER1), ErbB2/Neu/HER2, ErbB3/HER3, and ErbB4/HER4. We will refer to them as HER1, HER2, HER3, and HER4. All members have an extracellular ligand-binding domain (ECD), a single membrane-spanning region, and a cytoplasmic tyrosine-kinase-containing region. Under normal physiological conditions, activation of the HERs is controlled by limited and temporal expression of their ligands. 1 Ligand binding to their receptors induces formation of homo- and heterodimers which leads to activation of the intrinsic kinase domain, resulting in phosphorylation on specific tyrosine residues and the recruitment of a range of proteins that eventually activate intracellular signaling pathways. 2
Approximately 15%–20% of breast cancer tumors overexpress HER2. 3 This overexpression was first found to be associated with worse prognosis in the late 1980s, 4 and in 1998 the use of a monoclonal antibody (mAb) against HER2 was evaluated in a first-generation trial. 5 The humanized mAb trastuzumab, also known as Herceptin®, has significantly improved treatment outcomes in early and advanced-stage diseased patients with HER2-overexpressing breast cancer. 6 Unfortunately however, a substantial proportion of this patient group still experiences progress of cancer after receiving the drug. Resistance to trastuzumab treatment has been linked to many factors, including impaired access of trastuzumab to HER2 by expression of a truncated variant of HER2 (p95 HER2), overexpression of other EGF receptor family members and/or their ligands, or alternative signaling by overexpression of insulin-like growth factor receptors.7,8 Considering the potential overexpression of the other HERs in response to trastuzumab treatment, specific antibodies to HER3 and HER4 may be of therapeutic interest. 9 HER2 status of nearly all breast cancers is examined by immunohistochemistry (IHC).
The most widely used biomarkers in blood in breast cancer are carcinoma antigen 15-3 (CA 15-3) and carcinoembryonic antigen (CEA), but the clinical utility of these biomarkers lacks evidence. 10 Therefore, serological testing of circulating HER2 for monitoring tumor response to therapy is of potential interest. The HER2 undergoes proteolytic cleavage of its extracellular domain and the ECD is released into the peripheral circulation. 11 Some studies have shown that serum HER2 ECD may predict response and resistance to trastuzumab treatment,12,13 and that serial testing after surgery may be useful in early diagnosis of recurrence.14,15 Others, however, have shown less clinical usefulness of HER2 serum measurements.16–18 HER3 and HER4s may also undergo proteolytic cleavage of the extracellular domains and the ECD may be measured in peripheral circulation. However, the significance of circulating ECD of HER3 and HER4s in patients with breast cancer is not known.
We report in-house produced specific antibodies and sensitive immunoassays for circulating HER2, HER3, and HER4. The immunoassays detect the ECDs of the individual receptors, and they will only be referred to as HER2, HER3, and HER4 assays. Serum samples from healthy individuals and from patients with breast cancer have been tested in the HER 2, HER3 and HER4 assays. The HER2 assay was also compared with a commercially available immunoassay for HER-2/neu (ADVIA Centaur; Siemens, Erlangen, Germany).
Materials and methods
Preparation of mAbs
Recombinant ErbB2/HER2, ErbB3/HER3, and ErbB4/HER4 expressed in human cells were purchased from Sino Biological Inc. (Beijing, China). Thyroglobulin was extracted from tissue taken from human thyroid goiter as previously described. 19 Each individual receptor (1 mg) was conjugated to 1 mg of thyroglobulin using 1-ethyl-3-[3-(dimethylamino)-propyl] carbodiimide (EDC). Three groups of female BALB/c mice (6–8 weeks of age; Harlan Olac Ltd, Oxon, UK) were primed by subcutaneous injections with approximately 40 µg of recombinant human HER2–Tg conjugate, HER3–Tg conjugate, or HER4–Tg conjugate, emulsified in Freund’s complete adjuvant. Booster immunization of approximately 40 µg of the individual conjugate solutions (subcutaneous) in Freund’s incomplete adjuvant was given 2 and 3 months later. Four months after the initial priming dose, three daily intraperitoneal boosts of 50–100 µg of the individual conjugate solutions in saline were given immediately before splenectomy. 20 Experimental animals were treated in accordance with institutional guidelines. Specific immune responses were determined by incubating 100 µL of diluted blood samples from immunized mice with 100 µL of 125I-labeled recombinant HER2, HER3, or HER4 (approximately 50,000 cpm) in phosphate-buffered saline (PBS; 0.01 M NaH2PO4, 0.15 M NaCl pH 7.2) containing 1% bovine serum albumin (BSA). Radiolabeling of the proteins was performed as previously described. 19 Incubation was performed at room temperature before free and bound antigen were separated using sheep-anti mouse antibodies (SAMs) coupled to paramagnetic polymer particles (Dynabeads M280; Life Technologies, Oslo, Norway), by adding 100 µL of a 10 mg/mL suspension.
Screening for anti-HER mAbs was performed in MaxiSorp BreakApart microtiter plates (Thermo Scientific Nunc, Waltham, USA) coated with 1 µg per well of SAMs. The coating was performed as described for mAbs. 21 After incubation with hybridoma supernatants, the plates were washed, and 125I-labeled recombinant HER2, HER3, or HER4 was added (50,000 cpm per well) followed by a second 60-min incubation. The plates were washed before the wells were cut, and bound 125I-HER2, 125I-HER3, and 125I-HER4 were counted in a gamma counter. All the positive anti-HER2 hybridoma supernatants were also tested for binding to samples from the SK-BR-3 Breast Adenocarcinoma human cell line (ATCC, Wesel, Germany) and for cross-binding to the other HER variants.
Hybridomas were subcloned, and following a second screening selected clones were chosen for further in vitro expansion. Antibodies were purified by protein A-Sepharose (GE Healthcare Life Sciences, Oslo, Norway) chromatography. Subtyping of mAbs was performed using the IsoStrip Mouse Monoclonal Antibody Isotyping Kit (Roche, Indianapolis, IN, USA).
Surface plasmon resonance analysis
The BIAcore X optical biosensor system was used for binding studies of the mAbs. All samples were diluted in running buffer and injected at a flow rate of 5 µL/min. Purified and biotinylated mAb (1 µg) was immobilized to a streptavidin (SA) chip (Biacore; GE Healthcare), and recombinant HER2, HER3, or HER4 (0.3 µg) was injected. Then the different mAbs were injected (30 µL of cell supernatant filtered through a 0.2-µm filter), respectively, and the antigen surface was regenerated with a 2-min injection of 0.01 M glycine–HCl, pH 2.0, before the next mAb was injected.
Epitope mapping
Epitope mapping and grouping of antibodies were performed by cross-inhibition, where binding of mAbs to the antigen was performed in the absence of competing mAbs (reference signal) or in the presence of competing mAbs. Iodinated HER2, HER3, or HER4 (50,000 cpm, approximately 20 ng) was allowed to react for 1 h with 1 µg of competing mAbs (100× molar excess) in PBS containing 10 g/L of BSA. After incubation, 100 µL was transferred to BreakApart microtiter wells coated with mAbs (1 µg per well). The plates were incubated for 1 h with shaking, and then washed three times with wash solution, before counting of bound radioactivity. Binding of 125I-HER2, 125I-HER3, or 125I-HER4 without inhibiting antibody was used as a reference for each solid phase antibody, and complete cross-inhibition was defined as >80% inhibition.
Radiometric assays for pair combinations
Initial testing was performed with immunoradiometric assays. mAb-coated plates (1 µg per well) were incubated with 100 µL per well of sample and 100 µL per well of PBS with 0.3% BSA. The sample contained 100 µg/L of recombinant HER2, HER3, or HER4, or only buffer. After 60 min of incubation with continuous shaking, the plates were washed three times with wash solution, and 100 µL per well of 125I-labeled mAbs (50,000 cpm per well) was added and the plates were incubated for another 60 min under continuous shaking. Following six washes, the wells were cut, and bound radioactivity was counted in a gamma counter.
Calibrators and controls
HER2 calibrators were recombinant ErbB2/HER2 expressed in human cells (Sino Biological Inc.). The protein was diluted in matrix buffer (0.05 M Tris, 0.15 M NaCl, 0.1% Germall, and 6% BSA, pH 7.4) from 1 to 350 µg/L. In addition, the dilutions were calibrated against the ADVIA Centaur serum HER-2/neu assay obtained from Siemens. In-house control samples from pooled patient sera diluted to 9.4 and 94 µg/L were included in every assay.
HER3 calibrators and controls were recombinant ErbB3/HER3 expressed in human cells (Sino Biological Inc.) diluted in matrix buffer. The calibrators were from 2.5 to 800 µg/L, and the two control samples were 3.5 and 92 µg/L.
HER4 calibrators and controls were recombinant ErbB4/HER4 expressed in human cells (Sino Biological Inc.) diluted in matrix buffer. The calibrators were from 3.9 to 1000 µg/L, and the two control samples were 3.6 and 138 µg/L.
Immunofluorometric assay for serum HER2
Preparation of F(ab′)2 fragments, biotinylation of capture antibodies, and conjugation of tracer antibodies with Eu3+-chelates were performed as described previously. 19 Biotinylated F(ab′)2 fragments (0.4 µg per well) of solid-phase mAb M89 in 200 µL of Delfia assay buffer (0.05 M Tris–HCl, 0.15 M NaCl, 0.02 M diethylene triamine penta acetic acid, 0.5 g/L NaN3, 0.1 g/L Tween 20, 2 mg/L Amaranth, 5 g/L BSA, 0.5 g/L bovine IgG, and 200 mg/L MAK33-IgG, pH 7.8; Roche Molecular Biochemicals) was incubated in SA-coated microtiter wells (PerkinElmer, Turku, Finland) under continuous shaking for 30 min. After washing three times with wash solution (0.05 M Tris–HCL, 0.15 M NaCl, 0.05% Tween 20, 0.1% Germall, pH 7.8), 50 µL of calibrator or sample and 150 µL of Delfia assay buffer were added to duplicate wells, followed by continuous shaking for 60 min. After six washes, 0.2 µg per well of Eu3+-labeled tracer mAb M83 in 200 µL of Delfia assay buffer was added and plates were incubated for another 60 min under continuous shaking. Following six washes, 200 µL per well of enhancement solution was added, followed by incubation with shaking at room temperature for 5 min, and fluorescence was measured in a time-resolved (TR) fluorometer. The assay was automated using an AutoDELFIA instrument (PerkinElmer).
Detection limit
The limit of blank (LoB) and limit of detection (LoD) were determined according to Clinical Laboratory Standards Institute (CLSI) Guideline EP17-A. 22 LoB was defined as the mean of zero calibrator + 1.645 times the standard deviation (SD) and calculated from 17 replicates. LoD was defined as LoB + 1.645 times the SD of a sample containing low concentration of HER2 (9.4 µg/L) and calculated from 22 replicates.
Imprecision
The within-run and total imprecision of the assay were determined with 970 samples in 13 separate runs. The concentrations of the samples were measured in duplicates. Total imprecision was defined as the coefficient of variation (CV) of all measured concentrations in all assay runs and calculated using MultiCalc™ (Perkin Elmer, Turku, Finland).
Immunofluorometric assay for serum HER3 and HER4
The assays were essentially performed in the same way as the HER2 assay. For HER3, biotinylated F(ab′)2 fragments (0.2 µg per well) were used as the solid-phase mAb M92 and Eu3+-labeled M109 as the tracer antibody. The volume of calibrator and sample was 25 µL diluted with 175 µL of Delfia assay buffer. The assay imprecision was determined with 519 samples in 12 separate runs.
The HER4 assay used biotinylated F(ab′)2 fragments (0.2 µg per well) of mAb Mi14 and Eu3+-labeled mAb Mi1 as the two assay antibodies. The volume of calibrator and sample was 50 µL diluted with 150 µL of Delfia assay buffer. The assay imprecision was determined with 524 samples in 12 separate runs.
Serum samples
The HER2 concentrations were measured in serum samples (n = 805) from healthy volunteers, 397 men and 408 women (median: 48 and 46 years, range: 18–91 and 18–88 years, respectively) from Nordic Reference Interval Project Bio-bank and Database (NOBIDA). 23 Serum samples from 208 individual patients with breast cancer (median age: 54 years, range: 24–96 years) were available. However, due to our hospital being a referral hospital, pretreatment/preoperative samples were often not available. Of the 208 patients with breast cancer, 149 patients had HER2-positive breast cancer, 50 patients had HER2-negative breast cancer, and 9 patients had breast cancer where HER2 status was not verified (unknown HER2 status). The blood samples for some patients were drawn after primary treatment. The clinical characterization of the patients regarding residual disease, metastatic disease, or remission at the time of blood sampling was missing in some patients. The only information was the HER2 status when diagnosed/operated. The samples were analyzed simultaneously in our HER2 assay and the ADVIVA chemiluminescent immunoassay (CLIA) for serum HER-2/neu (measuring range: 0.5–350 µg/L, reference limit: <15.2 µg/L).
Serum samples from 114 of the healthy individuals (NOBIDA) were also analyzed in our HER3 and HER4 assays. Due to small sample volumes, only 196 of the samples from the IHC-characterized patients with breast cancer were analyzed in the HER3 and the HER4 assays, samples drawn after primary treatment. At the time of primary treatment, 148 were HER2 positive and 48 HER2 negative.
The samples were stored at −30°C. All participants had given written informed consent to participate in the study, and The Regional Committee for Medical Research Ethics approved the study.
Statistical analysis
HER2, HER3, and HER4 values were log-transformed to obtain normal distribution. Statistical significance between groups was evaluated by Student’s t-test (for individual samples). However, the classification as HER2 positive, negative, and unknown was done at the time of primary treatment, and some of the patients may be without disease at the time of blood sampling. Spearman’s correlation and Deming regression analysis were performed to compare the in-house HER2 TR immunofluorometric assay (IFMA) assay and the ADVIVA CLIA for serum HER-2/neu.
Results
mAb characteristics
Several mAbs against the different human HERs were obtained after screening approximately 1000 hybridomas from three individual fusions. A total of 19 anti-HER2 antibodies were selected according to their ability to bind both recombinant HER2 and HER2 secreted by the SK-BR-3 Breast Adenocarcinoma human cell line. A total of 23 anti-HER3 antibodies and 21 anti-HER4 antibodies were selected according to their ability to bind respective recombinant proteins.
Further binding studies were performed using surface plasmon resonance (SPR) analysis on a BIAcore X optical biosensor system. One of the 19 anti-HER2 antibodies (M83) with high binding affinity for recombinant HER2 was purified, biotinylated, and immobilized to an SA chip. Binding of recombinant HER2 and subsequently each of the other 18 mAbs with regeneration of the antigen surface in-between was performed to identify potential antibody pairs (results not shown). The same was done for the anti-HER3 and anti-HER4 antibodies. Six antibodies from each HER-group were selected according to their ability to make antibody pairs, and they were subcloned and purified on a protein A column. The purified antibodies were IgG subtyped. All the antibodies were of IgG1 subtype, except for the anti-HER2 antibody (M83) and the anti-HER4 antibody (Mi8) which were of IgG2a subclass. All possessed kappa light chains.
Epitope mapping
Characterization of which antibodies were able to bind simultaneously to the antigen (recombinant HER2, HER3, or HER4) was evaluated by cross-inhibition assays. Binding of the mAbs to the antigen was performed in the presence of inhibiting mAbs already bound to labeled antigen and in the absence of mAbs (reference signal); see Tables 1–3 for HER2, HER3, and HER4, respectively. From the inhibition patterns, it was possible to separate the antibodies into groups according to the following criteria: complete cross-inhibition (i.e. >80%) and concordant inhibition pattern with other antibodies in the group.
Cross-inhibition between HER2 antibodies as percent inhibition.

mAb: monoclonal antibody.
Complete inhibition (>80%) is indicated in bold type.
Cross-inhibition between HER3 antibodies as percent inhibition.

mAb: monoclonal antibody.
Complete inhibition (>80%) is indicated in bold type.
Cross-inhibition between HER4-antibodies as percent inhibition.

mAb: monoclonal antibody.
Complete inhibition (>80%) is indicated in bold type.
Thus, the HER2 antibodies could be classified into three main groups (A, B, and C), where group A was further subdivided into subgroups (A1 and A2). Group A comprises mAbs M75, M89, and M77, and due to low inhibition of M77 toward M75 and some dissimilarities in inhibition pattern with the antibodies in the other two main groups, this antibody was assigned to its own subgroup. Group B comprises mAbs M79 and M83, and group C comprises mAb M84.
The HER3 antibodies could be classified into three main groups (D, E, and F). Group D comprises mAbs M91, M101, M109, and M111, group E comprises mAb M92, and group F comprises mAb M103.
The HER4 antibodies were more diverse and could be classified into five groups (G, H, I, J, and K). Only group H consisted of two antibodies (Mi2 and Mi14), whereas the others comprise only one mAb each (group G, Mi1; group I, Mi8; group J, Mi13; and group K, Mi19).
Antibody pair combinations
HER2 assay combinations
Pair combinations of the six selected anti-HER2 antibodies were evaluated in two-site immunoradiometric assays with recombinant HER2 as antigen (Figure 1). Each mAb was used as solid phase, and each as tracer. The results showed that antibody M89 (group A1) as solid-phase antibody with either M79 and M83 (group B) or M84 (group C) as tracer antibodies gave the highest signals. To minimize the risk of heterophilic antibody interference, modifications were introduced including the use of F(ab′)2 fragments as solid phase and irrelevant immunoglobulin buffer additives. 24 Biotinylated F(ab′)2fragments of M89 and Eu3+-labeled M79, M83, and M84 as tracer antibodies were further evaluated in two-site IFMAs with HER2 calibrators and controls (results not shown). The final best assay combination with the highest signals comprised antibody M89 in combination with M83 as tracer antibody.

Pair combinations of the antibodies with recombinant HER2 in an immunoradiometric assay format. The colored bars show the individual 125I-labeled mAbs. Red = M75*, orange = M89*, yellow = M77* green = M79*, turquoise = M83*, and blue = M84*.
HER3 and HER4 assay combinations
Separate studies were also performed to evaluate assays for HER3 and HER4. Pair combinations of the six selected antibodies for each antigen group were evaluated in two-site IFMAs with recombinant HER3 or HER4 as antigens (results not shown). The anti-HER3 antibody M92 was recognized as the best solid-phase antibody in combination with antibodies from the other two groups (M103 and M109). These two combinations were further tested for binding to a dilution series of recombinant HER3 and a few sera from healthy individuals (NOBIDA) and patients with HER2-positive breast cancer. Both combinations had high signals and low reactivity in normal sera, but only the combination of M92 as solid-phase antibody with M103 as tracer showed slightly elevated levels in some of the patient samples; thus, this combination was chosen for the final assay. For the anti-HER4 assay testing, three antibodies from three different groups (Mi 13, Mi14, and Mi19) performed best as solid-phase antibodies in combinations with antibodies from the two last groups (Mi1 and Mi8). After testing for binding with the same regime as for the anti-HER3 assay combinations, Mi14 as solid-phase antibody in combination with Mi1 as tracer turned out to be the final choice. Neither of the HER3 or HER4 assays had cross-reactivity with recombinant HER2.
Assay format and performances of the final assays
Calibrators containing recombinant HER2, HER3, or HER4 were used to determine optimal assay kinetics in SA-coated microtiter plates. In addition, two in-house control samples from pooled patient sera diluted to 9.4 and 94 µg/L were used in the kinetic evaluation of the HER2 assay. Generally, the signals reached maxima at incubation interval of 30 min for the capture reagents, 1 h for the antigens, and a final incubation of 1 h with the tracer antibodies. Optimal concentrations of the solid phase antibodies were 0.4 µg per well for the anti-HER2 antibody M89 and 0.2 µg per well for the anti-HER3 and anti-HER4 antibodies M92 and Mi14. Optimal concentrations of the tracers were 0.2 µg per well for all the Eu3+-labeled tracer antibodies. The three response curves were linear and displayed wide dynamic ranges, and the calibration curve with imprecision profile for the HER2 assay is shown in Figure 2.

Calibration curve and imprecision profile for the TR-IFMA for HER2. The calibration curve is linear over a range of 1.0–329 µg/L. The imprecision profile shows CV <3.9% over the entire working range (n = 970).
Analytical validation for HER2 assay
LoB was determined from 17 separate runs as 0.13 µg/L. LoD was calculated from the LoB and SD of a sample containing low concentration of HER2 (9.4 µg/L) in 22 separate runs to 0.86 µg/L.
The within-run and total imprecision of the assay were determined from results of 970 serum samples in 13 separate runs. The variation between replicates was good with a total imprecision of less than 5% over the whole assay range (Figure 2). The total CV for the sample controls was calculated to be 4.7% for K1 (9.4 µg/L) and 4.6% for K2 (94 µg/L).
Serum HER2 levels in healthy individuals
HER2 concentrations in sera from 805 healthy individuals from the NOBIDA biobank were analyzed in 18 separate runs. A flat, age- and sex-independent, 97.5-percentile reference limit was calculated to be 12.5 µg/L (90% confidence interval (CI) = 12.4; 12.6 µg/L; Figure 3).

Upper reference limit for serum HER2. HER2 concentrations were measured in serum from 805 healthy individuals (408 women and 397 men) from the NOBIDA biobank. An age- and sex-independent upper 97.5-percentile reference limit was calculated to be 12.5 µg/L (solid line) with 90% confidence interval from 12.4 to 12.6 µg/L (dotted lines).
Serum HER2 distribution in the patient population
HER2 concentrations were measured in sera from 208 patients with breast cancer and compared with their tissue HER2 expression at primary treatment (Figure 4). For the patients with multiple samples, the first sample obtained was analyzed. In the patients with HER2-positive primary tumors (N = 149), the values were broadly scattered, the median value was 56.1 µg/L and the maximum value was 1497 µg/L; whereas in the patients with HER2-negative primary tumors (N = 50), the median value was 9 µg/L and the highest value obtained was 31 µg/L. There was a significant difference in the HER2 serum levels between the patients with tissue HER2-positive and the patients with tissue HER2-negative primary tumors (p = 0.0026). Of the patients with breast cancer tissue HER2-positive primary tumors, 43% had elevated serum HER2 levels in the available blood samples. Whereas 14% of the patients with tissue HER2-negative primary tumors had serum HER2 levels above the reference limit. For the patients with unknown HER2 status (N = 9), 78% had elevated serum HER2. However, the clinical characterization at blood sampling was missing.

Distribution of serum HER2 in patients with tissue HER2-negative primary tumors (N = 50), tissue HER2-positive primary tumors (N = 149), and unknown tissue HER2 status (N = 9). The upper reference limit of 12.5 µg/L calculated from the NOBIDA material is included in the figure (dotted line).
Assay imprecision for HER3 and HER4 assays
The within-run and total imprecision of the HER3 and the HER4 assays were determined from the results of 519 and 524 serum samples, respectively, in 12 separate runs. The variation between replicates was good for the HER3 assay with a total imprecision of less than 4% over the whole assay range. The variation between replicates was acceptable for the HER4 assay with a total imprecision of less than 10.5% except for the lowest concentration level (3.9 µg/L) where it was 16.5%. The total CV for the sample controls for HER3 was calculated to be 2.3% for K1 (3.5 µg/L) and 1.9% for K2 (92 µg/L). The total CV for the sample controls for HER4 was calculated to be 12.9% for K1 (3.6 µg/L) and 11.4% for K2 (138 µg/L).
Serum HER3 and HER4 distributions in healthy controls and the patient population
HER3 and HER4 concentrations in sera from 114 healthy individuals from the NOBIDA biobank were analyzed, and flat, age- and sex-independent, 97.5-percentile reference limits were calculated to be 2.8 µg/L (90% CI = 2.76; 2.87 µg/L) and 1.8 µg/L (90% CI = 1.73; 1.83 µg/L), respectively. The serum levels of HER3 and HER4 were also measured in blood samples from 205 patients with breast cancer and compared with tissue HER2 expression at primary treatment (Figures 5 and 6). There was a significant difference in the serum levels of HER3 in the population with tissue HER2-positive versus tissue HER2-negative breast cancer (p = 0.000011), with median and maximum values of 4.0 and 124 µg/L for the patients with HER2-positive primary tumors, versus 2.4 and 31.9 µg/L for the HER2-negative primary tumors, respectively. There was, however, no significant difference between the levels of HER4 in the populations with tissue HER2-positive versus the tissue HER2-negative breast cancer (p = 0.054), with median and maximum HER4 serum values of 2.0 and 105 µg/L, and 2.4 and 117 µg/L, respectively, for the patients with HER2-positive primary tumors versus HER2-negative primary tumors.

Distribution of serum HER3 in patients with tissue HER2-negative primary tumors (N = 49), tissue HER2-positive primary tumors (N = 147), and unknown tissue HER2 status (N = 9). The upper reference limit of 2.8 µg/L calculated from the NOBIDA material is included in the figure (dotted line).

Distribution of serum HER4 in patients with tissue HER2-negative primary tumors (N = 48), tissue HER2-positive primary tumors (N = 148), and unknown tissue HER2 status (N = 9). The upper reference limit of 1.8 µg/L calculated from the NOBIDA material is included in the figure (dotted line).
Comparison of the new HER2 TR-IFMA with a commercial HER2 CLIA
Concentrations of HER2 in 208 patient samples were determined simultaneously by the in-house TR-IFMA and the CLIA (ADVIVA Centaur; Siemens). The correlation between the TR-IFMA IFMA and the CLIA was y = a + bx with a = −0.23 (95% CI = −0.36; −0.09) and b = 1.02 (95% CI = 0.91; 1.13), ρ = 0.87 (95% CI = 0.82; 0.90); Figure 7). The mean difference between the assays was −40.7 µg/L with 95% CI of −44.9 to −36.6 µg/L. Thus, patient serum samples with elevated HER2 values in the CLIA also showed increased values in the new IFMA assay, but the new IFMA tended to give lower results than the CLIA by between −44.9 and −36.5 µg/L.
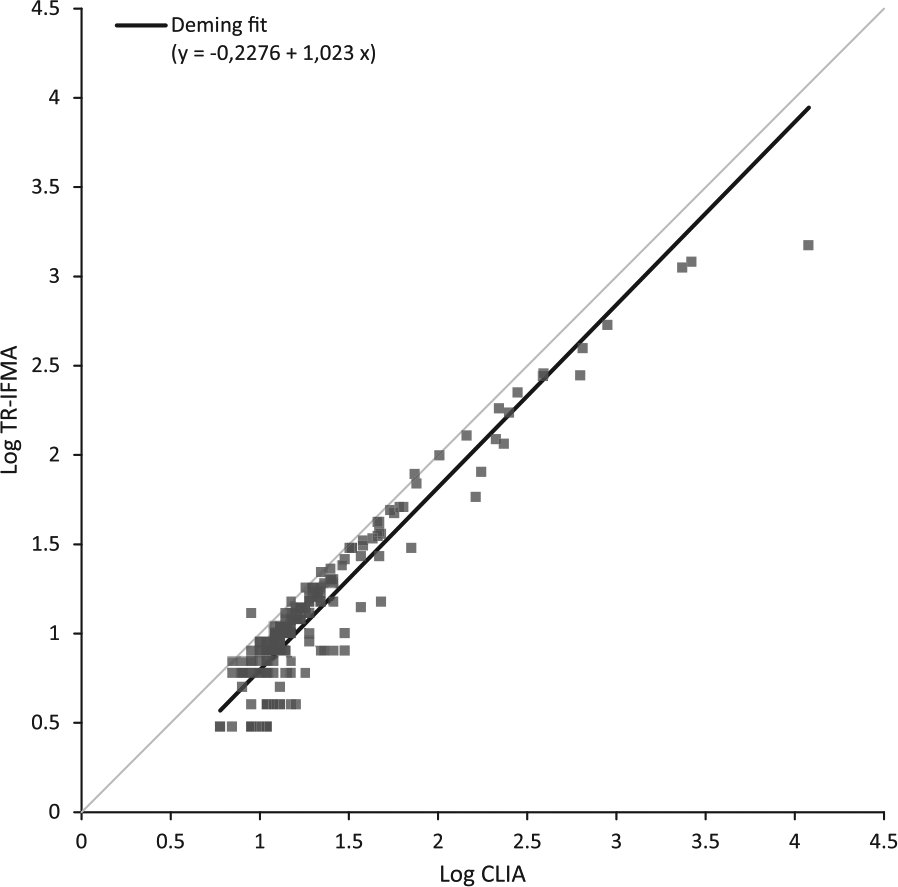
Correlation between the in-house TR-IFMA and the chemiluminescent immunoassay (ADVIA Centaur; Siemens) in serum samples from 208 patients. Deming regression line is included.
Discussion
HER2 overexpression is most commonly detected in breast cancer, but other malignancies, such as ovarian, colorectal, gastric, prostate, and lung cancer, may also express HER2.25,26 Trastuzumab is also approved for metastatic gastric cancer, and it has been shown that serum HER2 correlated with tissue HER2 status. 25 However, the efficacy of the trastuzumab treatment is not durable for gastric cancer, and predictive biomarkers of response to HER2 are missing. 27 The clinical outcome of targeted therapy like trastuzumab is highly dependent on correct identification of tumors expressing HER2. Currently, IHC or alternatively in situ hybridization (ISH) gene expression is routinely used to identify HER2 status of the patients before initiation of trastuzumab treatment. However, biopsies are obligate for these examinations although they only partially predict response to the drug. 28 Extensive work is done to evolve novel anti-HER strategies, and there is a need for better assays to quantify the HERs and categorize patients for individual treatments during treatment without biopsies.
Evolutionary analysis of the HERs revealed two ancestral receptors, the HER3/HER4 precursor and the HER1/HER2 precursor, and subsequent gene duplications of these precursors generated the four receptors present in human. 29 Analysis of similarities in the amino acid sequences of the HER2, HER3, and HER4 was performed, but no regions of alignment were found. To make specific antibodies and sensitive immunoassays for the extracellular domains of the three HERs, we have immunized mice with respective antigens conjugated to the highly immunogenic thyroglobulin molecule. The immunized mice responded well, and after screening approximately 3000 hybridomas, six antibodies from each receptor group were selected and classified into 11 epitope clusters according to their cross-inhibition patterns. In some of the cross-inhibition experiments, we obtained negative inhibition (Tables 1 and 3). This may be interpreted as an enhancement effect; hence, a conformational change in the antigen upon binding to one antibody may result in increased binding to the other antibody. Our choice of antibodies from the individually defined epitope groups indicates that we have a representative panel of mAbs when selecting suitable antibody pairs for the three IFMAs.
Three highly specific and sensitive immunoassays for serum HER2, HER3, and HER4 were constructed. The reference values were established using samples from the NOBIDA biobank, and the assays were tested using serum samples from 208 patients with breast cancer. The high percentage of elevated serum HER2 levels among the patients with tissue HER2-positive tumors (43%), even though the blood samples often were taken after primary treatment, suggests a potential use of serum HER2 in patient follow-up during and after treatment. Comparable numbers (23.5% of the patients with tissue HER2-positive versus 8.7% of the patients with tissue HER2-negative tumors) were published by Kontani et al. 30 in a study with 252 patients using the ADVIVA CLIA assay, and they suggested that HER2 may be a useful biomarker for detecting breast cancer recurrence. The higher percentage of patients with elevated HER2 in our study compared to Kontani et al. may be explained by different assay antibodies and/or different cut-off values. It has been suggested that the clinical value of the CLIA assay may benefit from a lower cut-off value. 31
In addition, patients with tumors without detectable HER2 with IHC (categorized as HER2 negative) had elevated HER2 levels in blood indicating residual disease and/or metastases producing HER2. Furthermore, the high percentage of patients with elevated serum HER2 among the tumors with unknown HER2 status (78%) suggests that there might be additional patients who could benefit from trastuzumab treatment and not only those identified by IHC and/or FISH. Elevated serum HER2 has been shown to be both prognostic and predictive of response to trastuzumab in HER2-positive tumors.32,33 However, in agreement with other groups, we have shown that there is a high discordant rate between HER2 status in primary tumors and serum HER2 levels. 34 We have to stress that the breast cancer patient material used in the study had severe limitations. Many of the patients had already started treatment when the samples were collected and the patient cohort was not fully clinically characterized. However, the patient material was used for verifying whether the newly developed HER assays could detect serum levels of the receptors. Thus, a larger and clinically characterized patient cohort with multiple samples from individual patients before, during, and after treatment should be evaluated before further conclusions can be drawn.
There was a significant difference in the serum levels of HER3 between patients with tissue HER2-positive and –negative tumors (p = 0.000011), and this was not found for serum HER4 (p = 0.054). The lack of significant differences in the HER4 levels in the two patient populations could be due to relatively low serum levels of HER4 as suggested by the low reference limit (1.8 µg/L), and that changes in the serum levels could not be detected because many of the patients had already started treatment when the samples were collected. However, earlier studies have shown that HER2 and HER3 overexpression is generally associated with poor prognosis, whereas high expression of HER4 is associated with better outcome. 28 Heterodimers of HER2–HER3 are also known to be the most potent activated form of HER2 in terms of strength of interaction and down-stream signaling, and HER3 might even be a necessary partner for HER2-mediated oncogenic activity in HER2-overexpressing tumors. 35 In addition, circulating HER3 has been demonstrated and found to be a serum marker for early hepatoma in patients with chronic hepatitis and cirrhosis.36,37 Thus, our observations of elevated serum levels of HER3 in the patients with HER2-positive primary tumors agree with these earlier studies and support the theory of up-regulated expression of other EGF receptor family members as a potential mechanisms of resistance to trastuzumab. 8
There was good agreement between the new HER2 IFMA assay and the established CLIA HER-2/neu assay from Siemens. However, the new IFMA tended to give lower results than the CLIA by between −44.9 and −36.5 µg/L. Differences in the assay antibodies characteristic and a lower reference limit (12.5 µg/L) compared to the CLIA reference limit (15.2 µg/L) may partly explain these discrepancies. Another factor could be dynamic changes in the extracellular domain of the receptor in relation with transcriptional, translational, and post-translational modifications, and thus the availability of the individual epitopes for the assay antibodies. It is known that their exists naturally occurring receptor isoforms that consist of varying proportions of the extracellular domain sequences which are generated either by alternative RNA slicing or by proteolytic cleavage.38,39
Anti-HER3 and anti-HER4 agents are an active and new area of investigation. 40 However, this should be accompanied with biomarkers that may predict therapeutic response and indicators of whether a tumor is dependent on the HER pathway as a driver for growth and proliferation. Thus, our new specific antibodies for HER2, HER3 and HER4 may prove valuable in the development of novel anti-HER targeted therapies with sensitive immunoassays for measuring serum levels of the respective targets.
We here describe specific and sensitive assays for HER2, HER3, and HER4 with validated reference values that might be useful in monitoring treatment and follow-up of patients with breast cancer. The assays should be evaluated in larger and clinically well-characterized populations with cancer.
Footnotes
Declaration of conflicting interests
The author(s) declared no potential conflicts of interest with respect to the research, authorship, and/or publication of this article.
Funding
The author(s) received no financial support for the research, authorship, and/or publication of this article.