
Abstract
Calponin family members are actin filament–associated regulatory proteins with distinct expression patterns. Previous studies on CNN2 (calponin 2) have demonstrated that CNN2 is expressed in a broad range of tissues and cell types, exhibiting potential regulatory roles in a number of cellular activities, including cell proliferation, cell migration, and platelet adhesion. In this work, we found that both messenger RNA and protein expression levels of CNN2 were remarkably upregulated in 60%–70% of gastric cancer tissues by comparison with those of neighboring non-tumorous mucosa. By utilizing specific shCNN2 (small hairpin RNA targeting CNN2), the potential role of CNN2 in regulating AGS gastric cancer cell growth was then further investigated. AGS cells infected with shCNN2 exhibited significantly decreased cell growth ability by comparison with control cells in vitro. Moreover, while there was no obvious difference in cell cycle distribution between two groups, enhanced cell apoptosis was detected in cells with reduced CNN2 expression. Consistently, caspase 3/7 activity was also remarkably activated upon shCNN2 lentivirus infection. Taken together, our results demonstrated that knockdown of endogenous CNN2 in AGS cells could significantly activate cell apoptosis pathway and therefore suppress cell growth in vitro. The deletion of CNN2 might be a potential therapeutic approach to inhibit aggressive growth of gastric cancer.
Introduction
Calponin, originally cloned in chicken gizzard smooth muscle, is an actin filament–associated regulatory protein as well as an inhibitor of actin-activated myosin ATPase. 1 There are three calponin isoforms in human genome: a basic calponin (CNN1) encoded by CNN1, a neutral calponin (CNN2) encoded by CNN2, and an acidic calponin (CNN3) encoded by CNN3.2–4 The protein structure of these isoforms consists of a conserved N-terminal calponin homology (CH) domain, a conserved middle region containing two actin-binding sites, and a C-terminal region which is variable among three isoforms. Evidence is accumulating to demonstrate that calponins bind to many other cytoskeleton proteins in addition to actin, including tropomyosin, myosin, tubulin, and so on.5–8 It is also well accepted that calponins are deeply involved in many cellular activities related to cytoskeleton regulation, such as cell proliferation, cell migration, cell adhesion, cell differentiation, and so on. 1
Despite sharing the conserved sequences, three calponin isoforms exhibit distinct expression patterns, which is in accord with their different biological functions. CNN1 expression is restricted to smooth muscle cells. CNN1 is an inhibitory regulator of smooth muscle contractility through inhibiting actin–myosin interactions. 9 CNN3 is expressed in adult neurons and embryonic trophoblasts, suggesting its role in modulating neural plasticity and embryonic development.10,11 Consistently, Cnn3 knockout mice had severe defects in the development of central nervous system. 12 Relative to CNN1 and CNN3, CNN2 exhibits a broader expression pattern in both smooth muscle cells and non-muscle cells. Consistently, various cellular functions of CNN2 besides cytoskeleton regulation have been reported in different cell types. Liu and Jin 1 raised a hypothesis that there are three groups of cell types exhibiting CNN2 expression, including cells physiologically under high mechanical tension, cells with high rates of proliferation, and cells actively migrating. Expression regulation studies indicate that CNN2 expression is regulated by mechanical tension in the cytoskeleton in epidermal keratinocytes and fibroblast cells. 13 Recent studies have investigated CNN2 expression in breast cancer, prostate cancer, and so on, indicating a potential role of CNN2 in regulating tumor growth.14,15 However, the expression pattern and biological function of CNN2 in other cancer types are yet to be further determined. Gastric cancer (GC), developing from the inner lining of stomach, remains one of the most lethal malignancies worldwide. Understanding of the molecular pathogenesis of GC carcinogenesis and tumor development will bring insights into clinical diagnosis and target therapy. Herein, we first investigated CNN2 expression in paired GC tissues through quantitative real-time polymerase chain reaction (qRT-PCR), western blotting, and immunohistochemical staining. All the findings demonstrated a remarkable upregulation of CNN2 expression in GC tissues. By utilizing a lentivirus vector expressing CNN2 small interfering RNA (siRNA), the regulatory effect of CNN2 on cell proliferation, cell cycle, and cell apoptosis was examined. We provide evidence that CNN2 promotes GC cell survival and cell growth in vitro. These results have implications for understanding the potential function of CNN2 in GC development.
Materials and methods
Patient tissue specimens
In total, 23 GC patients who underwent primary surgical resection in Zhongshan Hospital affiliated to Fudan University (Shanghai, China) were included in this study. Clinical GC tissues and their corresponding non-cancerous tissue specimens were obtained from patients who provided consent. None of the patients had received radiotherapy or chemotherapy before surgery. Tissue fragments were immediately frozen in liquid nitrogen at the time of surgery and stored at −80°C until use. Informed consents were obtained from all patients to approve the use of their tissues for research purposes. The study approval was obtained from the Medical Ethics Committee of Zhongshan Hospital, Fudan University, P.R. China.
Quantitative real-time PCR
Total RNA was extracted using TRIzol reagent (Invitrogen, USA), and 500 ng of RNA was applied to reverse transcription using a PrimeScript™ RT Reagent Kit with gDNA Eraser (TaKaRa, Japan). Real-time PCR analysis was performed using the SYBR Green Supermix Kit (TaKaRa) with a CFX Connect™ real-time PCR detection system (Bio-Rad, USA). Cycle parameters were 95°C for 5 min for a hot start, followed by 40 cycles of 95°C for 5 s, 58°C for 10 s, and 72°C for 20 s. Blank controls with no complementary DNA (cDNA) templates were performed to rule out contamination. The PCR specificity was confirmed by melting curve analysis. CNN2 primers were as follows—forward: 5′-GAGACCTGGGCTTGGAAG-3′ and reverse: 5′-CTGAAACTTGCGGGCATA-3′. The expression levels of all genes were normalized to those of the housekeeping gene 18S ribosomal RNA (rRNA). The primer sequences for 18S rRNA were as follows—forward: 5′-GTAACCCGTTGAACCCCATT-3′ and reverse: 5′-CCATCCAATCGGTAGTAGCG-3′. Relative gene expression levels were calculated by the formula 2−ΔCt, where ΔCt (Critical threshold) = Ct of genes of interest − Ct of 18S rRNA.
Western blotting
Protein samples were separated on a 10% sodium dodecyl sulfate–polyacrylamide gel electrophoresis (SDS-PAGE) gel and then transferred to polyvinylidene difluoride (PVDF) membranes. The PVDF membranes were blocked in 5% fat-free milk at room temperature for 1 h. After blocking, the membranes were incubated in specific primary antibodies against different proteins at 4°C overnight, followed by further incubation with horseradish peroxidase (HRP)-conjugated secondary antibody at room temperature for 45 min. Immunoreactivity was visualized by enhanced chemiluminescence (Pierce, USA) using the Molecular Imager ChemiDoc XRS+ System (Bio-Rad). Antibodies used in this experiment included the mouse monoclonal antibody against CNN2 (Proteintech, USA), β-actin (Sigma, USA), peroxidase-conjugated goat anti-mouse IgG and goat anti-rabbit IgG (Jackson, USA). All the western blots are quantified and the pictures are representatives of independent experiments.
Tissue immunohistochemical staining
Fresh tissues were embedded in paraffin before being subjected to immunohistochemical analysis conducted by Shanghai Genechem Co., Ltd (Shanghai, China). Briefly, endogenous peroxidases were first blocked with H2O2. After blocking with bovine serum albumin (BSA), the slides were incubated with anti-CNN2 antibody (Sigma), followed by biotinylated secondary antibody. The immunosignal was amplified by the avidin-biotin complex and visualized by diaminobenzidine. Control samples were prepared in the same way and stained with buffer instead of primary antibody. For H&E staining, tissue sections were immersed in filtered Harris hematoxylin and then in eosin for 1–2 min. All the images were acquired using a LEICA DC 500 camera on a microscope equipped with LEICA DMRA2 fluorescent optics (Leica Biosystems, Germany).
RNA interference target sequence screening and small hairpin RNA lentivirus plasmid construction
CNN2 siRNA target sequence (5′-TGAAGGATGGAACTATCTT-3′) and a non-silencing control were designed and synthesized by Shanghai Genechem Co., Ltd. Small hairpin RNA (shRNA) lentivirus plasmid expressing CNN2 shRNA was constructed by Shanghai Genechem Co., Ltd. Briefly, oligonucleotides corresponding to CNN2 siRNA sequence were synthesized and annealed to form double-stranded DNA, which was linked with linear lentivirus plasmid GV115 (carrying green fluorescent protein (GFP) coding sequence) to form recombinant plasmid (designated as shCNN2). The recombinant plasmid expressing non-silencing siRNA was designated as shCtl.
Cell culture and lentivirus infection
GC cell line AGS was cultured in Ham’s F12 medium (F12), supplemented with 10% fetal bovine serum at 37°C in a 5% CO2 humidified atmosphere. All cell culture reagents were purchased from Gibco. AGS cells were seeded on six-well plates at a density of 2 × 10⁵/well. Next day, the cells were infected with lentivirus at a multiplicity of infection (MOI) of 10. The GFP fluorescence signal was investigated 48 h after infection to ensure the infection efficiency.
Cell proliferation assay
AGS cells were plated at a density of 2000 cells/well on 96-well plates with complete medium. Cells with GFP signals were counted by Cellomics Array Scan VTI HCS Reader (Nexcelom, USA). Cell growth curves were drawn (n = 6). Alternatively, cells in 96-well plates were subjected to the non-radioactive cell proliferation assay [3-(4,5-dimethylthiazol-2-yl)-5-(3-carboxymeth-oxyphenyl)-2-(4-sulfophenyl)-2H-tetrazolium, inner salt; MTS] according to the manufacturer’s instructions (Promega, USA). Briefly, after culture medium was replaced with MTS-containing medium, the cells were then kept at 37°C for 4 h. The absorbance was measured at a wavelength of 490 nm by a microtiter reader (Bio-Rad). The cell growth curve was calculated using the absorbance values (n = 6).
Flow cytometry analysis of cell cycle
Trypsin-digested AGS cells were stained with propidium iodide (50 mg/mL) together with RNase (100 mg/mL) for 15 min at room temperature before analyzing with FACSCalibur (BD Biosciences, USA). At least 10,000 cells were acquired and analyzed for each sample through CellQuest program. The percentages of cells residing in G1, S, and G2 phases were then counted using ModiFit software. Results are representatives of three independent experiments and consistent results were gained.
Flow cytometry analysis of cell apoptosis
Trypsin-digested cells were stained with Annexin V for 15 min at room temperature before analyzing with FACSCalibur (BD Biosciences). Annexin V positive cells were corresponding to the apoptotic population. Results were representatives of three independent experiments and consistent results were gained.
Caspase 3/7 activity assay
The caspase 3/7 activity was investigated according to the manufacturer’s instructions (Promega). Briefly, AGS cells were first replated on a 96-well plate. Next day, the Caspase-Glo 3/7 reagent was prepared and allowed to equilibrate at room temperature. After the culture medium was mixed with Caspase-Glo 3/7 reagent, the cells were kept at room temperature for 1.5 h. Results were obtained using GloMax 96 Microplate Luminometer (Promega).
Statistical analysis
Comparisons of quantitative data were analyzed by Student’s t test. Categorical data were analyzed by Fisher’s exact test. We considered p < 0.05 to be different (*) and p < 0.01 to be significantly different (**).
Results
CNN2 was upregulated in GC tissues
In order to explore the potential function of CNN2 in GC, we first investigated its expression pattern in GC specimens paired with their corresponding neighboring non-tumorous specimens. Quantitative real-time PCR analysis was carried out using specific primers targeting CNN2 gene in 10 paired specimens. As shown in Figure 1(a), 6 out of 10 (60%) cases exhibited obvious upregulation of CNN2 in GC in contrast to paired neighboring non-tumorous mucosa. The average fold change of CNN2 messenger RNA (mRNA) in cancer tissues relative to non-tumorous tissues (C/N) was 2.17. In addition, by utilizing ONCOMINE cancer database, a consistent upregulated expression pattern of CNN2 was found in three different subtypes of GC compared with gastric mucosa in DErrico’s mRNA dataset (Figure 1(b)). 16 To confirm this expression pattern at mRNA level, total protein of another 10 paired GC specimens was extracted and subjected to western blotting. As shown in Figure 1(c) and (d), endogenous CNN2 was detected to be around 35 kDa. Among 10 paired tissues, 7 cases showed significant upregulation of CNN2 protein in GC in comparison with neighboring non-tumorous tissues. Histological sections from GC tissues were also prepared for detecting CNN2 protein expression. As shown in Figure 1(e), CNN2 was mainly cytoplasmically distributed in these tissue specimens. More importantly, although low CNN2 signal was detected in some stromal cells of the normal mucosa, GC cells exhibited much stronger CNN2 immunostaining signals. Taken together, these data provided strong evidence that CNN2 is remarkably upregulated in GC tissues.
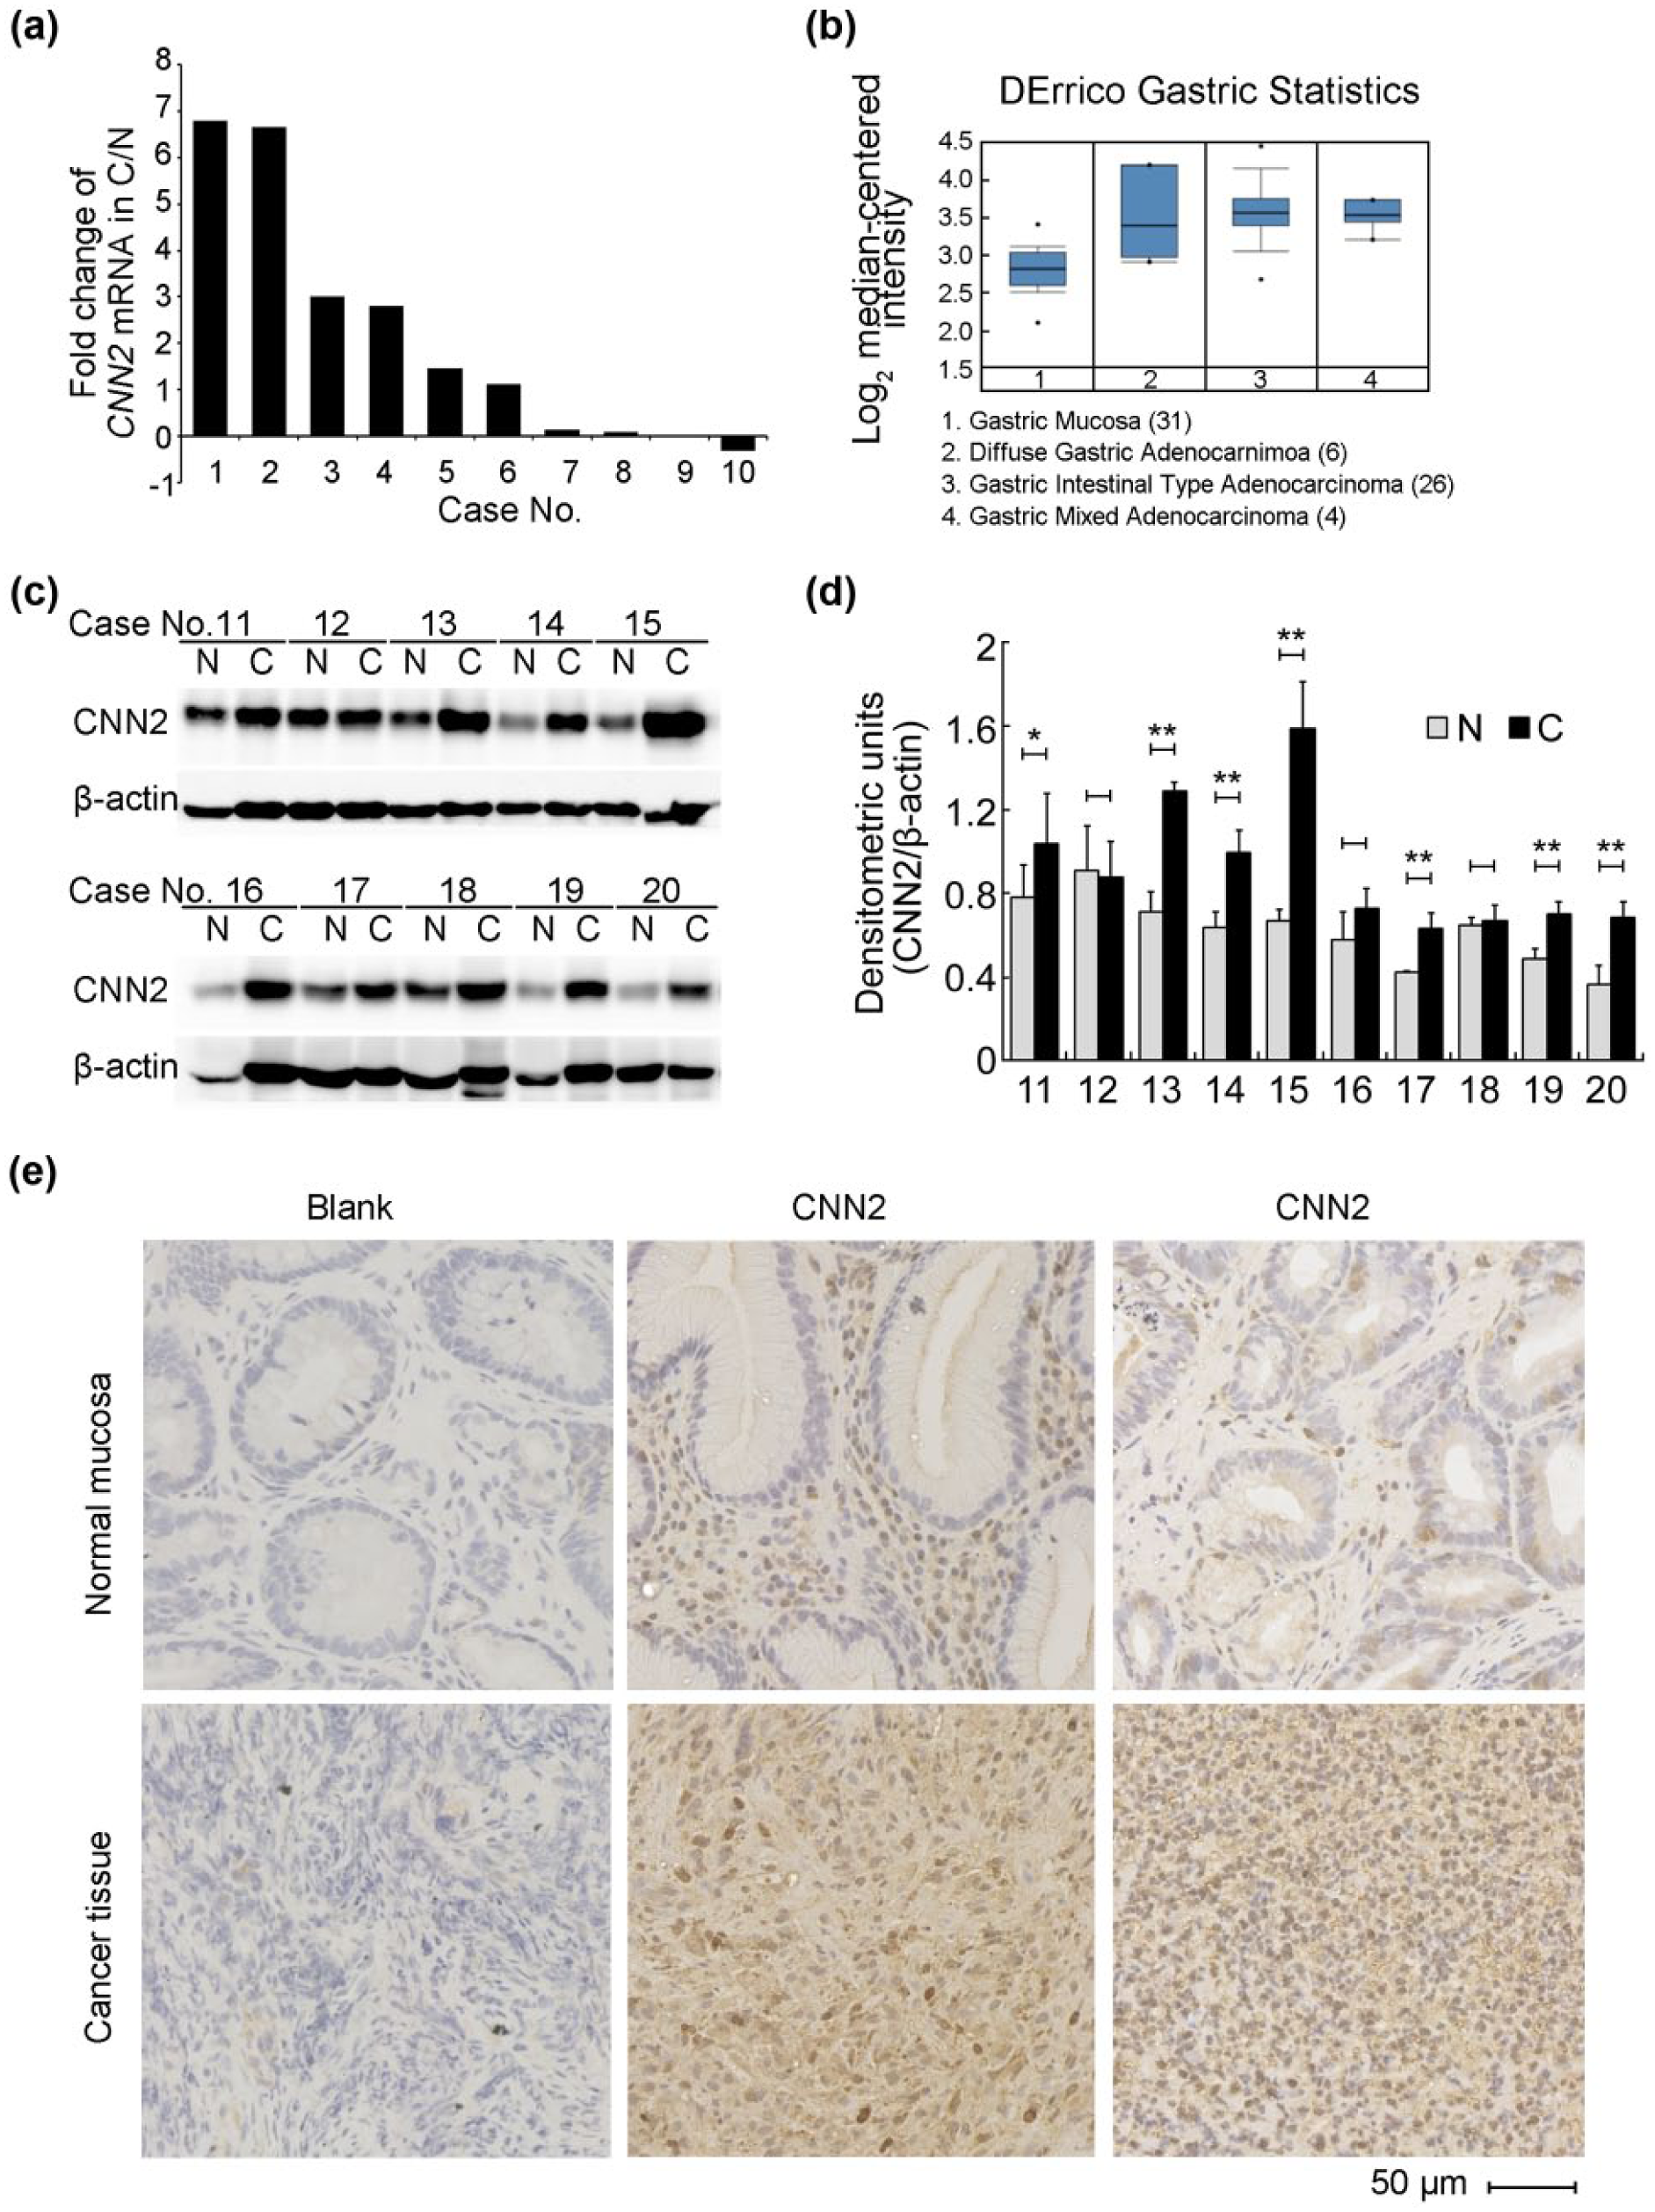
CNN2 expression pattern in paired GC tissues. (a) Fold changes of CNN2 mRNA level in 10 GC tissues (C) relative to their corresponding non-tumorous tissue mucosa (N) analyzed by qRT-PCR using specific CNN2 primers. 18S rRNA is used as an internal control. (b) CNN2 mRNA expression in normal gastric mucosa, diffuse gastric adenocarcinoma, gastric intestinal type adenocarcinoma, and gastric mixed adenocarcinoma from published dataset are extracted from ONCOMINE. Log2 median-centered intensity of CNN2 mRNA was shown at y axis. Numbers in parentheses indicate sample numbers. (c) CNN2 protein level in another 10 GC tissues (C) and their corresponding non-tumorous mucosa (N) analyzed by western blotting using the anti-CNN2 antibody. β-actin is used as a loading control. (d) The densitometric values of (c) are indicated as the mean ± SD (n = 3). (e) Representative pictures of histological sections of GC tissues and their corresponding normal musoca stained with anti-CNN2 antibody. Blank control group were incubated with dilution buffer instead of primary antibody (scale bar: 50 µm).
Inhibition of CNN2 expression in AGS cells through lentivirus-mediated RNA interference
Based on the upregulated levels of CNN2 expression in GC specimens, we utilized lentivirus to knockdown endogenous CNN2 in GC cells to further explore its biological functions. Specific siRNAs targeting CNN2 were introduced into a lentivirus-based expression plasmid to generate shCNN2 lentivirus. A control lentivirus (shCtl) expressing non-silencing siRNA was also generated. Next, AGS cells with relatively high endogenous CNN2 expression level were chosen for further experiments. The highest infection efficiency was obtained at a MOI of 10 as more than 80% of AGS cells exhibited GFP signal 72 h after lentivirus infection (Figure 2(a)). The gene silencing effect of shCNN2 was investigated using qRT-PCR and western blotting. As shown in Figure 2(b), the mRNA expression level of CNN2 was reduced to ~30% compared with the control cells. The protein level of CNN2 was also remarkably suppressed in shCNN2-infected cells by comparison with control cells (Figure 2(c)).

Knockdown of endogenous CNN2 in AGS cells. (a) Representative pictures of AGS cells infected with shCNN2 or shCtl lentivirus (scale bar: 50 µm). (b) Endogenous CNN2 mRNA levels in AGS cells were investigated through qRT-PCR. 18S rRNA is used as an internal control. (c) Endogenous protein levels in AGS cells were investigated through western blotting. β-actin is used as a loading control. Representative images are shown in the upper panel, and the densitometric values are indicated in the bottom panel as the mean ± SD (n = 3).
Inhibition of CNN2 expression in AGS cells suppressed cell growth in vitro
After the endogenous CNN2 expression of AGS cells was successfully knocked down through lentivirus infection, the cells were cultured and subjected to Cellomics analysis. As shown in Figure 3(a), although cells infected with control lentivirus were proliferated very fast during the 5-day culture, cells infected with lentivirus expressing siCNN2 grew much slower according to the intensity of GFP signal. Significant differences in cell numbers between shCNN2-infected cells and control cells were shown in a calculated cell proliferation curve (Figure 3(b)). To confirm our finding, the cell growth ability was further investigated through 3-(4,5-dimethylthiazol-2-yl)-2,5-diphenyltetrazolium bromide (MTT) assay. Figure 3(c) displayed the growth curve calculated using the absorbance values of AGS cells at 490 nm. Consistently, reduced cell growth ability was observed in cells infected with shCNN2 lentivirus compared with control AGS cells. All these results strongly suggest that the knockdown of endogenous CNN2 leads to suppressed cell growth.

Cell growth ability of AGS infected with shCNN2 or shCtl. (a) Representative fluorescence pictures of AGS cells during a 5-day culture period. (b) A 5-day cell proliferation curve of AGS cells according to the cell numbers read by Cellomics. Values are indicated as mean ± SD (n = 6). (c) A 5-day cell growth curve of AGS cells according to the absorbance at a wavelength of 490 nm read by a microtiter reader. Values are indicated as mean ± SD (n = 6).
Inhibition of CNN2 expression in AGS cells induced cell apoptosis
The suppressive effect of shCNN2 in cell growth indicated a potential function of CNN2 in the regulation of cell cycle and/or cell apoptosis, thus we further investigated the cell cycle distribution and cell apoptosis level of AGS cells after lentivirus infection. The cell cycle was first analyzed through flow cytometer. As shown in Figure 4(a), no obvious difference was discovered between the cells expressing shCtl and those expressing shCNN2, indicating that CNN2 might have little effect on regulating cell cycle. Cells were then subjected to Annexin V staining to investigate the effect of CNN2 on cell apoptosis. The representative pictures and the statistical data are shown in Figure 4(b) and (c), respectively. Although shCtl lentivirus had no obvious effect (7.03% ± 0.15%) in inducing cell apoptosis, nearly half of the shCNN2-infected cells (47.09% ± 0.20%) underwent cell apoptosis. To further verify the effect of CNN2 on cell apoptosis, both shCNN2 cells and control cells were cultured on a 96-well plate and subjected to Caspase-Glo 3/7 activity analysis. As shown in Figure 4(d), consistent with the results of Annexin V staining, the cells expressing shCNN2 exhibited significantly higher level of caspase 3/7 activity than those expressing shCtl. In summary, these results indicated that CNN2 plays an essential role in regulating cell viability.

Effect of shCNN2 on regulation of cell cycle and cell apoptosis. (a) Cell cycle distribution of AGS cells infected with shCNN2 or shCtl lentivirus. S-phase cell percentages are indicated. (b) Cell apoptosis analysis of AGS cells infected with shCNN2 or shCtl lentivirus through Annexin V staining. Annexin V positive cells are considered as apoptotic cells. (c) Statistical analysis of cell apoptosis levels in AGS cells. Values are indicated as mean ± SD (n = 3). (d) Statistical analysis of caspase 3/7 activity in AGS cells. Values are indicated as mean ± SD (n = 3).
Discussion
Our study first presents several lines of evidence that CNN2 is upregulated in GC tissues compared with paired counterpart normal mucosa from clinical stomach cancer patients. Some previous studies have reported abnormal CNN2 expression in other cancer tissues and cell lines. For example, it was revealed that CNN2 was one of nine genes overexpressed in rectal carcinoma cells by comparison with normal rectal cells (SSH). 17 Similarly, CNN2 was also one of the genes with increased expression in cutaneous squamous cell carcinoma by comparison with normal skin tissues. 18 Debald et al. 14 developed a sandwich enzyme-linked immunosorbent assay (ELISA) to analyze the serum levels of CNN2 proteins and they found that the mean serum level of CNN2 in breast cancer patients was significantly higher than that in healthy control patients or patients with benign breast disease. However, the diminished expression of CNN2 was reported in prostate cancer tissues and cell lines through western blotting and immunohistochemical staining. 15 These discrepancies might be explained by the cancer heterogeneity but their molecular mechanism requires further investigation. Hossain et al. 19 has previously reported that in contrast to a developmental upregulation of Cnn1, the expression of Cnn2 gradually decreased to low levels during the mouse embryo development and remained at low level in quiescent stomach cells. Based on our observation that CNN2 expression is remarkably upregulated in GC tissues, we propose that CNN2 expression might help stomach cells gain indefinite proliferation ability as it does during early embryo development. However, this hypothesis remains to be demonstrated experimentally. Promoter analysis of mouse Cnn2 identified a binding site for HES-1 (hairy and enhancer of split 1), a transcriptional factor responsible for transcriptional activation of Cnn2. As a member of the basic helix-loop-helix (bHLH) family, HES-1 plays multiple roles in cancer, including maintaining cancer stem cells (CSCs), promoting metastasis, and antagonizing drug-induced apoptosis. 20 As such, it would be interesting to further analyze the correlation between HES-1 and CNN2 expression in GC tissues.
Functional studies of CNN2 focus on various cytoskeleton-based functions, including cell division, cell adhesion, cell migration, and so on. CNN2 regulates cell division by inhibiting the activity of the filament-protein backbone. 19 Macrophages isolated from Cnn2 knockout mice showed reduced spreading in adhesion culture together with decreased tropomyosin in the actin cytoskeleton. 21 Recently, a novel role of CNN2 in regulating whole blood thrombosis and platelet adhesion has been revealed in conditional Cnn2 knockout mice. 22 Cnn2 knockdown resulted in neural crest cell (NCC) migration defects in frogs and chicks together with the randomized outgrowth of cell protrusions in NCC explants. 23 In this study, we report a functional role of CNN2 in regulating cancer cell growth. Compared with the control group, the growth ability of AGS cells infected with shCNN2 lentivirus was inhibited, and the cell apoptosis level and the activity of caspase 3/7 were induced. We also speculate that the role of CNN2 in cell growth and survival might be dependent on many factors such as the endogenous CNN2 expression level, cell type, developmental stage, and pathological status.
However, the mechanism or the signaling pathway by which CNN2 is involved in cell proliferation and cell apoptosis control is yet to be completely understood. It has been reported that cytoskeleton tension is able to regulate both gene expression and protein degradation of CNN2.13,24 It is also widely accepted that physical forces including tension play essential roles in regulating cell proliferation and survival. 25 In general, physical forces act through specific membrane receptors and cytoskeleton molecules, which in turn activates specific intracellular signaling pathways such as mitogen-activated protein kinase (MAPK) and C-jun n-terminal kinase (JNK) to amplify the signal, and finally activate caspases to promote apoptosis. So we raise a hypothesis that the proper expression level of CNN2 is critical to maintain the physiological equilibrium of cytoskeleton during cell proliferation and survival. Brockstedt et al. 26 identified CNN2 as 1 of the 12 apoptosis-associated proteins in human Burkitt’s lymphoma, whose intensity decreased significantly in the 2-DE pattern of apoptotic cells compared with that of non-apoptotic cells. Moreover, Chen et al. 27 found that overexpression of prostacyclin protects vascular smooth muscle cells against degradation of CNN2 and cell apoptosis, which could be prevented by caspase 3 inhibitor. Combined with our finding that CNN2 knockdown could activate caspase 3/7 activity, these results suggest that CNN2-mediated cell apoptosis is probably caspase dependent. However, the functional cooperative partners and the entire signaling pathway of CNN2 in regulating cell behaviors still remain to be answered in the near future.
In summary, our studies using paired GC specimens and cultured GC cell lines suggest that overexpression of CNN2 is responsible for tumor progression in GC. Clarification of the underlying molecular mechanism would provide a novel therapeutic approach against GC.
Footnotes
Acknowledgements
The authors thank Dr Lu Zhang (University of Arkansas, Fayetteville, AR, USA) for her helpful discussion.
Authors’ note
Authours Jianwei Hu, Quanlin Li and Meidong Xu, are also affiliated to Shanghai Engineering and Research Center of Diagnostic and Therapeutic Endoscopy, Shanghai, P.R. China
Declaration of conflicting interests
The author(s) declared no potential conflicts of interest with respect to the research, authorship, and/or publication of this article.
Funding
The author(s) disclosed receipt of the following financial support for the research, authorship, and/or publication of this article: This project was supported by the National Natural Science Foundation of China (No. 31000558) and grants from Shanghai Committee of Science and Technology (No. 16DZ2280900).