
Abstract
The epithelial–mesenchymal transition is the key process driving cancer metastasis. MicroRNA-194 inhibits epithelial–mesenchymal transition in several cancers and its downregulation indicates a poor prognosis in human endometrial carcinoma. Self-renewal factor Sox3 induces epithelial–mesenchymal transition at gastrulation and is also involved epithelial–mesenchymal transition in several cancers. We intended to determine the roles of Sox3 in inducing epithelial–mesenchymal transition in endometrial cancer stem cells and the possible role of microRNA-194 in controlling Sox3 expression. Firstly, we found that Sox3 and microRNA-194 expressions were associated with the status of endometrial cancer stem cells in a panel of endometrial carcinoma tissue, the CD133+ cell was higher in tumorsphere than in differentiated cells, and overexpression of microRNA-194 would decrease CD133+ cell expression. Silencing of Sox3 in endometrial cancer stem cell upregulated the epithelial marker E-cadherin, downregulated the mesenchymal marker vimentin, and significantly reduced cell invasion in vitro; overexpression of Sox3 reversed these phenotypes. Furthermore, we discovered that the expression of Sox3 was suppressed by microRNA-194 through direct binding to the Sox3 3′-untranslated region. Ectopic expression of microRNA-194 in endometrial cancer stem cells induced a mesenchymal–epithelial transition by restoring E-cadherin expression, decreasing vimentin expression, and inhibiting cell invasion in vitro. Moreover, overexpression of microRNA-194 inhibited endometrial cancer stem cell invasion or metastasis in vivo by injection of adenovirus microRNA-194. These findings demonstrate the novel mechanism by which Sox3 contributes to endometrial cancer stem cell invasion and suggest that repression of Sox3 by microRNA-194 may have therapeutic potential to suppress endometrial carcinoma metastasis. The cancer stem cell marker, CD133, might be the surface marker of endometrial cancer stem cell.
Keywords
Background
Endometrial carcinoma (EC) is the second most common female malignancy in China after cervical cancer. 1 The most common subtype, endometrioid adenocarcinoma (EAC), accounts for approximately 75% of EC cases. 1 One risk factor for EC is obesity, as obese women have up to nine times the risk of developing EC as their normal-weight counterparts. 2 Recently, several microRNAs (miRNAs or miR) were found to regulate body fat.3–5 In addition, elevated estrogen levels correlate with EC, and estrogen regulates miRNA expression in the endometrium. 6 Therefore, miRNAs may play an important role in endometrial carcinogenesis.
Previously, Klinge 6 and Wu et al. 7 reported the expression profile of mammalian miRNAs in human EAC and found that miR-205, miR-449, and miR-429 were greatly enriched and miR-204, miR-99b, and miR-193b were greatly downregulated in adenocarcinoma tissues. Zhai et al. 8 reported that the downregulation of miR-194 indicated a poor prognosis in EC.
The presence of endometrial cancer stem cells (ECSCs) was demonstrated by Hubbard et al. 9 Some core stem cell transcription factors (TFs), which can maintain the pluripotency of stem cells, are also expressed in CSCs and are important for the pluripotency of ECSCs.10,11 Sox3 is an important stem cell TF that plays a role in embryo development12–14 and can induce aberrant cell growth. 15 Thus, the goal of this study was to examine Sox3 expression in EC and its association with miR-149 in ECSCs.
Methods
Culture of endometrial tumorspheres
This study was approved by the Medical Ethics Committees of Hubei University of Medicine (No. HUMAEC32-33-1, Hubei, China). All patients provided informed written consent before participating in this study. The method of culturing tumorspheres was described in our previous report. 10 Briefly, 19 EAC samples (stage IB, n = 11; stage IC, n = 5; stage IIa, n = 3; age = 37–72 years) were washed with phosphate-buffered saline (PBS) containing 500 U/L penicillin G (Gibco, USA) and 500 mg/L streptomycin (Gibco) to remove blood cells after surgery. Tumors were cultured in stem cell medium (Dulbecco’s modified Eagle’s medium/nutrient mixture F-12 (DMEM/F-12, 10 ng/mL basic fibroblast growth factor (bFGF), 10 U/mL leukemia inhibitory factor, 1 × 10⁵ U/L penicillin, and 100 mg/L streptomycin). Clones >50 cells were recognized as tumorspheres. Tumorspheres were dissociated every 7–10 days by incubation in a non-enzymatic cell-dissociation solution (Sigma Aldrich, USA) for 2 min at 37°C and passaged at 1 × 10³ cells per 100-mm plate. Tumorspheres differentiated completely ~8 days after removing bFGF from the stem cell medium.
Construction of mutant adenovirus Sox3 vectors and transient transfections
The complementary DNA (cDNA) of Sox3 was purchased from Wuhan Chaoying Biological Company (Wuhan, China). Mutated constructs in the Sox3 3′-untranslated region (3′-UTR), predicted to be miR-194 target sequence, were synthesized using the QuikChange II Site-Directed Mutagenesis Kit (Stratagene, USA). The primers were designed by Stratagene using software (http://labtools.stratagene.com/QC) and are shown in Table 1. We mainly deleted miR-194 target sequences (six base pairs (bp)). Adenoviral vectors expressing Sox3 under control of the U6 promoter were produced by transient transfection of HEK293T cells. If dissociated tumorspheres were used, the cells were split at a 1:2 ratio in 24-well or 6-well plates coated with Matrigel. FuGENE HD Transfection Reagent (Promega, USA) was used according to the manufacturer’s instructions. All adenovirus vectors used for the experiments had comparable titers ranging from 1 × 10⁸ to 1 × 10⁹ transducing functional units per milliliter. Viral suspensions were stored at −80°C until use.
siRNA sequences.

siRNA: small interfering RNA; GAPDH: glyceraldehyde 3-phosphate dehydrogenase.
Colony-forming assays
We followed the procedure of Hubbard et al. 9 for performing colony-forming assays. Briefly, single EC cells, dissociated tumorspheres, or transfected cells were cultured in DMEM/F-12 supplemented with 10% fetal calf serum (FCS; Life Technologies, USA), 2 mmol/L glutamine (Invitrogen, USA), 1 × 10⁵ U/L penicillin, and 100 mg/L streptomycin (Invitrogen). Cells were cultured at clonal densities of 100–300 cm−2 on 2% gelatin (Sigma, USA)-coated tissue cultures (BD Biosciences, USA) at 37°C in 5% CO2 in air. Cloning plates were monitored daily, and media was changed every 2–3 days until cell adhesion. After 28 days of culture, plates were fixed in 10% formaldehyde/PBS for 10 min and stained with Harris hematoxylin. Clones (>50 cells) were counted on ⩾3 plates per sample and averaged. Colony-forming efficiency was determined as a percentage (number of colonies)/(number of cells seeded) × 100.
Flow cytometric analyses
Dissociated tumorspheres or adenovirus vector-transfected cells were grown in six-well plates and collected for flow cytometric staining and quality control. Briefly, cells were resuspended in flow cytometry buffer (PBS containing 2% FBS and 0.1% sodium azide). All samples were assessed using a FACSCalibur system (BD Biosciences) according to the instructions from the instrument technicians of our facility. Acquisition was set for 10,000 events per sample. Cells were labeled with mouse anti-human CD146-FITC, CD133-FITC, and CD44-FITC or their isotype for CSC marker detection (Santa Cruz Biotechnology, USA). Data were analyzed using FACS (version 4.1.2; BD Biosciences). Triplicate samples were analyzed in each experiment.
RNA isolation and real-time polymerase chain reaction analyses
Total RNA was extracted using TRIzol Reagent (Invitrogen). MiRNA levels were assayed using TaqMan® probes and primer sets (Applied Biosystems, USA) according to the manufacturer’s instructions. For mRNA analyses, the first-strand cDNA was generated using the Reverse Transcription System Kit from Promega with random primers used for reverse-transcription polymerase chain reaction (RT-PCR) or quantitative real-time RT-PCR (qRT-PCR) using a Power SYBR Green PCR Master Mix (Applied Biosystems) protocol in a StepOnePlus System (Applied Biosystems). The level of GAPDH mRNA was used as the internal normalization control. For precise quantification of gene copies per cell, Sox3 or reverse-transcribed miR-194 cDNA was used as standard templates to formulate standard curves with limiting dilution analysis. Then, exact copies of Sox3 and miR-194 per cell were calculated according to their molecular weight and cell counts. Primer sequences are presented in Table 2.
Primers for Sox3 cDNA.

cDNA: complementary DNA.
Western blotting
Lysates were extracted from tumorspheres or cells. Proteins (20 µg) were separated on 10% sodium dodecyl sulfate–polyacrylamide gel electrophoresis (SDS-PAGE) gels and transferred to nitrocellulose membranes. The membranes were blocked in 5% skimmed milk in Tris-buffered saline with Tween 20 and then incubated with primary antibodies to Sox3, E-cadherin (E-cad), vimentin (Vim), or GAPDH (1:500 dilution; Santa Cruz Biotechnology) overnight at 4°C. After incubation with horseradish peroxidase–labeled secondary antibodies, membranes were developed using a SuperSignal® West Pico Trial Kit (Pierce, USA).
Immunohistochemical analyses
EC samples were fixed in phosphate-buffered 10% formalin (pH 7.2), embedded in paraffin, and cut into sections (thickness, 4 µm). Sections were dewaxed in xylene, dehydrated in alcohol, and incubated in 0.01 M sodium citrate buffer (pH 6.0) for antigen retrieval. Sections were incubated with 3% H2O2 for 30 min to block endogenous peroxidase activity and with normal mouse serum at 37°C for 15 min to block non-specific binding of antibody. Then, sections were incubated with Sox2 antibodies (1:100 dilution in PBS; Santa Cruz Biotechnology) for 2 h at room temperature, followed by incubation with biotinylated secondary antibody (Santa Cruz Biotechnology) and 3,3′-diaminobenzidine.
Transfection of adenovirus miRNA and miRNA inhibitors in tumorspheres
Dissociated tumorsphere cells were grown in stem cell medium. A total of 20–100 nM adenovirus small interfering RNAs (siRNAs) specifically targeting Sox3 (Ad-si-sox3, Cat. No. SR304529; OriGene, USA), scrambled (scr) sequence with no homology to the human genome (control (Con) group), and miR-194 inhibitor RNAs (Ad-si-miR-194, Cat. No. mh5282; Abcam, USA) were used to transfect each well according to the manufacturer’s instructions.
Cell invasion assay
Cell invasion was evaluated using 24-well Transwell® culture chambers, as previously described. 16 Cells were seeded at 5 × 10⁴ per well and cultured in stem cell medium for 28 days. Then, cells were fixed in methanol and stained with 5% crystal violet. After examination under a light microscope, cells were eluted with 33% acetic acid. Optical density values of the eluate were read using a Bio-Rad microplate reader at 590 nm.
Implantation of tumorspheres and tumorsphere-derived cells into nude mice
After dissociation of tumorspheres and tumorsphere-derived differentiated cells from 21 cervical cancer patients in a non-enzymatic cell-dissociation solution, cells were washed in serum-free Hank’s Balanced Salt Solution. Then, cells were suspended in a 1:1 (v/v) mixture of serum-free DMEM/F-12, and 1 × 10⁵ cells were injected (subcutaneously (s.c.)) into the right (differentiated cells) or left (tumorspheres) mid-abdominal area of nude mice using a 23G needle. Animals were subjected to necropsy 28 days after implantation, and tumor growth was assessed by measuring volume using the following formula: V = 1/2 × (L × W2). In the silence-miR-194 group, mice were sacrificed on day 14 after injection to avoid necrosis in transplanted tumors. A tail vein injection model was used for lung colonization assays to test the tumorsphere metastasis.
Statistical analyses
Data are represented as the mean ± standard error of the mean (SEM). For data relating to qRT-PCR and colony number, statistical comparisons between experimental groups were assessed using analysis of variance or the two-tailed Student’s t-test. Comparison of colony formation was achieved using Fisher’s exact test; p values <0.05 were considered significant.
Results
Expression of Sox3 and miR-194 is positively correlated with undifferentiated ECSCs
In stem cell culture medium, fresh EC tissues from 19 patients formed tumorspheres (19/19, 100%), and the median cloning efficiency from each EC was 0.41% ± 0.07% (range = 0.32%–1.03%). However, the cloning efficiency was higher in tumorspheres (21.34% ± 2.52%) than in differentiated cells (0.46% ± 0.08%; p < 0.001). Next, we examined the expression of Sox3 in EAC tissues. Sox3 transcripts were detected (15/17, 88.23%) in the EAC specimens, and Sox3-specific staining was visible in the cytoplasm and nucleus of the cancer cells (Figure 1(a)). We began by assessing the expression of Sox3 in ECSCs growing under tumorsphere conditions and differentiated conditions (removal of bFGF). In qRT-PCR analyses, a marked reduction in Sox3 was observed in all the differentiated tumorspheres. This finding suggests that Sox3 expression positively correlated with the levels of undifferentiated tumorspheres (Figure 1(b)). The qRT-PCR analyses revealed that Sox3 and miR-194 expression at different time points underwent dynamic changes, and their levels decreased according to the differentiated states of the tumorspheres (Figure 1(c)). The Sox3 expression was higher in tumorsphere than in the differentiated cells (Figure 1(d)). To find out the potential CSC markers in tumorsphere, we detected CD44, CD133, and CD146 expression in it and found that CD133+ cell was higher in tumorspheres than in differentiated tumorsphere, and it is indicated that CD133 might be a marker of ECSC, similar results were also reported by Nakamura et al. 17 However, CD44 and CD146 were highly expressed in tumorsphere or in differentiated tumorspheres; both of them do not recognize the ECSC marker (Figure 1(e)).

Sox3 expression decreases after the differentiation stage of endometrial tumorspheres (ETs). (a) In situ expression of Sox3 in EAC tissues (1000×). (b) Dynamic expression of Sox3 and miR-194 during tumorsphere (TS) differentiation according to qRT-PCR analyses. GAPDH was used as an internal normalization control; p < 0.001 upon comparison with levels in ETs and in differentiated cells (DCs; n = 3). (c) The colony formation after dissociated TS or differentiated cell cultured in stem cell medium (n = 3). (d) Western blot analysis of Sox3 expression in TS or DC (n = 3). (e) CD44, CD133, and CD146 expressions were detected by FCS in TS or DC.
Overexpression of Sox3 maintains the pluripotency in EAC tumorspheres
We further investigated the effects of overexpressed or knocked down Sox3 in the tumorspheres. After construction of vectors to overexpress Sox3 (Sox3–green fluorescent protein (GFP)), we transferred the vectors into tumorspheres. We found the percentage of GFP-positive cells to be 87%–91% (89% ± 1.8%) in the overexpressed Sox3-GFP group and 86%–90% (88% ± 2.3%) in the vector group among transfected tumorspheres by flow cytometry (Figure S1A). The expression of Sox3 increased 3-fold after transfection of Sox3 vector compared to the control (Figure 2(a)), and miR-194 expression decreased 5-fold after transfection of Sox3 vector compared to the control (Figure 2(b)). In addition, western blot analysis showed that colony formation increased in the stem cell medium (Figure 2(c)), E-cad expression decreased, and Vim expression increased in stem cell medium plus FCS after 28 days (Figure 2(d)).

Sox3 improves TS cell colony formation, invasion, and EMT. (a) Sox3 expression (Sox3 + vector) or its control (vector), (b) miR-194 level, (c) colony formation, and (d) EMT marker expression after transfection of Ad-sox3 (n = 3). (e) Sox3 expression or its control, (f) miR-194 level, (g) colony formation, and (h) EMT marker expression after transfection with adenovirus-silence-Sox3 (si-Sox3) or its control (empty vector, vector; n = 3).
Next, we decreased the expression of Sox3 by RNA interference, and Ad-si-Sox3 was transferred into the tumorspheres. Flow cytometry showed that the percentage of GFP-positive cells was 89%–92% (90% ± 1.5%) in the overexpressed si-Sox3-GFP group and 89%–91% (90 ± 0.9%) in the scr group among transfected tumorspheres by flow cytometry (Figure S1B). The expression of Sox3 decreased 4-fold compared to the scr group (Figure 2(e)), and miR-194 expression increased almost 5-fold (Figure 2(f)). Colony formation increased in the stem cell medium (Figure 2(g)), E-cad expression increased, and Vim expression decreased in stem cell medium plus FCS after 28 days (Figure 2(h)).
Mutation miR-194 seed sequence in Sox3 UTR did not affect miR-194 expression
We identified miR-194 potential target sequences in Sox3 using TargetScan software (Figure 3(a)). After mutation of miR-194 target sequences in Sox3 (Figure 3(b)), flow cytometric analyses revealed the percentage of GFP-positive cells to be 88%–90% (89% ± 1.1%) in the mutation (Mut) group. The Sox3 level did not significantly differ between the Mut group and the control (Con) group (carrying the 3′-UTR of Sox3 without mutation of the miR-194 seed sequence) by 24 or 48 h after transfection (p = 0.45 and 0.64, respectively; Figure 3(c)), and the miR-194 level was clearly lower in the Con group than in the Mut group or the wild-type (WT) group (without vector transfection; p = 0.012; Figure 3(d)).

Endogenous miR-194 represses the 3′-untranslated regions (UTRs) of Sox3 in the TS. (a) The predicted seed sequence in 3′-UTR of Sox3 by software TargetScan. (b) The diagram describing the mutation vector construction. Mutation (Mut) has a 6 bp deletion of the miR-194 target site. (c) The relative luciferase level of 3′-UTR luciferase reporters of Sox3 in TS under self-renewal conditions at 24 or 48 h after transfection. (d) MiR-194 level after transfection of Ad-Sox3 and UTR-mutation of miR-194 seed sequence (Mut), wild type (WT, without transfection vector), or its control (con, Ad-Sox UTR without mutation of miR-194 seed sequence).
miR-194 inhibits EMT process of tumorsphere
We transfected the Ad-pri-miR-194-GFP vector (Ad-pri-miR-194) or its control empty Ad vector (empty) into tumorspheres. Flow cytometry revealed the percentage of GFP-positive cells to be 88%–92% (90% ± 2.4%) in the pri-miR-194 group and 90%–92% (91% ± 1.5%) in the vector group (Figure S2A). The miR-194 level increased 3.5-fold (Figure 4(a)) and Sox3 expression decreased 3-fold (Figure 4(b)) compared to the controls. E-cad expression increased and Vim level decreased after transfection with Ad-pri-miR-194 (Figure 4(c)). As expected, invasive cells decreased in the miR-194 group compared to the control on the 28th day in stem cell medium plus 5% FCS (Figure 4(d)). Overexpreession of miR-194 also decreased CD133+ cells in tumorspheres (Figure 4(e)).
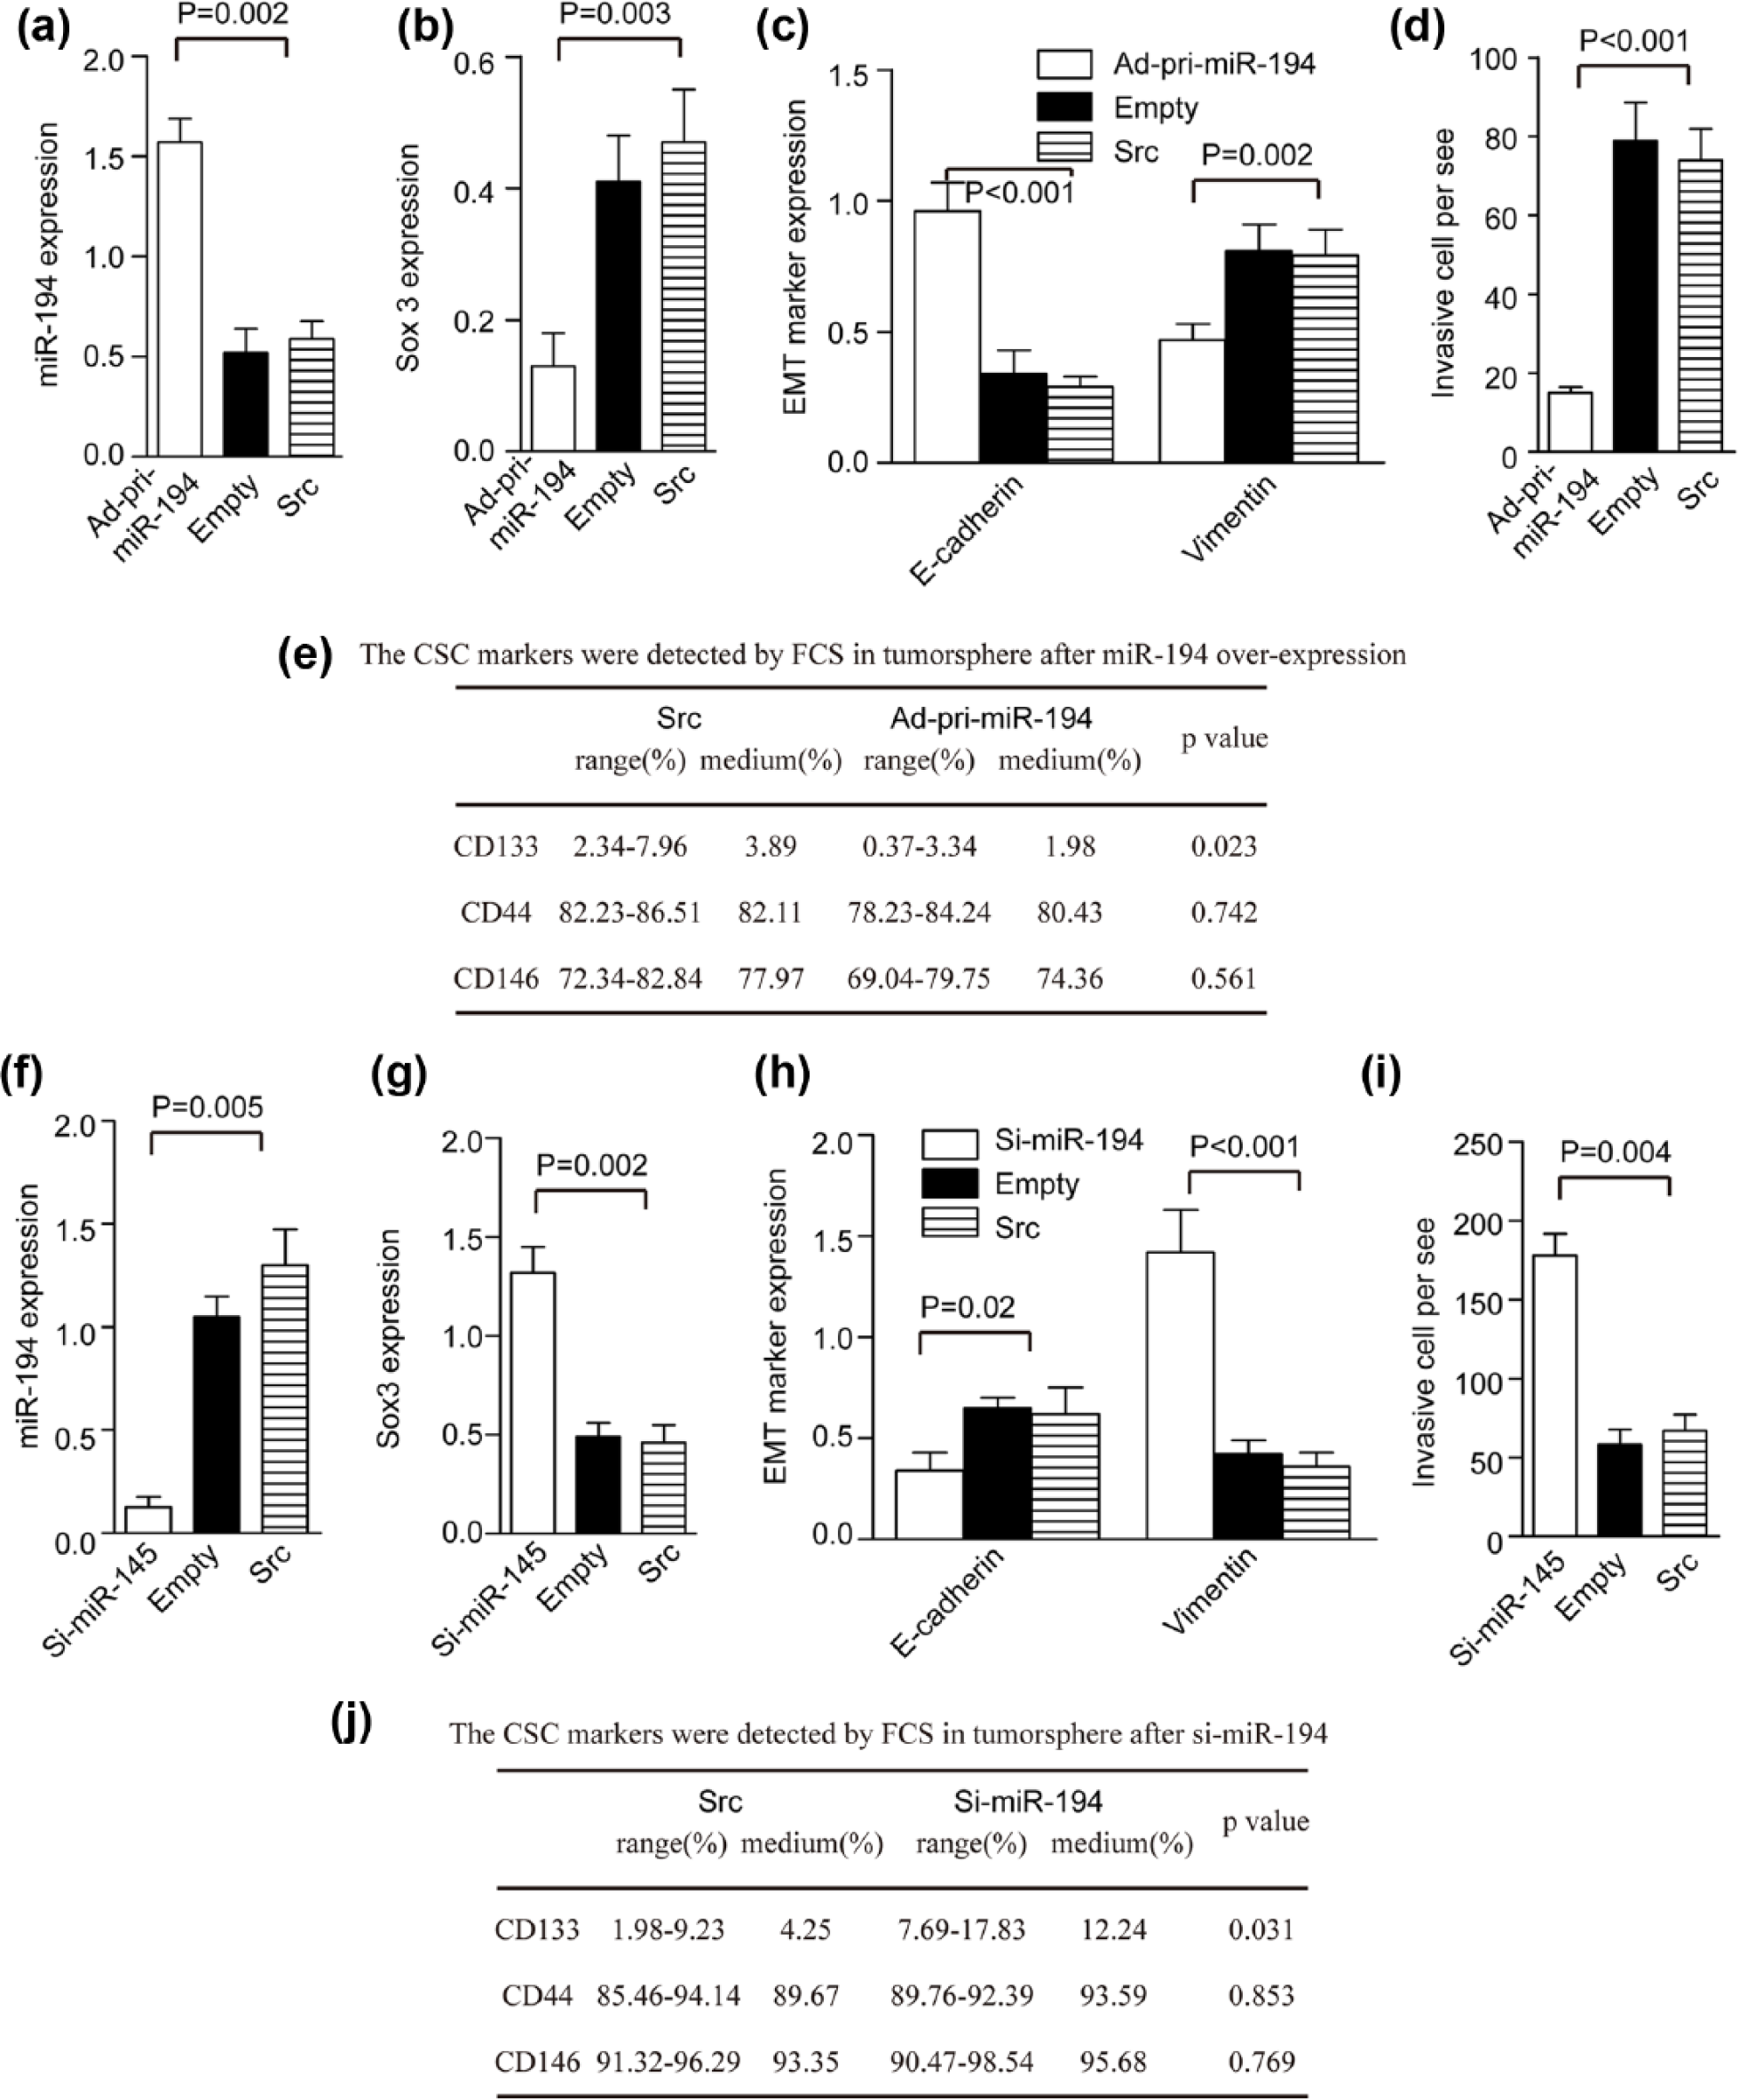
MiR-194 induced TS differentiation and inhibited tumorsphere EMT. (a) The miR-194 level increased, (b) Sox3 level decreased, (c) EMT marker expression, (d) invasion cell decreased, and (e) CD133+ cell decreased after overexpression of miR-194 (p < 0.05 upon comparison with levels before and after transfection with Ad-pri-miR-194; n = 3). (f) The miR-194 level decreased, (g) Sox3 level increased, (h) EMT marker expression, (i) invasive cells increased, and (j) CD133+ cells increased after transfection with Ad-silence-miR-194 (si-miR-194) (p < 0.05 upon comparison with levels before and after transfection with si-miR-194 vector; n = 3).
Next, we transfected the Ad-si-miR-194-GFP (Ad-si-miR-194) for knockdown of miR-194 or its control into tumorspheres, and flow cytometry was used to analyzed the number of GFP-positive cells. The percentage of GFP-positive cells was 88%–92% (90% ± 2.3%) in the Ad-pri-miR-194 group and 89%–91% (89 ± 1.9%) in the scr group (Figure S2B). The miR-194 level decreased 5-fold compared to the control (Figure 4(f)). The Sox3 level increased 3-fold after transfection of Ad-si-miR-194 (Figure 4(g)). E-cad expression decreased, Vim expression increased (Figure 4(h)), and the number of invasive cell increased after transfection with si-miR-194 on the 28th day in stem cell medium plus 5% FCS (Figure 4(i)). And CD133+ cell increased after knockdown of miR-194 in tumorsphere (Figure 4(j)).
Ad-miR-194 inhibits the growth and metastasis of tumors derived from tumorspheres
Tumor cells were dissociated from tumorspheres and injected into three null mice. The resulting tumors were visible or palpable 2 weeks after injection. Next, we injected 5.8 × 10⁵ plaque-forming unit (PFU) of Ad-pri-miR-194 or Ad-Mock with gadolinium combination into tumors three times a week. 18 Tumor volume was measured on day 28 after mice were sacrificed. Tumors were smaller in the Ad-pri-miR-194 group than in the Ad-scr group (p = 0.01, Figure 5(a)). We also injected tumorspheres into 12 null mice through their tail veins; 6 mice were treated with Ad-pri-miR-194 and 6 mice were treated with Ad-scr. Of these mice, 5 of 6 in the Ad-scr group and 2 of 6 in the Ad-pri-miR-194 group had lung metastasis after 28 days, with more metastasis in the former than the latter group (Figure 5(b)). Sox3 expression was clearly abundant in the Ad-scr group than in the Ad-pri-miR-194 group (Figure 5(c)), and miR-194 expression was higher in the former group after qRT-PCR analysis (Figure 5(d)). As expected, western blot analysis showed that Sox3 expression decreased in the Ad-pri-miR-194 group (Figure 5(e)). After culturing tumorspheres in stem cell medium from metastases of the lung, colony formation and the number of invasive cells were higher in the Ad-scr group than in the Ad-pri-miR-194 group (Figure 5(f) and (g)).

Injection of AD-pri-miR-194 into transplanted tumors inhibits tumor growth, invasion, and metastasis. Injection of AD-pri-miR-194 into transplanted tumors (a) inhibited tumor growth, (b) decreased metastatic sites in lung, (c) decreased levels of Sox3 in the metastatic site of the lung (1000×), (d) increased miR-194 level in lung metastasis, (e) decreased colony formation at the metastatic site in the lung, and (f) decreased cell invasion from the metastatic site.
Discussion
In humans, Sox3, a high-mobility group box protein, is implicated in X-linked hypopituitarism and mental retardation. 19 In the developing chicken embryo, transcripts of Sox3 are first detected in the neural plate shortly before neural tube closure, and Sox3 is also recognized as a marker of stem cells. 20 Improper regulation of sox genes is associated with the development of various types of cancer,21,22 such as EC, cervical carcinoma, hepatocarcinoma, breast cancer, melanoma, and lung cancer. The role of the Sox gene family in carcinogenesis has been attributed to their properties such as maintaining CSC pluripotency, regulation of cell differentiation, proliferation, and survival in multiple essential processes.21,23 For example, silencing Sox3 inhibits metastasis and growth of esophageal squamous cell carcinoma cells. 24
Hubbard et al. 9 reported the existence of ECSCs, and several stem cell markers including Oct4, Nanog, and Sox2 are expressed in EC. These factors improve tumor invasion and metastasis through promotion of EMT.25–27 In our study, we detected Sox3 expression in EC tissues, which correlated with multipotency in the endometrial tumorsphere, which was cultured in stem cell medium and could be recognized as the cancer stem cell model, 28 suggesting that Sox3 is a marker of ECSC. Improved Sox3 expression may promote the EMT process in ECSCs, indicating that it may serve to improve the clinical outcomes of EC patients. In addition, we detected CD44, CD133, and CD146 expression in ECSC; these molecules were recognized as the CSC markers,29,30 and it is found that CD133+ cells were higher in tumorsphere than in differentiated tumorsphere. Previously, the CD133+ cell isolated from EC showed more aggressive proliferative potential in vitro, more increased tumorigenicity in nude or non-obese diabetic (NOD)/severe combined immunodeficiency (SCID) mice than CD133− cells, generated both CD133+ and CD133− cells, and showed higher tumorsphere formation than CD133− cells. 17 These data proved that CD133 was an important marker for ECSC isolation.
In our study, it is found that overexpression of Sox3 had more obvious effects on miR-194 expression. The expression of Sox3 increased 3-fold and miR-194 expression decreased 5-fold after transfection of Sox3 vector compared to the control. It might indicate that overexpression of Sox3 could inhibit the miR-194 expression. It is supposed that overexpression of Sox3 might inhibit miR-194 generation or maturation; however, because of the biodiversity of Sox3, 31 it needs further investigation.
Dysregulation of miRNAs is implicated in EMT modulation.32,33 MiR-200 family, 34 miR-145,35,36 and miR-205 37 have proved to be key modulators of EMT. Previously, miR-194 was reported to inhibit EC cell invasion by suppressing BMI-1 expression 38 and inhibiting EMT through FoxD1 39 and RING box protein 1 (RBX1) 40 in gastric cancer. The overexpression of miR-194 in liver mesenchymal-like cancer cells reduced the expression of the mesenchymal cell marker N-cadherin and suppressed the invasion and migration of mesenchymal-like cancer cells both in vitro and in vivo. 41 In our study, we showed that miR-194 inhibited ECSC EMT by targeting the 3′-UTR of Sox3, demonstrating that the overexpression of miR-194 may be a prognostic biomarker for cancer. 8 Furthermore, the overexpression of miR-194 in invasive EC cells may serve as a new valuable therapeutic strategy against EC metastasis. Inhibition of Sox3 expression reduced colony formation in ECSCs; thus, it may be a therapeutic target for reducing the recurrence of EC.
Conclusion
In summary, we found that Sox3 was a potential marker for ECSC and miR-194 induced ECSC differentiation and inhibited ECSC invasion and metastasis, which indicates that miR-194 was a target for EC.
Footnotes
Acknowledgements
B.G. and Y.Y. contributed equally.
Declaration of conflicting interests
The author(s) declared no potential conflicts of interest with respect to the research, authorship, and/or publication of this article.
Funding
The author(s) disclosed receipt of the following financial support for the research, authorship, and/or publication of this article: This project was supported by Key Research Foundation of Education Bureau of Hubei Province, China (Grant No. 20162103) and The General Program of Natural Science Foundation of Hubei province, China (Grant No. 2016CFB409).
References
Supplementary Material
Please find the following supplemental material available below.
For Open Access articles published under a Creative Commons License, all supplemental material carries the same license as the article it is associated with.
For non-Open Access articles published, all supplemental material carries a non-exclusive license, and permission requests for re-use of supplemental material or any part of supplemental material shall be sent directly to the copyright owner as specified in the copyright notice associated with the article.