
Abstract
Spindle and kinetochore–associated protein 1 is a microtubule-binding subcomplex of the outer kinetochore that is essential for proper chromosome segregation. Recently, spindle and kinetochore–associated protein 1 has been highlighted as a biomarker in various cancers; however, the precise role of spindle and kinetochore–associated protein 1 in prostate cancer remains unknown. This study aims to evaluate whether spindle and kinetochore–associated protein 1 affects the biological behaviors of prostate cancer. We investigated the expression of spindle and kinetochore–associated protein 1 in a series of prostate cancer tissues as well as in a panel of prostate cancer cell lines. Cell proliferation, migration, and invasion were evaluated in spindle and kinetochore–associated protein 1 knockdown prostate cancer cell lines by MTT and Transwell assays. Our results showed that the expression of spindle and kinetochore–associated protein 1 was remarkably upregulated in prostate cancer at both messenger RNA and protein levels compared with non-cancerous tissue. Knockdown of spindle and kinetochore–associated protein 1 repressed the ability of cell proliferation, migration, and invasion of prostate cancer cells. Moreover, inhibition of spindle and kinetochore–associated protein 1 could inhibit the activity of AKT and ERK pathway. In conclusion, our findings suggest that spindle and kinetochore–associated protein 1 could serve as a potential therapeutic target in prostate cancer patients.
Introduction
Prostate cancer (PCa) is the most frequent malignancy accounting for 25% of all newly diagnosed cancers in men and is the second leading cause of death from cancer. 1 Primary treatment with surgery or radiation therapy in patients with organ-confined PCa demonstrates overall 10-year survival rates of over 75%.2,3 In spite of that, it is estimated that approximately 15% of the patients present locally advanced or metastatic disease, and about 40% of patients will relapse after local therapy. 4 Although there are tremendous advances in diagnosis and treatment, the prognosis of PCa is still not satisfactory. However, the molecular mechanisms regulating growth, acquisition of invasive, and metastatic phenotypes of PCa are still not fully understood.
Spindle and kinetochore–associated protein 1 (SKA1), a component of microtubule-binding complex of kinetochore, is essential for proper chromosome segregation. Depletion of SKA1 proteins results in sparse microtubule arrays that often exhibit twisted or bent spindles. The chromosomes appear to interact with the spindle microtubule, but fail to organize into metaphase plates.5,6 Recent years have seen remarkable progress made in basic understanding of various diseases and in deciphering the role of SKA1 in cancer.7–9 However, the specific role of SKA1 in PCa remains unknown. Here, we conducted immunohistochemical analysis of SKA1 in a series of PCa tissues and investigated the function and mechanism of SKA1 in the carcinogenesis of PCa.
Materials and methods
Patients
Specimens of 126 primary PCa cases over the period from 2009 to 2014 were obtained from Zhejiang Xiaoshan Hospital. Consent was obtained from all patients, and the experimental protocols were approved by the local ethics committee of Zhejiang Xiaoshan Hospital. Clinical and pathologic information were collected from a retrospective review of well-documented medical records, and the characteristics of patients were detailed.
Tissue microarray
The tissue microarray (TMA) construction and immunohistochemical analysis were conducted as described previously. The staining pattern of SKA1 was classified in a subjective spectrum of 0 to +++ as follows: 0, negative expression in tumor tissue; +, weak staining; ++, moderate staining; and +++, strong staining. For each staining level, the percentage of cells with a specific score was visually estimated. When <10% of the cells were positively stained, the section was classified as negative. Positive sections were further divided into weakly positive (10%–30%), moderately positive (30%–50%), and strongly positive (more than 50%). The TMA chips were observed under 20× magnification. All the slides were examined independently by two experienced pathologists blinded to clinicopathologic information and patient outcomes.
Cell culture
The human PCa cell lines, PC3, LNCaP, and DU-145, and normal prostate epithelial cells, PrECs, were purchased from the American Type Culture Collection (ATCC, Rockville, MD, USA). Cells were cultured in RPMI 1640 (LNCaP, DU-145, and PrECs) and F12K (PC3) containing 10% fetal bovine serum (FBS) supplemented with 100 U/mL of penicillin and 0.1 mg/mL of streptomycin and incubated at 37°C in a humidified atmosphere of 5% CO2.
Quantitative reverse transcription polymerase chain reaction
Total RNA was extracted from cells and tissues using RNAiso Plus reagent (Takara, Dalian, China), and complementary DNA (cDNA) was synthesized using Primescript RT Reagent (Takara). Quantitative reverse transcription polymerase chain reaction (qRT-PCR) was performed on a StepOnePlus Real-Time-PCR System (Applied Biosystems, Carlsbad, CA, USA) according to the manufacturer’s instructions. The PCR conditions consisted of an initial denaturation step at 95°C for 10 min, followed by 40 cycles of 15 s at 95°C and 1 min at 60°C. Finally, a melting curve profile was set at 95°C (15 s), 60°C (15 s), and 95°C (15 s). Each messenger RNA (mRNA) level was measured as a fluorescent signal corrected according to the signal for glyceraldehyde 3-phosphate dehydrogenase (GAPDH). The PCR primers used were SKA1-F: 5′-TGATGTGCCAGGAAGGTGAC-3′, SKA1-R: 5′-CAAAGGATACAGATGAACAACAGC-3′, GAPDH-F: 5′-GTGGACATCCGCAAAGAC-3′, and GAPDH-R: 5′-AAAGGGTGTAACGCAACTA-3′. Relative quantification was calculated by the ΔΔCt method and normalized based on GAPDH.
Western blot assay
Cells and tissues were lysed in radioimmunoprecipitation assay (RIPA) buffer with phenylmethylsulfonyl fluoride (PMSF; Beyotime Biotechnology, Jiangsu, China). Protein concentration was determined using a Bio-Rad protein assay system (Bio-Rad, Hercules, CA, USA). Equivalent amounts of proteins were separated by sodium dodecyl sulfate (SDS)–polyacrylamide gel electrophoresis (PAGE), and then transferred to polyvinylidene difluoride membranes (Bio-Rad). After being blocked in Tris-buffered saline (TBS) containing 5% non-fat milk, the membranes were incubated with primary antibodies (1:1000 dilution; SBA3500101; Sigma–Aldrich, St. Louis, MO, USA) at 4°C for 12 h and then with horseradishperoxidase-conjugated secondary antibody (1:5000 dilution; sc-2004; Santa Cruz Biotechnology, Santa Cruz, CA, USA). Signals were detected on X-ray film using the ECL detection system (Pierce, Rockford, IL, USA). The relative protein levels were calculated based on β-actin as the loading control. All experiments were performed in triplicates.
Lentivirus production and infection of PCa cells
The cDNA sequence of SKA1 was obtained from GenBank (accession no. NM_001039535). Short hairpin RNA (shRNA) for SKA1 (5′-CCG-GCC-TGA-CAC-AAA-GCT-CCT CCTAAA-TCT-CGA-GAT-TTA-GGA-GCT-TTG-TGT-CAGGTT-3′) was inserted into the lentivirus expression plasmid pFH-L (Shanghai Hollybio, Shanghai, China). Non-silencing shRNA (5′-TTC-TCC-GAA-CGT-GTC-ACG-T-3′) was used as a control. To generate SKA1-shRNA and control lentivirus, lentiviral shRNA plasmids targeting SKA1 or a control were transfected into HEK293T cells using Lipofectamine 2000 (Invitrogen, Carlsbad, CA, USA) together with the gag/pol packaging vector (pCMVΔR8.92; Shanghai Hollybio) and the pVSVG-1-encoding plasmid (Shanghai Hollybio) according to the manufacturer’s instructions. For lentivirus infection, cells were grown at a density of 5 × 10⁴ cells per well and infected with SKA1-shRNA lentivirus or control lentivirus at a multiplicity of infection (MOI) of 10.
Cell proliferation assay and cell cycle analysis
Cells were seeded in 96-well plates at 1 × 10³ per well. Cell proliferation was evaluated using Cell Counting Kit-8 (CCK-8; Dojindo, Rockville, MD, USA) according to the manufacturer’s instructions. Briefly, 10 µL of CCK-8 solution was added to culture medium and incubated for 2 h. The absorbance at 450 nm wave length was determined with a reference wave length of 570 nm. For cell cycle analysis, cells were plated in six-well plates at 5 × 10⁵ per well. The cell cycle distribution was analyzed by propidium iodide (Sigma–Aldrich) staining and flow cytometry. All experiments were performed in triplicates.
Colony formation assay
Cells were plated in six-well plates at 1–2 × 10² per well and maintained in a medium containing 10% FBS. After 12–14 days, the cells were washed twice with PBS, fixed with methanol, and stained with Giemsa solution. The number of colonies containing ⩾50 cells was counted under a microscope. All these experiments were performed in triplicates.
Migration and invasion assays
After transfection, 1 × 10⁵ cells in serum-free medium were seeded into the Boyden chamber without Matrigel (8-µm pore; BD Falcon, San Jose, CA, USA) for migration or the chamber with Matrigel (8-µm pore; BD Falcon) for invasion. Then the chambers were put in 24-well plates in a medium with 10% FBS. The chambers were incubated for 24 h at 37°C with 5% CO2. The cells on the underside of filter membrane were fixed in ethanol and stained with crystal violet. The cells were counted under a microscope. All experiments were performed in triplicates.
Statistical analysis
The two-tailed χ2 test was used to determine the significance of the difference among the covariates. The significance of the in vitro data was determined using Student’s t-test (two-tailed). In all the tests, p-values <0.05 were considered statistically significant. The SPSS software program (version 12.0; SPSS Inc., Chicago, IL, USA) was used for statistical analyses.
Results
SKA1 staining and its association with pathological characteristics
SKA1 expression was analyzed by immunohistochemical staining. SKA1 expressions were mostly found in cytoplasm of tumor cells. Immunostaining results suggested a significantly higher SKA1 expression in PCa tissues compared with adjacent tissues. Among 126 tumor samples, 79 (62.70%) showed high SKA1 expression, with only 36.50% (46/126) of the samples from normal adjacent tissues (Figure 1(a) and (b)). The SKA1 expression was found to be statistically related to the angiolymphatic invasion, lymph node metastasis, and clinical stage.

(a) Positive expression of SKA1 in the PCa tissues. (b) Negative expression of SKA1 in the adjacent normal prostate tissues.
To confirm these observations, we investigated SKA1 mRNA expression in 126 cases of PCa and normal adjacent tissues using qRT-PCR and western blot analysis. The mRNA levels between PCa tissues and normal adjacent tissues were calculated with the comparative Ct method (2−ΔΔct). The results indicated that SKA1 mRNA and SKA1 protein expression was significantly higher in PCa tissues than in normal adjacent tissues (p < 0.05; Figure 2(a) and (b)).

(a) qRT-PCR showing expression level of SKA1 mRNA in PCa tissues. (b) Western blot assay showing expression level of SKA1 protein in PCa tissues.
SKA1 expression in PCa cell lines
We also examined SKA1 expression in three human PCa cell lines, LNCaP, PC3, and DU-145, and compared these to a normal prostate epithelial cell line PrEC. qRT-PCR and western blot analyses revealed that SKA1 was upregulated in all three PCa cell lines; however, the highest levels were observed in PC3 cells and the lowest levels in DU-145 cells, compared to normal PrEC controls (p < 0.01; Figure 3(a) and (b)). Therefore, we selected DU-145 and PC3 cells to investigate the effects of forced overexpression and knockdown of SKA1, respectively. Western blotting confirmed that SKA1 was upregulated in DU-145 cells transfected with SKA1 overexpression plasmid (p < 0.05; Figure 3(c)), whereas it was silenced in PC3 cells transfected with SKA1 shRNAs (p < 0.05; Figure 3(d)).
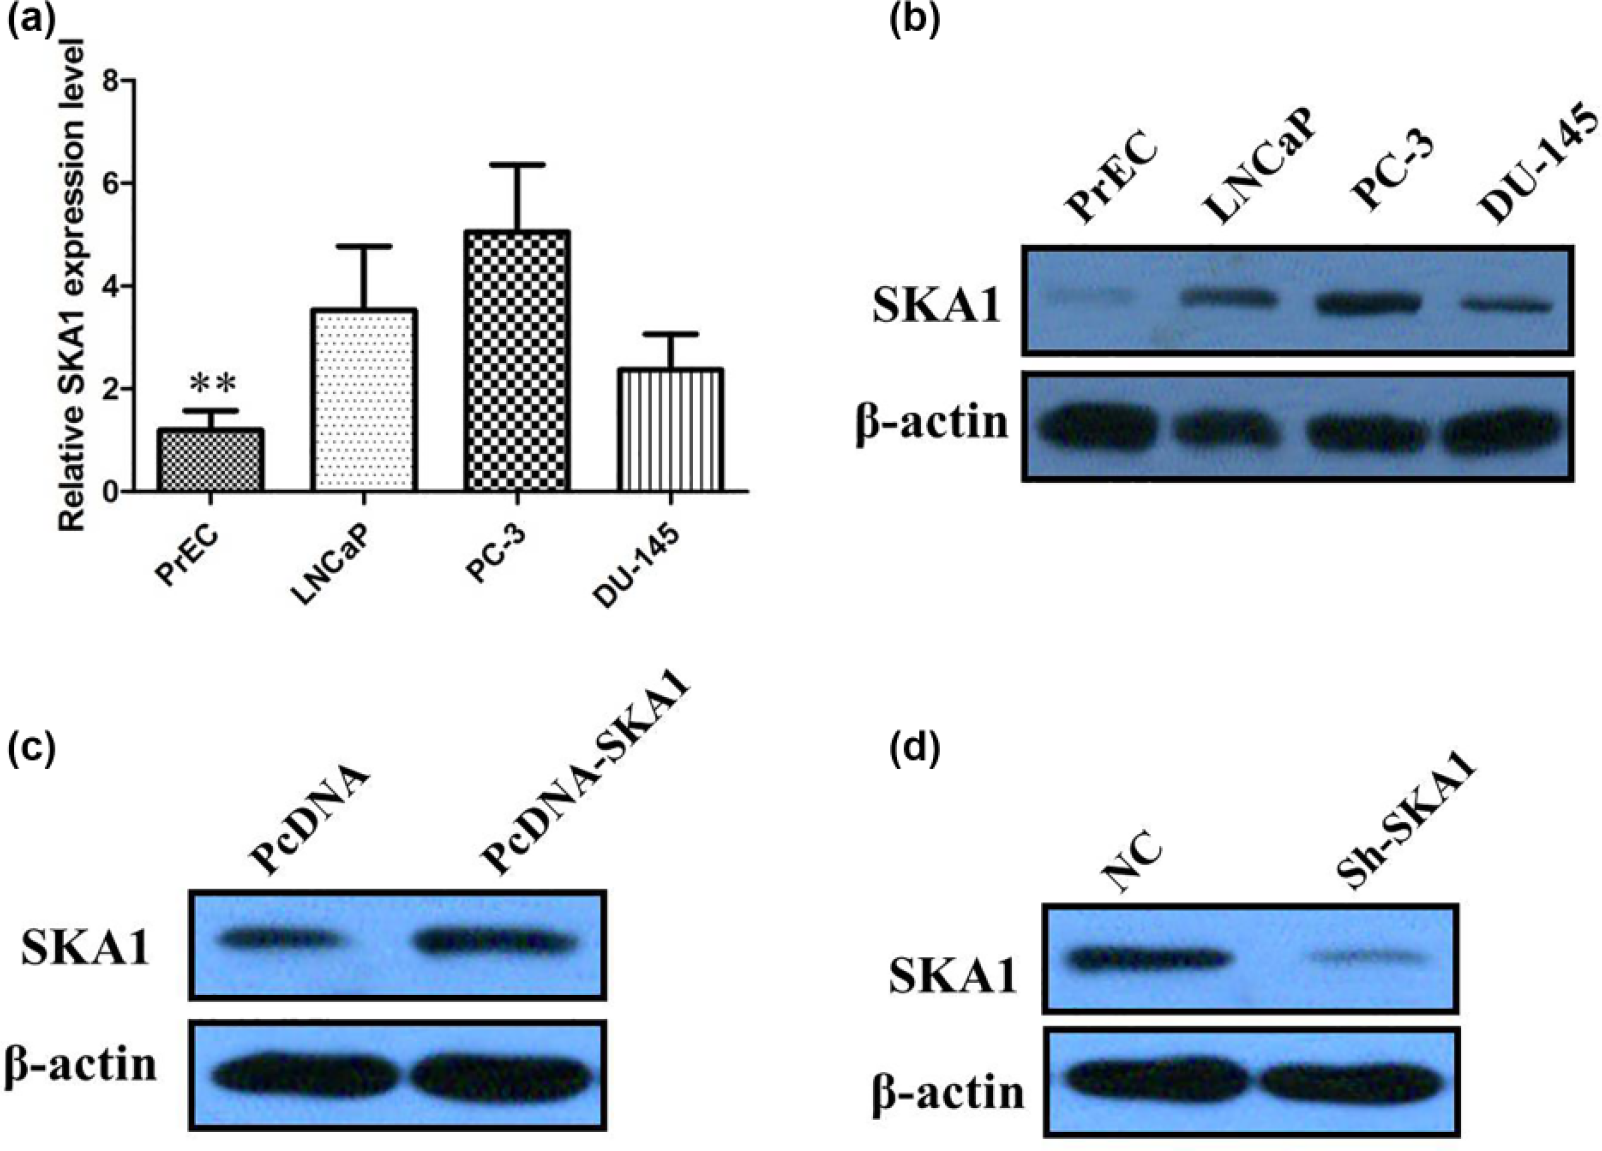
(a) qRT-PCR showing expression level of SKA1 mRNA in a panel of PCa cell lines. (b) Western blots showing the expression of SKA1 protein in PCa cell lines. (c) Western blots showing the expression of SKA1 was upregulated in DU-145 cells transfected with SKA1 overexpression plasmid. (d) Western blots showing the expression of SKA1 was silenced in PC3 cells transfected with SKA1 shRNAs.
SKA1 mediated cell growth and cell cycle of PCa cells
To further investigate the roles of SKA1 on regulating PCa cell phenotypes, and mechanism investigations document by which mechanism SKA1 regulating its underlying targets, in vitro loss- and gain-of function assays were performed. The results of CCK-8 and colony formation assay showed that SKA1 downregulation significantly impeded the proliferation of PC3 cell lines, and overexpression of SKA1 increased the ability of cell proliferation of DU-145 (Figure 4(a)–(d)).

(a) CCK-8 assay showed that SKA1 downregulation significantly impeded the proliferation of PC3 cell lines. (b) CCK-8 assay showed that overexpression of SKA1 increased the ability of cell proliferation of DU-145. (c) Colony formation assay showed that SKA1 downregulation significantly impeded the proliferation of PC3 cell lines. (d) Colony formation assay showed that overexpression of SKA1 increased the ability of cell proliferation of DU-145.
We then performed flow cytometric analyses to further evaluate whether SKA1 plays a role in PCa cell cycle to affect proliferation. The flow cytometry analysis revealed that the percentage of cells in the G0/G1 peak was clearly higher and the percentage of cells in the S peak was lower in the SKA1 knockdown PC3 cells than in the negative control cells (Figure 5(a)). Overexpression of SKA1 increased the S-phase percentage and decreased G0/G1 phase percentage of DU-145 cells (Figure 5(b)). These results indicated that the silencing SKA1 affects proliferation, potentially by regulating the G1–S phase transition. Moreover, the rate of apoptosis was significantly higher in PC3 cells after SKA1 knockdown and lower in DU-145 after overexpression of SKA1 (Figure 5(c) and (d)).

(a) The flow cytometry analysis revealed that the percentage of cells in the G0/G1 peak was clearly higher and the percentage of cells in the S peak was lower in the SKA1 knockdown PC3 cells than in the negative control cells. (b) The flow cytometry analysis revealed that overexpression of SKA1 increased the S-phase percentage and decreased G0/G1 phase percentage of DU-145 cells. (c) Annexin V–FITC/PI apoptosis assay revealed that the rate of apoptosis was significantly higher in PC3 cells after SKA1 knockdown. (d) Annexin V–FITC/PI apoptosis assay revealed that the rate of apoptosis was lower in DU-145 after overexpression of SKA1.
SKA1 promoted cell invasion and migration of PCa cell in vitro
To determine whether SKA1 played a role in PCa cell metastasis in vitro, we investigated whether upregulation of SKA1 could induce PCa cell invasion and migration. The results showed that a significantly higher proportion of SKA1-overexpressing DU-145 cells migrated through Matrigel-coated chambers compared to vector control cells (p < 0.05; Figure 6(a)). In contrast, knockdown of SKA1 with shRNA resulted in a significantly lower number of invading PC3 cells, compared to scrambled controls (p < 0.05; Figure 6(b)).

(a) The results of transwell assay showed that a significantly higher proportion of SKA1-overexpressing DU-145 cells migrated through Matrigel-coated chambers compared to vector control cells. (b) Knockdown of SKA1 with shRNA resulted in a significantly lower number of invading PC3 cells. (c) SKA1 knockdown significantly inhibited activation of AKT and ERK compared to scrambled controls. (d) Western blotting revealed a significant increase in phosphorylated AKT and ERK in SKA1-overexpressing DU-145 cells compared to vector controls.
The effect of SKA1 on cell signaling proteins
To investigate the molecular mechanisms and pathways by which SKA1 may influence cellular functions in human PCa, we examined the expressions of AKT, ERK, p-AKT, and p-ERK. SKA1 knockdown significantly inhibited activation of AKT and ERK compared to scrambled controls (p < 0.05; Figure 6(c)). Conversely, western blotting revealed a significant increase in phosphorylated AKT and ERK, indicating activation of their associated pathways in SKA1-overexpressing DU-145 cells compared to vector controls (p < 0.05; Figure 6(d)).
Discussion
Our knowledge of the underlying cellular molecular pathways driving pathogenesis of PCa remains limited. Therefore, the identification of PCa-associated oncogenes and investigation of their molecular and biological functions are critical. Emerging evidence has shown that SKA1 expression has the potential to be served as novel biomarkers in detection of various carcinomas.10,11 Increased SKA1 expression has been reported in lung cancer, pancreatic cancer, and hepatocellular carcinoma.12,13 In these tumors, SKA1 may serve as a potential oncogene, and SKA1 overexpression was associated with enhanced cell proliferation, reduced apoptosis, and increased cell migration. 14 As one of the common investigated oncogene groups, SKA1 had been extensively studied in various types of cancers, and it was found that the detection accuracy was inconsistent and inconclusive among different reported literatures. However, the functions of SKA1 in PCa were previously unknown. In this study, we showed that SKA1 was significantly upregulated in PCa tumors and was strongly associated with disease progression. We further demonstrated that SKA1 played critical regulatory roles in the cell proliferation and metastasis of PCa cells, and AKT and ERK signal partially mediated SKA1 oncogenic function to promote PCa progression.
First, we used immunochemistry techniques to demonstrate that SKA1 is overexpressed in almost 62.70% of PCa tissues when compared with adjacent normal tissues. Then we measured the expression level of SKA1 in clinical PCa tissues by qRT-PCR. We confirmed that SKA1 is extremely upregulated in most of PCa tissues, compared with normal tissues, indicating that SKA1 may primarily participate in PCa. Additionally, SKA1 expression was markedly increased in a panel of PCa cell lines compared with normal prostate epithelial cells, suggesting that high SKA1 expression was closely associated with CRC carcinogenesis. The qRT-PCR results revealed that PC3 cells showed higher expression of SKA1, and DU-145 showed lower expression of SKA1.
A previous study reported that knockdown of SKA1 attenuated hepatocellular carcinoma cell proliferation in vitro and markedly abrogated tumorigenicity in vivo. 15 We then determined whether SKA1 expression influences tumor-like characteristics such as proliferation and apoptosis. Our results showed that knockdown of SKA1 by shRNA in PC3 cells was shown to significantly inhibit PCa cell proliferation, suggesting that SKA1 may affect PCa progression by affecting cell proliferation. SKA1 has been suggested to play a role as a cell cycle regulator in other types of malignant epithelial tumors. In this study, depletion of SKA1 caused cell cycle arrest in G0/G1 phase. Overexpression of SKA1 increased the S-phase percentage and decreased G0/G1 phase percentage of DU-145 cells. Although SKA1 is involved in metastasis of different cancers, little is known about the underlying molecular mechanism. In this study, we identified that knockdown of SKA1 expression can suppress migratory and invasive phenotype of PC3 cells. SKA1 is required and is sufficient to drive cancer cell migration and invasion, and SKA1 regulated the metastasis activity of PCa cell line by the upregulation of phosphorylated AKT and ERK.
Our data support a therapeutic approach in which SKA1 could be an effective molecular target for the improvement of survival in PCa patient. In conclusion, our findings indicated that SKA1 represents a potential therapeutic target and prognostic biomarker for PCa.
Footnotes
Acknowledgements
K.W. and J.S. contributed equally to this study.
Declaration of conflicting interests
The author(s) declared no potential conflicts of interest with respect to the research, authorship, and/or publication of this article.
Funding
The author(s) received no financial support for the research, authorship, and/or publication of this article.