
Abstract
The prevalence of TP53 mutations in advanced prostate cancers (PCa) is 3 to 5 times of the quantity in primary PCa. By an integrative analysis of the Cancer Genome Atlas and Catalogue of Somatic Mutations in Cancer data, we revealed the supporting evidence for 2 complementary hypotheses: H1 - TP53 abnormalities promote metastasis or therapy-resistance of PCa cells, and H2—part of TP53 mutations in PCa metastases occur after the diagnosis of original cancers. The plausibility of these hypotheses can explain the increased prevalence of TP53 mutations in PCa metastases. With H1 and H2 as the general assumptions, we developed mathematical models to decipher the change of the percentage frequency (prevalence) of TP53 mutations from primary tumors to metastases. The following results were obtained. Compared to TP53-normal patients, TP53-mutated patients had poorer biochemical relapse-free survival, higher Gleason scores, and more advanced t-stages (P < .01). Single-nucleotide variants in metastases more frequently occurred on G bases of the coding sequence than those in primary cancers (P = .03). The profile of TP53 hotspot mutations was significantly different between primary and metastatic PCa as demonstrated in a set of statistical tests (P < .05). By the derived formulae, we estimated that about 40% TP53 mutation records collected from metastases occurred after the diagnosis of the original cancers. Our study provided significant insight into PCa progression. The proposed models can also be applied to decipher the prevalence of mutations on TP53 (or other driver genes) in other cancer types.
Introduction
The tumor suppressor p53 protein has a myriad of functions crucial to normal cell proliferation, apoptosis, DNA repair, and others.1,2 TP53 gene, encoding p53, is the most frequently altered gene in human cancers. 3 Mutant-TP53 disrupts age-related accumulation patterns of somatic mutations in multiple cancer types. 4 However, pathogenic germline TP53 mutations are relatively populous in only a few cancer types, including inherited Li-Fraumeni syndrome, carcinomas of the breast and adrenal cortex, brain tumor, and acute leukemia. 5 Most somatic TP53 mutations are single-base substitutions distributed throughout exons 5 to 8. 6 Notably, about 20% of these mutations alter 1 of 3 codons (175 to 248, or 273) of the 393 amino acids of p53 protein. 7 The clinical significance of TP53 status for patient outcomes has been and continues to be a controversial topic of cancer research.8,9 Many retrospective studies have associated its mutation and abnormal p53 protein expression with poor patient survival. Such an association has been demonstrated by previous studies, mostly in breast, head and neck, hematopoietic and liver cancers.10-13
Prostate cancer (PCa) is the most commonly diagnosed non-skin cancer worldwide for males. In the United States, about 30 000 men die of PCa annually.14-16 Metastasis is a primary cause of morbidity and mortality for patients with PCa or other cancers.17,18 PCa progression can be predicted using transcriptomic and epigenetic signatures.19-21 Androgen deprivation therapy (ADT) is a usual first-line option for men with advanced (metastatic and non-metastatic) PCa. 22 However, nearly all men with metastatic PCa will develop resistance to androgen deprivation therapy, a state known as metastatic castration-resistant PCa (mCRPC). 23 Aberrations of AR, ETS genes, TP53 and PTEN are frequent, with TP53 and AR alterations being enriched in mCRPC compared to primary PCa.24-26 In particular, the percentage frequency of TP53 mutations is about 10% in primary PC samples but may be as high as 50% in advanced PCa or metastases of the disease.24,27
Cancer metastases arise in part from residual and disseminated tumor cells that originated from primary cancer. These tumor cells can survive after the initial surgery, chemotherapy, radiotherapy, and/or targeted therapy.28-30 Based on such an understanding, it is logical to premise that a potential TP53 status-determined mechanism for cancer progression may contribute to the increased prevalence of TP53 mutations in metastatic PCa. That is, TP53 abnormalities could promote PCa metastasis and predispose therapeutic resistance. This hypothesis, termed H1 hereafter, was suggested by a previous study. 31 As shown in the publication, biochemical recurrence (BCR), i.e. prostate-specific antigen (PSA) recurrence after prostatectomy, was more frequently observed in the patients with TP53 mutations in the primary tumor samples than in those without such mutations. A reported analysis of transcriptomic data demonstrated that abnormal p53 expression status was associated with poor overall survival, progression-free survival, and time to distant metastases for patients with locally advanced prostate cancer treated primarily by radiation therapy. 32
Complementary to H1, another hypothesis, termed H2 hereafter, for the mutation enrichment in metastatic prostate tumors is that a fraction of TP53 mutations in metastases occur after the diagnosis of original cancers. The logic underlying this novel hypothesis is that there is a substantial timespan between the initial treatment of TP53-wild-type prostate cancer and the after-therapy progression (ie, biochemical relapse and metastasis formation) such that new TP53 mutations may occur with a substantial possibility and influence the biology of the disseminated tumor cells. For example, in the patients who initially respond to abiraterone (a CYP17A1 inhibitor that reduces PSA and improves overall survival), the median time to PSA progression ranges from 5.8 to 11.1 months and a median time to radiographic progression is about 16.5 months.33-35
In this paper, via an integrative analysis of publicly available genomic data of PCa samples, we first provided supporting evidence for the 2 hypotheses. After that, we derived the mathematical models to decipher the change of the percentage frequency (prevalence) of TP53 mutations from primary cancers to metastatic ones.
Materials and Methods
COSMIC data
From the Catalogue of Somatic Mutations in Cancer (COSMIC) version-92 database, 36 we downloaded the table of “CosmicMutantExportCensus_92.tsv” on August 27, 2020. It contained all the somatic genetic alterations, including single nucleotide variants (SNVs) and short inserts/deletes (indels), on 710 census cancer genes. 37 The information of 39,320 records of mutations on the coding sequence of TP53 gene, which did not include those annotated with “Substitution – coding silent,” was used in this study. Among them, 468 were collected from 433 primary prostate carcinomas and 312 were collected from 296 PCa metastases. The filter(s) used for a specific analysis was presented in the corresponding paragraphs of the Results section.
TCGA data
The dataset generated by The Cancer Genome Atlas (TCGA) Prostate Adenocarcinoma (PRAD) project 27 contained 471 primary carcinoma samples with both clinical and somatic mutation information. Among them, 46 samples each had at least one non-synonymous mutation on the TP53 gene and another 5 each had a mutation at a splice point. The tumors with GS ⩾ 7 accounted for 91% of the sample set. In this study, the dataset was used for revealing the potential TP53 status based stratification of disease-free survival and the associations between TP53 status and cancer progression stages/ Gleason scores. It was also used to estimate the percentage frequency of TP53 mutations in primary PCa. The reason was that a substantial fraction of primary cancer samples didn’t have a mutation on any one of the census cancer genes, and therefore, were not collected in the relatively big COSMIC dataset.
Bioinformatics and statistics analysis
The annotation of the RefSeq gene NM001126114 (which includes 12 exons) was used as the template for mapping TP53 mutations onto individual exons. The comparison of a specific mutation feature (such as the exon or exon group where a mutation is located) between primary cancers and metastatic cancers was performed by establishing a
Mathematical models
Mathematical models were developed to decipher the change in the prevalence of TP53 mutations from primary cancers to metastases. The modeling process started from an equation that related the imbalance of TP53 mutations between primary and metastatic PCa to the disparity of progression probabilities between TP53-mutated and TP53-wild-type cancers. The underlying assumptions and the derivation of formulae were described in the Results section.
Results
For readers’ convenience, we reiterate the aforementioned hypotheses as follows:
Deriving supporting evidence from TCGA data for H1 and H2
Biochemical relapse-free survival (BCRFS)
Survival analysis using the TCGA data (Figure 1) showed that TP53-mutated patients had poorer BCRFS than TP53-normal patients (

The TP53 mutation status-based stratification of biochemical relapse-free survival. (A) All the 471 samples with completed information of Gleason score and BCR in the TCGA prostate Adenocarcinoma (PRAD) cohort was included in the analysis. (B) The sample with GS ≤ 6 were excluded from the analysis. P-values were calculated using the Cox-PH model, in which the patient age at the initial diagnosis was included as a covariate alongside the interested stratification variable, that is, TP53 status.
Gleason score (GS)
The GS is the sum of the primary and secondary Gleason patterns (GPs) of a primary tumor. The GSs of the 471 TCGA samples ranged from 6 to 9+ (≥9). The sizes of all the 4 GS-based groups were relatively substantial, containing 44, 238, 61, 128 samples, respectively. None of the GS-6 samples had a TP53 mutation. The mutation frequencies were 0.046 for GS-7, 0.113 for GS-8, and 0.25 for GS-9+, respectively. We performed a Chi-square test on this data, finding that the association between TP53 status and GS category was extremely significant (
Progression stage
The T-stage information of 382 TCGA cancer samples was publicly available. The numbers of T1, T2, T3, and T4 samples were 167, 162, 51, 2, respectively. We firstly combined the T3 and T4 samples into a single group (ie, T3&4), and then calculated the t-stage specific percentage frequencies of TP53-mutated samples. With a linear pattern, the quantities increased from 0.054 for T1, 0.13 for T2, to 0.189 for T3&4. The Chi-square test showed that the association between TP53 status and t-stage was significant (
Deriving supporting evidence from COSMIC data for H1 and H2
Ages of patients with metastatic cancers
We compared the distribution of patient ages at the diagnosis of TP53-mutated metastatic prostate cancers (Group-A) and the corresponding age distribution for TP53-wild-type cancers (Group-B). We conceived that a piece of strong (but not necessary) supporting evidence for the hypothesis H1 could be that Group-A patients were younger than Group-B patients on average. To perform the comparison, we extracted the information of 763 metastatic PCa samples from the COSMIC dataset to establish these 2 groups, that was Group-A (N1 = 295) and Group-B (N2 = 468). A sample was selected once it met the following 2 criteria. First, its molecular and clinical information was documented by a previous study archived in the PubMed database; second, the TP53 status (ie, mutated or wild-type) of the sample was known. In particular, of the 11 samples from the publication indexed with the PubMed ID “PMID24135135,”
44
only one was included due to the repeated sampling from a 42 years old participant. Advanced statistical analysis was performed on the 183 Group-A samples and 289 Group-B samples with the age information. As shown in Figure 2, there was a moderate difference in the cumulative distribution of patient ages between these 2 groups. In terms of median age, Group-A was 2-year younger than Group-B. However, the Kolmogorov-Smirnov test showed that the difference was not significant (

The distributions of ages, at dates of diagnosis or tumor sampling, for patients diagnosed with TP53 mutated metastatic PCa and patients with TP53 wild-type metastatic PCa in the COSMIC data. The Fn(x) on the y-axis represents the empirical accumulation probability.
Mutations exclusively observed in metastatic cancers
In the COSMIC dataset, an indexed mutation was uniquely determined by the physical position and the involved DNA base alteration (or indel) such as G > C. It was common that, for the same mutation, multiple mutation records were collected from different tumor samples. In particular, 272 (and 172) mutations were shared by 468 (and 312) TP53 mutation records from primary (and metastatic) PCa samples. Eighty-four mutations were in both lists of primary PCa and metastatic PCa. Eighty-eight mutations exclusively existed in metastatic PCa, accounting for 36.2% of mutation records of this cancer category. This result could be considered as supporting evidence for the hypothesis H2.
Suggestive evidence for H2 derived from COSMIC data
In this subsection, we show some differences in the profiles of TP53 mutations between primary and metastatic PCa. These results somewhat suggest the plausibility of our hypothesis H2 (see the Discussion section).
Physical position
We depicted the distribution pattern of mutation records over the 12 exons of the TP53 gene, among which the exons 1 to 4 encode the transcriptional activation domain of p53 protein, the exons 5 to 8 encode the sequence-specific DNA-binding domain and the exons 9 to 11 encode the tetramerization domain. Because mutation events in the 4 exons at the upstream end and the 3 exons at the down-stream end were relatively rare (in particular, no mutation record was in exon 12 that is 10 754 bases away from exon 11), we combined them into 2 exon clusters, that is, E-1:4 and E-10:12. As shown in Figure 3, the recorded mutations in primary PCa most frequently (28%) occurred on exon 8 (E-8) and the percentage frequency decreased to 23% in metastatic PCa. However, the difference was not significant (

The distributions of TP53 mutation records over exons (and exon clusters) for primary and metastatic PCa samples in the COSMIC data.
Nucleotide acid substitutions and indels
With reference to the coding sequence, we partitioned TP53 mutation records into 5 categories, that is,

The distributions of TP53 mutation records over 5 alteration categories, defined by single nucleotide substitutions and indels, for primary and metastatic PCa samples in the COSMIC data. The asterisk * represents any member of single nucleotides except for the wild-type one.
Hotspot mutations
From the COSMIC dataset, we selected a set (N = 18) of TP53 hotspot mutations, each of which contributed over 1% of mutation records to at least one of 3 sample categories, that is, primary PCa, metastatic PCa or panCancer (containing all cancer types, alongside PCa). The information and statistical analysis results of those mutations were summarized in Table 1. The top 4 genetic substitutions in panCancer and metastatic PCa (but not in primary PCa) were ENST00000269305.8:c.524G>A (p.R175H), c.743G>A (p.R248Q), c.818G>A (p.R273H), and c.817C > T (p.R273C), consistent with the statistics in literature. 6 We further inferred the significance of the inter-group difference in the frequencies of individual mutations. For a comparison between primary (or metastatic) PCa and panCancer, we performed the Chi-squared goodness of fit test, in which the former was considered as the “sample set” and the latter was treated as the “population” to be fit. For a comparison between primary PCa and metastatic PCa, a proportion test was used, in which the null hypothesis was that the proportions of the focused mutation in the 2 PCa categories were equal. The results indicated that, compared to primary PCa, the hotspot mutation profile of metastatic PCa was more similar to that of panCancer. Three (or eight) mutations showed significantly different frequencies (P < .05) between metastatic (or primary) PCa and panCancer. Here, the genetic substitution ENST00000269305.8:c.743G>A was worth special attention. It was the top one mutation in metastatic PCa with the percentage frequency being over 8.0%, nearly 2 times of the quantity in panCancer. Because the involved mutation records were collected from multiple studies, the observed high percentage frequency should be free from a severe sampling bias and might indicate a unique point of the mutation spectrum for metastatic PCa.
TP53 Hotspot mutations in panCancer, primary PCa and metastatic PCa.*
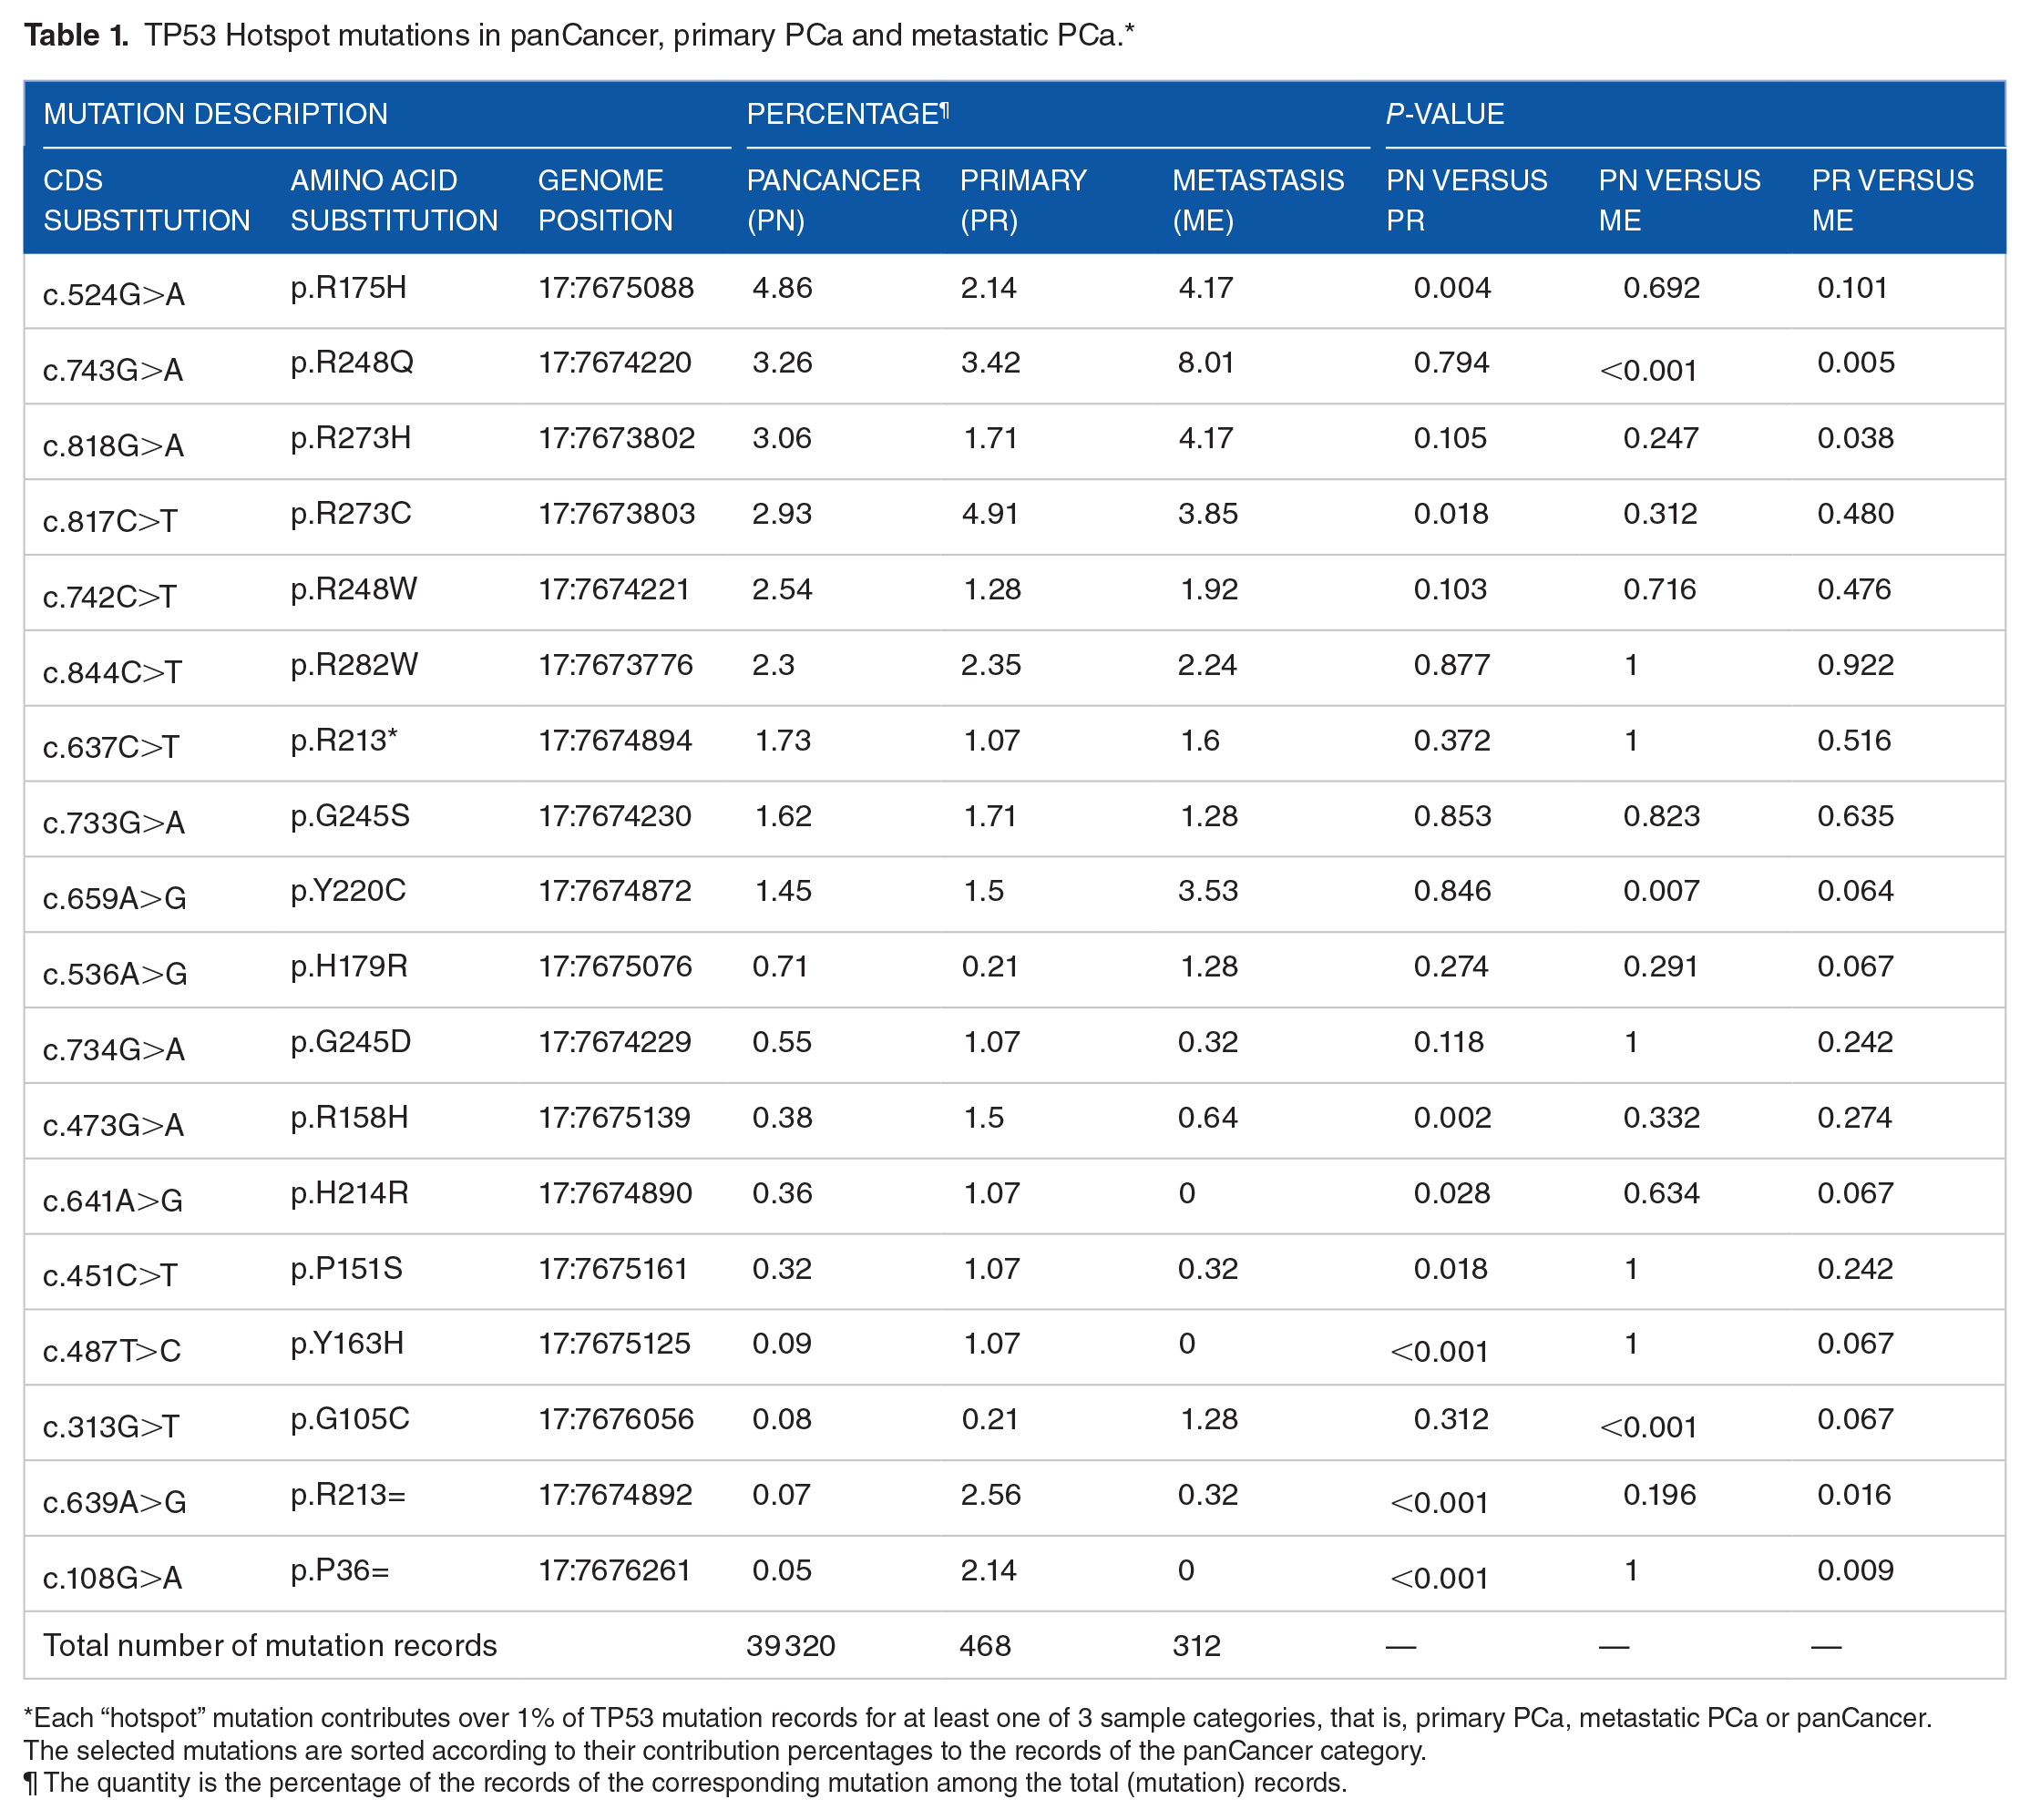
Each “hotspot” mutation contributes over 1% of TP53 mutation records for at least one of 3 sample categories, that is, primary PCa, metastatic PCa or panCancer. The selected mutations are sorted according to their contribution percentages to the records of the panCancer category.
The quantity is the percentage of the records of the corresponding mutation among the total (mutation) records.
Modeling the prevalence of TP53 mutations in metastatic prostate tumors
Based on the hypotheses H1 and H2 and several assumptions about the relationship between the metastasis-promoting effect of TP53 mutations and their timespans, we propose 4 mathematical models to decipher the change of the percentage frequency (prevalence) of somatic TP53 mutations in PCa progression. The symbols and terms used in our model equations and the related description are defined as follows.
A-O-D:


Model-1
This model is based on the assumption that the probability of the

In (1),

Then, the formula to calculate

Model-2
This model is based on one general and 3 specific assumptions. The general assumption is that the probability of the

Using

From the equation (4), we derive the formulae for calculating m and

and

Model-3
This model had the same general assumption and the specific assumptions (i) and (ii) as the Model-2. However, the relationship between the metastasis probability increment and mutation timespan is modeled by a cosine function, that is,


Model-4
This model had the same general assumption and the specific assumptions (i) and (ii) as the Model-2. However, the relationship between the probability increment and mutation timespan is modeled by an exponential function, that is,
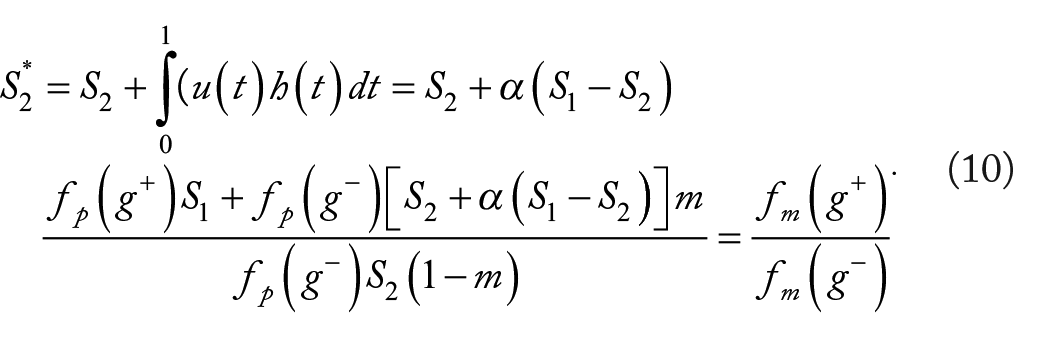


Here, 2 things are worth noting. First, the equations (11) and (12) can be considered as the general formulae for calculating m and
Inferring
The assumedly known

After some mathematical transformations, we had the following formula for

In this setting, the iteration procedure took the following steps.
(1) Initialize
(2) Replace
(3) Calculate
(4) Repeat (2) and (3) until convergence for m and
Model comparison
In all 4 models, the required inputs for calculating m and

The relationships between TP53 mutation-caused fold change of metastasis probability and 2 metrics (ie, m and m*) for TP53 mutations arising after diagnosis of the original cancers. Metastasis ratio (
Model application
The implementation procedure of the proposed models includes 4 steps: estimate
Discussion
The plausibility of the complementary hypotheses H1 and H2 was the first issue addressed in this study. For H1, the significant supporting evidence revealed by our analysis included the associations between TP53 status and a few clinical characteristics (or outcome), that is, Gleason score, progression stage (t-stage) and disease-free survival time. The supporting evidence for H2 included the association between TP53-status and t-stage, and the substantial existence of the mutations solely observed in metastatic PCa samples. In addition, we found that, at the diagnosis dates, patients with TP53-mutated metastases were 2 years younger than those with TP53-wild-type metastases in terms of median ages. While the statistical significance level of such a difference was modest (one tail P = .07), we expect that this could prove to be direct supporting evidence for H1, as more data is accumulated. This perception is based on the following reasons. First, the limited sample sizes in the current analysis might impact the statistical power, especially in the context that cancer patients had a quite wide age range. Second, the earlier onset of TP53-mutated metastases implies that abnormal p53 protein can facilitate tumor metastasis, which is consistent with a recent study about the effect of mutant p53 on ovarian cancer progression in mice. 48
Regarding TP53 mutation features, we found that the single nucleotide variants in PCa metastases more frequently occurred on the G bases of the coding sequence of the gene compared to those in primary cancers, and the percentage frequency profile of hotspot mutations was different between the 2 PCa categories. We deemed these results as “suggestive” evidence for H2. The reason was that, only in the case that individual TP53 mutation was equally efficient in promoting cancer progression, the observed changes in the mutation profile from primary PCa to metastatic PCa could be convincingly attributed to the mutation events that occurred after the diagnosis of original cancers. However, the “equal efficiency” assumption might be questionable. We have this concern because previous studies showed that mutations within the exon 4 of TP53 were particularly associated with poor prognosis in breast cancer patients, and mutations in exons 1 to 4 were more lethal than those in exons 5 to 9 for the patients with lung adenocarcinomas.9,49 In particular, the poor prognosis associated with exon 4 mutations was probably related to the importance of this region in cell apoptosis. 50 At present, due to the lack of necessary data, it is still challenging to conduct a similar survival analysis in PCa to clarify this issue. In other words, much larger cohort data (compared to the TCGA one) would be needed to evaluate the relative effects of individual mutations and mutation clusters on cancer-free survival.
A novel finding in this study was that, compared to primary PCa, the profile of the TP53 hotspot mutations in metastatic PCa was more similar to that in panCancer. This observation, together with the well-known understanding that the cancer types with high TP53 mutation rates (such as bladder cancer and colorectal cancer) are generally more lethal than primary PCa, 51 suggests that the occurrence of TP53 mutations in tumor cells represents a crucial driving force in the process from less aggressive PCa to TP53 mutation-enriched metastatic PCa. In particular, because PCa coincidence rate was as high as 70% among the patients with bladder cancer, 52 it could be interesting to investigate the potential association between the coincidence and TP53-status in these 2 cancer types.
In this paper, we propose a set of mathematical models to decipher the prevalence change of somatic TP53 mutations in PCa progression. Using these models, we estimated that 39.7% of TP53 mutation records collected from metastases arose after the diagnosis of original cancers. According to the results from analyzing the COSMIC data, 36.2% of TP53 mutation records of metastatic PCa were consisted of the “unique mutations” present in the metastatic PCa samples but not in the primary cancers. These quantities indicate that the increment of the prevalence of TP53 mutations in metastatic PCa could be mostly attributed to the hits of those unique mutations. We also estimated that the probability that TP53 wild-type primary cancers acquire TP53 mutations (during the follow-up periods) after the original diagnosis ranged from 8% to 13%. The quantity is comparable to the mutation prevalence observed in primary cancer. Previous studies showed that there was a growing period of ~10 years between the genesis of initial tumorous cells and a tumor that can be detected by transvaginal ultrasound, 53 close to the timespan from a primary PCa to its distant metastases. 54 These observations and findings suggest that TP53 mutation (and mutation accumulation) rate over time is largely consistent in the growing period and progression period of advanced prostate cancer.
Besides the aforementioned insights into PCa progression, our results uncover a potential pitfall in the study of tumor evolution. Phylogenetic trees were often used to infer the temporal order of multiple driver mutations of individual cancer drivers.55-60 When this approach is applied to static tumor sample data, it typically leads to such a conclusion (or a similar one) that the genetic alterations on the most frequently mutated driver gene(s) (for a specific cancer type) occur before those on the other drivers. However, the plausibility of our hypothesis H2 indicates that, from a predominant driver gene (such as TP53 for advanced PCa), mutations may substantially arise in both the early and later time of cancer development.
Our mathematical models can also be applied to decipher the prevalence of the somatic mutations on TP53 (or other main driver genes) in other cancer types. The most subjective assumption of these models is the function
Footnotes
Acknowledgements
The analyses presented here are based on the data generated by the TCGA Research Network and the data collected by Catalogue of Somatic Mutations in Cancer (COSMIC). The authors downloaded the TCGA and COSMIC datasets from https://portal.gdc.cancer.gov/legacy-archive/search/f and ![]() , respectively. The authors are grateful to the 2 reviewers for their constructive comments which significantly improved this paper.
, respectively. The authors are grateful to the 2 reviewers for their constructive comments which significantly improved this paper.
Funding:
The author(s) disclosed receipt of the following financial support for the research, authorship, and/or publication of this article: This research is supported by the NIH grant 5U54MD007595 (WZ and KZ). The funders have no role in study design, data collection and analysis, decision to publish, or preparation of the manuscript.
Declaration of conflicting interests:
The author(s) declared no potential conflicts of interest with respect to the research, authorship, and/or publication of this article.
Author Contributions
Study conceiving: WZ, KZ. Method design: WZ, KZ, YD, OS. Experiments performing: WZ. Data analysis: WZ, KZ. Writing: WZ, KZ, YD, OS. All authors read and approved the final manuscript.