
Abstract
Increasing evidence suggests that the glutathione peroxidase 2 may actually play important roles in tumorigenesis and progression in various human cancers such as colorectal carcinomas and lung adenocarcinomas. However, the role of glutathione peroxidase 2 in gastric carcinoma remains to be determined. In this study, the expression and prognostic significance of glutathione peroxidase 2 in gastric carcinoma were investigated and the well-known prognostic factor Ki-67 labeling index was also assessed as positive control. Glutathione peroxidase 2 expression levels in the tumor tissue specimens, the matched adjacent normal tissue specimens, and the lymph node metastases of 176 patients with gastric carcinoma were evaluated by quantitative polymerase chain reaction, western blotting, and immunohistochemical staining. The associations between glutathione peroxidase 2 expression levels, as determined by immunohistochemical staining, and multiple clinicopathological characteristics were determined by Pearson’s chi-square test and Spearman’s correlation analysis. The relationships between glutathione peroxidase 2 expression and other clinicopathological variables and patient prognoses were analyzed further by the Kaplan–Meier method, the log-rank test, and Cox multivariate regression. The quantitative polymerase chain reaction, western blotting, and immunohistochemical staining results showed that glutathione peroxidase 2 expression levels were upregulated in both the primary tumor foci and the lymph node metastases of patients with gastric carcinoma (all p values < 0.05). Furthermore, Pearson’s chi-square tests, as well as Spearman’s correlation analysis, revealed that glutathione peroxidase 2 expression levels were strongly correlated with the Ki-67 labeling index, differentiation, histological patterns, Lauren classifications, lymph node metastasis, vascular invasion, tumor–node–metastasis stages, Helicobacter pylori infection, and overall survival (all p values < 0.05). Kaplan–Meier analysis, as well as the log-rank test and multivariate Cox regression analysis, showed that multiple clinicopathological risk factors and glutathione peroxidase 2 expression were novel independent prognostic factors for gastric carcinoma (all p values < 0.05). Glutathione peroxidase 2 expression is a novel independent prognostic biomarker for gastric carcinoma that may be used to devise personalized therapeutic regimens and precision treatments for this disease.
Introduction
Gastric carcinoma (GC), which is the fourth most common malignant tumor and the second leading cause of cancer-related death, is a considerable health problem worldwide, especially in Asia. 1 The prognosis of GC is generally poor, as the 5-year survival rate has been reported to be less than 10 percent in some surveys. 2 In addition to late diagnosis, tumor heterogeneity may also be a main cause of the poor prognosis of GC. This heterogeneity results from the complex etiology and pathogenesis of the disease, as well as differences in the anatomical, histological, and molecular features of its subtype classifications, which cause variations in disease therapeutic efficacy.1,3 Therefore, it is essential to identify the prognostic factors of GC that integrate the various risk factors to develop precise treatments for the disease.
Glutathione peroxidase 2 (GPx2) is a gastrointestinal tract–enriched selenium-containing antioxidant enzyme that is reportedly responsible for glutathione-dependent H2O2-scavenging activity at the cellular level in the gastrointestinal tract, as well as responsible for microflora and acute colitis.4–7 The roles of GPx2 in tumor formation and progression have gradually been elucidated. Elevated GPx2 levels have been observed in squamous carcinoma, Barrett’s esophagus, breast carcinoma, non-small-cell lung carcinoma, colorectal carcinoma, hepatocellular carcinoma, and prostatic carcinoma tissues.8–15 GPx2 overexpression has been implicated in tumor initiation, growth, development, and metastasis in colorectal, hepatocellular, and prostate carcinoma and is strongly correlated with early disease recurrence, as well as low disease-free and overall survival rates.13–17 However, some other studies have observed correlations between GPx2 underexpression and unfavorable clinical outcomes in urothelial and esophageal squamous cell carcinomas.18,19
To date, no evidence has been reported regarding the expression status, the specific roles of GPx2, or the clinical significance of GPx2 in GC. Therefore, in this study, we evaluated GPx2 expression in GC specimens and analyzed the associations between GPx2 levels and the clinicopathological characteristics and overall survival of patients. Additionally, we measured the expression levels of Ki-67, a well-established prognostic biomarker for GC and other malignant tumors, as this parameter served as a positive control.
Materials and methods
Patients and specimens
All procedures described in this study were performed in strict accordance with accepted medical ethics principles and were approved by the ethics committee of Harbin Medical University Hospital.
All specimens and clinicopathological data were collected from 176 patients with GC who underwent surgery in the Affiliated Hospital of Harbin Medical University between January 2008 and December 2009 and provided informed consent. Patients who died of surgery-related complications and non-tumor-related diseases, as well as patients who received pre-operative radiotherapy or chemotherapy, were excluded from the study. All the patients enrolled in the study were followed up until March 2016 or until death. The median follow-up period was 20.5 months (range: 0.5–72 months). Tumor–node–metastasis (TNM) staging was performed according to the American Joint Committee on Cancer (AJCC) staging system (7th edition).
The clinical samples in this study consisted of paraffin-embedded specimens and snap-frozen specimens, and the paraffin-embedded specimens that were used for histopathological analysis comprised 176 tumor samples (tumor; within the primary tumor focus), 176 matched adjacent normal tissue samples (control; 5 cm distant from the tumor margin), and 133 lymph node (LN) metastasis samples (local draining LNs with definite metastasis) that were resected during surgery. All the tissue specimens were collected in accordance with standard protocols, and their diagnoses were confirmed by examinations by two experienced pathologists. In all, 79 pairs of liquid nitrogen-stored specimens (paired tumor and matched control samples immediately frozen in liquid nitrogen after resection) were made available for quantitative polymerase chain reaction (qPCR) and western blotting.
qPCR
Total RNA was extracted using TRIzol reagent (Thermo Fisher Scientific, USA), and complementary DNA (cDNA) was synthesized using a Transcriptor First-strand cDNA Synthesis Kit (Roche, Germany). The qPCR was conducted in a LightCycler® 480 PCR System (Roche), according to the manufacturer’s instructions. The following primers were used for the experiment: GPx2: 5′-GCCTCCTTAAAGTTGCCATA-3′ (forward primer) and 5′-GCCCAGAGTTAC CCA-3′ (reverse primer); and glyceraldehyde-3-phosphate dehydrogenase (GAPDH): 5′-GCATCCTGCACCACCAACTG-3′ (forward primer) and 5′-GCCTGCTTCACCACCTTCTT-3′ (reverse primer). The relative expression levels of GPx2 were calculated and normalized to those of GAPDH using the 2−ΔΔCt method.
Western blotting
Total protein was extracted using radioimmunoprecipitation lysis buffer (Invitrogen, USA), and 30 µg protein/lane was resolved on 12% polyacrylamide gels and electoblotted onto polyvinylidene difluoride membranes (Millipore, USA). GPx2 expression was assessed by polyclonal rabbit anti-GPx2 (catalog no.: SAB2700207; IgG; 1:1000; Sigma-Aldrich, USA). β-actin expression was assessed by polyclonal rabbit anti-β-actin (catalog no.: SAB2100037; IgG; 1:1000; Sigma-Aldrich, USA), which served as the loading control. Protein expression levels were measured using Image-Pro Plus 6.0 software (Media Cybernetics, Inc., USA).
Immunohistochemical analysis
For immunohistochemical staining, 4-µm-thick paraffin sections were prepared, and target protein expression levels were evaluated in situ with the indicated primary antibodies (polyclonal rabbit anti-GPx2 (catalog no. SAB2700207) or polyclonal rabbit anti-Ki-67 (catalog no. PLA0228); IgGs; 1:100; Sigma-Aldrich, USA], according to standard protocols. For quantitative analyses of GPx2 expression levels and the Ki-67 labeling index (Ki-67-positive cell percentage), we imaged randomly selected areas within the adjacent normal tissue specimens; the primary tumor specimens, which displayed varying degrees of differentiation; and the LN metastasis specimens at 40× magnification. The integrated optical density (IOD) values for the GPx2-stained cells and the percentages of Ki-67-labeled cells were calculated by Image-Pro Plus 6.0 software (Media Cybernetics, Inc.). Normalization was subsequently performed by dividing the area occupied by these cells by the total area of the field in question.
The patients enrolled in this study were divided into separate groups as reported previously, with slight modifications.20,21 Patients were separated into groups according to their GPx2 expression levels, that is, patients with a GPx2 IOD ratio (tumor tissue/adjacent normal tissue) <1.5 were defined as having a low GPx2 expression level (GPx2Low), and patients with a GPx2 IOD ratio ≥1.5 were defined as having a high GPx2 expression level (GPx2High). Patients were also separated into groups according to their Ki-67 labeling indices. The two groups were separated by a Ki-67 labeling index cutoff of 10%; thus, patients with Ki-67 labeling indices below and above the cutoff were assigned to Ki-67-negative (<10%) and Ki-67-positive (≥10%) groups, respectively.
Statistical analysis
All the data were processed and analyzed using Microsoft Excel and SPSS® version 23.0. The data pertaining to the qPCR, western blotting, and immunohistochemistry results were presented as the mean ± standard error of the mean (SEM). Paired Student’s t-tests and one-way analysis of variance were performed to analyze between-group differences, and linear regression analysis, Spearman’s correlation analysis, Pearson’s chi-square test, Kaplan–Meier survival analysis, the log-rank test, and multivariate Cox regression analysis were conducted when appropriate; p < 0.05 was considered statistically significant.
Results
GPx2 and Ki-67 expression levels were elevated in GC tissues
To compare the expression levels of GPx2 in GC tissues with those in adjacent normal tissues, we performed qPCR and western blotting. As shown in Figure 1, GPx2 messenger RNA (mRNA) and protein expression levels were significantly elevated in GC tissues compared with the matched normal tissues (control; both p < 0.01). Immunohistochemical analysis was performed to further determine the associations between GPx2 expression levels in tumor tissues and other clinicopathological characteristics. Only trace or undetectable GPx2 expression levels were noted in adjacent normal tissues, whereas higher GPx2 expression levels were detected in well-, moderately, and poorly differentiated tumor tissues (Figure 2(a) and (b); p < 0.001). GPx2 expression levels were increased in metastatic foci in LN metastases compared with primary tumor foci (p < 0.001). The Ki-67 labeling index, the most widely used clinicopathological marker of tumor cell proliferation, was also measured by immunostaining. Similar to GPx2 expression levels, Ki-67+ cell percentages increased gradually from normal tissues to primary tumor tissues displaying varying degrees of differentiation to metastatic foci in LNs (Figure 2(a) and (c); p < 0.001). Linear regression and Spearman’s correlation analyses confirmed the existence of a significant positive correlation between GPx2 expression levels and the Ki-67 labeling index (Figure 2(d); p < 0.001).

qPCR and western blotting analyses showed that GPx2 expression levels were elevated in GC tissues. Quantitative analyses of GPx2 (a) mRNA and (c) protein expression levels in tumor tissues relative to control tissues (n = 79). Data are expressed as the mean ± SEM (**p < 0.01; ***p < 0.001). (b) Representative western blotting images of GPx2 expression in gastric carcinoma tissues (tumor) and matched adjacent normal tissues (control).

Immunohistochemical staining revealed that GPx2 expression levels were elevated in GC tissues and were correlated with the Ki-67 labeling index. (a) Representative immunohistochemical staining images of GPx2 and Ki-67 expression in normal tissues (control), primary gastric carcinoma tissues with varying degrees of tumor differentiation (well-differentiated, moderately differentiated, and poorly differentiated), and metastatic tumor foci in LNs (LN metastasis; scale bar = 100 µm). Quantitative analyses of (b) GPx2 expression levels and (c) Ki-67 positivity in tumor tissues relative to control tissues (n = 176). Data are expressed as the mean ± SEM (***p < 0.001). (d) Quantitative analysis of the correlation between GPx2 expression levels and Ki-67 positivity in GC tissues.
GPx2 levels were correlated with the clinicopathological characteristics of patients with GC
To determine the associations between the expression levels of GPx2 and the major clinicopathological characteristics of the 176 patients with GC who were enrolled in this study, we divided all the patients in question into two groups comprising individuals with high GPx2 expression levels (GPx2High) and low GPx2 expression levels (GPx2Low), respectively, as described in the “Materials and methods” section. Pearson’s chi-square tests confirmed that GPx2 expression levels were positively correlated with Ki-67 expression status in GC tissues (p < 0.01; Table 1). Moreover, high GPx2 expression levels were also found to be significantly associated with low-grade differentiation, aggressive tumor histological patterns (signet ring cell carcinoma (SRCC)), Lauren classifications (diffused), LN metastasis, vascular invasion, advanced TNM stages, and Helicobacter pylori infection (all p values < 0.05; Table 1). However, no significant correlations were noted between GPx2 expression levels and the following clinicopathological parameters: age, gender, tumor size, and serum carcinoembryonic antigen (CEA) and carbohydrate antigen (CA) 19-9 levels (all p values > 0.05; Table 1). These data suggested that high GPx2 expression levels in GC are correlated with risk factors for disease aggressiveness and progression.
Correlations between GPx2 expression levels and clinicopathological characteristics.

SRCC: signet ring cell carcinoma; TNM: tumor–node–metastasis; CEA: carcinoembryonic antigen.
The values are statistically significant.
Prognostic significance of GPx2 levels with respect to the survival of patients with GC
Kaplan–Meier analysis and the log-rank test were performed to determine the relationships between overall survival and GPx2 expression levels and other clinicopathological variables. As shown in Figure 3 and Table 2, patients with low GPx2 expression levels exhibited significantly better overall survival (median overall survival: 35.0 months; 95% confidence interval (CI): 28.8–41.2 months)] than patients with high GPx2 expression levels (median overall survival: 19.0 months; 95% CI: 26.2–47.8 months; p < 0.01), indicating that GPx2 levels have prognostic significance with respect to the survival of patients with GC. As expected, the Ki-67 labeling index, which was significantly positively correlated with GPx2 expression levels, was also found to have a significant effect on the prognosis of GC (Figure 3 and Table 2; p < 0.001). The following factors were also found to have a significant effect on overall survival: tumor differentiation status, histological patterns, Lauren classifications, LN metastasis, vascular invasion, and TNM stages (all p values < 0.05; Table 2). To identify the independent prognostic factors for GC, the seven factors that were identified by the log-rank test were subjected to multivariate Cox regression analysis (Table 3). The results of this analysis revealed that among the clinicopathological variables related to patient prognoses, only GPx2 levels (hazard ratio (HR) = 1.635; p = 0.021), Ki-67 status (HR = 4.290; p < 0.001), TNM stages (HR = 4.423; p < 0.001), histological patterns (HR = 1.651; p = 0.021), and Lauren classifications (HR = 1.739; p = 0.009) were independent prognostic factors for GC. Taken together, these findings indicated that GPx2 expression levels were strongly correlated with the risk factors for GC progression and may thus act as a novel independent prognostic biomarker for this disease.
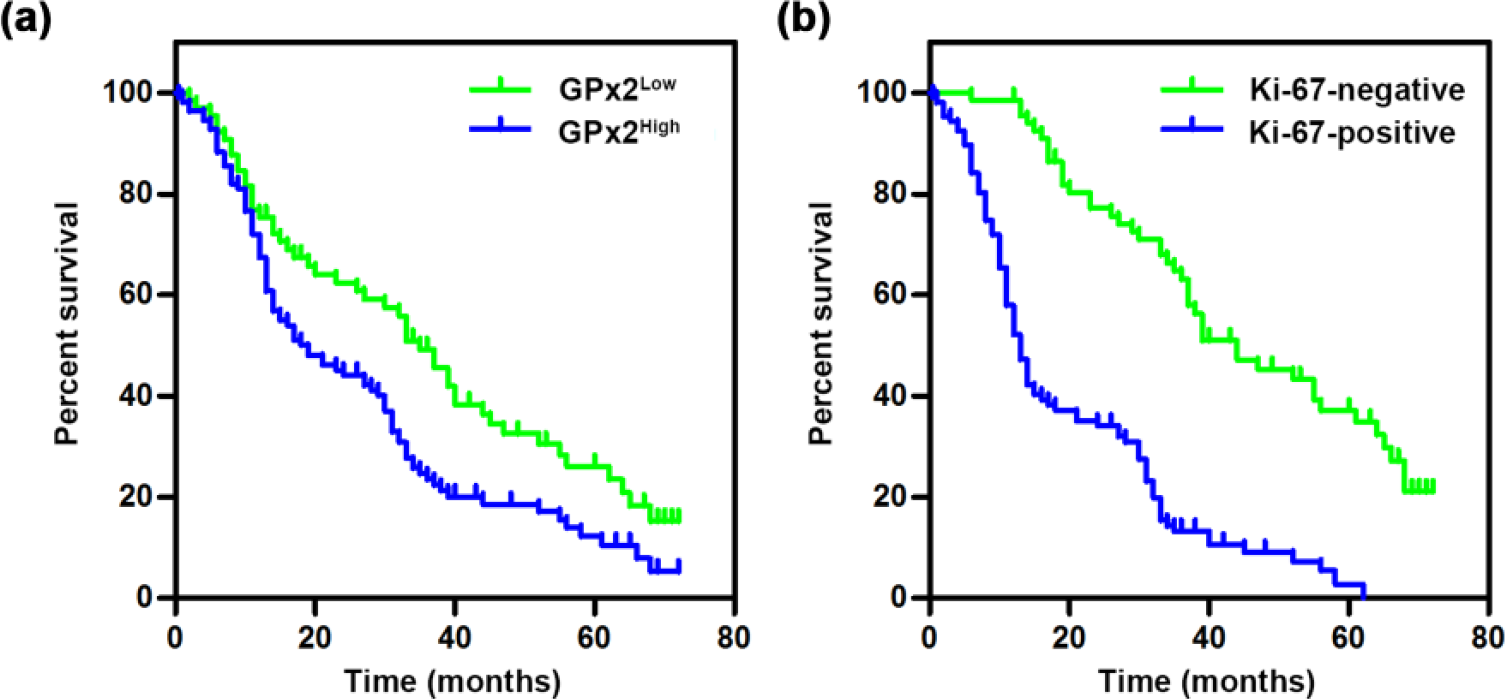
Kaplan–Meier analysis of overall survival in patients with GC. (a) Overall survival in patients with low or high GPx2 expression levels. (b) Overall survival in patients with negative Ki-67 or positive Ki-67 expression (n = 176).
Univariate log-rank test for overall survival in 176 patients with GC.

SRCC: signet ring cell carcinoma; TNM: tumor–node–metastasis; CEA: carcinoembryonic antigen.
The values indicate statistical significance.
Multivariate Cox regression analysis of overall survival in 176 patients with GC.

HR: hazard ratio; CI: confidence interval; TNM: tumor–node–metastasis; GC: gastric carcinoma; SRCC: signet ring cell carcinoma.
The values are statistically significant.
Discussion
GPx2, a gastrointestinal tract–enriched selenium-containing and glutathione-dependent antioxidant enzyme, has been demonstrated to be an important gastrointestinal reactive oxygen species (ROS) scavenger and is responsible for maintaining gastrointestinal homeostasis.4–7 Upregulated GPx2 expression levels have recently been detected in a variety of premalignant conditions, as well as in epithelium-derived carcinomas and have been shown to be involved in carcinogen-induced tumor initiation and resultant tumor growth and metastasis.8–17 Clinical analyses have shown that elevated GPx2 levels are associated with early colorectal carcinoma recurrence and low disease-free and overall survival in prostate carcinoma.13,15 In this study, GPx2 overexpression was observed for the first time in both primary GC foci and metastatic GC foci in LNs (Figures 1 and 2). Moreover, GPx2 expression levels in tumor tissues were found to be strongly correlated with malignancy-related clinicopathological variables and overall survival of patients with GC (Tables 1 and 2, Figure 3).
In this study, the clinicopathological characteristics that were found to be closely associated with GPx2 expression included the Ki-67 labeling index, tumor differentiation, tumor histological patterns, Lauren classifications, LN metastasis, vascular invasion, TNM stages, and H. pylori infection. The Ki-67 labeling index, the most widely used histopathological marker for assessing tumor cell proliferation and tumor growth, is strongly correlated with the clinical courses and prognoses of various malignant tumors, such as gliomas, breast carcinomas, and gastrointestinal carcinomas.22–24 Consistent with the results of previous studies, our results revealed that a high Ki-67 labeling index was associated with shorter overall survival in patients with GC. We also found that the percentages of Ki-67-positive proliferating tumor cells were highly parallel to the expression levels of GPx2 in well-, moderately, and poorly differentiated primary GC foci and metastatic GC foci in LNs (Figure 1; Table 1), suggesting that increases in GPx2 expression may result from adaptations by tumor cells exhibiting Warburg metabolism, that is, increased glycolysis despite the presence of oxygen, enabling them to exert ROS-scavenging effects to protect themselves from oxidative damage and consequently to maintain their rapid proliferation rates.25,26 LN metastasis and vascular invasion, the classical indicators of poor prognoses in patients with GC and other malignant tumors, 27 were observed in the patients enrolled in this study and were strongly correlated with low survival rates and increased GPx2 levels in tumor foci. The increases in GPx2 expression levels in LN metastasis, which were consistent with the increases in GPx2 expression levels in metastatic tumor foci compared with primary tumor foci (Figure 2), suggested that active GC cells displaying GPx2 overexpression may display an enhanced capacity for metastasis similar to that displayed by colorectal cancer cells. 13 Furthermore, the significant associations between GPx2 expression and LN metastasis and vascular invasion may indicate that both processes are regulated by a common mechanism or that GPx2-mediated maintenance of redox homeostasis serves as an upstream switch responsible for activating invasion and metastasis-related signaling cascades resembling those associated with colorectal carcinoma metastasis or protects metastasizing tumor cells that are vulnerable to oxidative damage.13,28
Additionally, in this study, we noted for the first time the existence of a strong correlation between elevated GPx2 expression levels and dedifferentiation, SRCC and diffuse GC, all of which are characterized by highly malignant phenotypes, such as poor cohesiveness and active invasion and metastasis, and low 5-year survival rates.29,30 In the GC specimens tested, tumor cells displaying upregulated GPx2 expression-mediated stress resistance simultaneously exhibited vigorous proliferation, aggressiveness, and naïve differentiation, characteristics resembling those exhibited by cancer stem cells; 31 however, the molecular characteristics and transcription profiles of these cells remain to be determined. Moreover, the increased GPx2 expression levels in tela were significantly associated with H. pylori infection, which is a well-established risk factor for and important cause of sporadic GC that was not recognized as a prognostic factor in this study (Table 2), nor was it recognized as a prognostic factor in previous studies.1,32 This result suggests that changes in GPx2 expression resulting from H. pylori infection, changes that are probably similar to those resulting from intestinal microflora alterations,6,32 may also be involved in initiating carcinogenesis in GC. Eventually, GPx2 expression levels, which were found to be strongly correlated with TNM stages (the most accepted prognostic indicator; Table 1) and successfully integrated the data pertaining to the multiple above-mentioned risk factors analyzed, were also identified as a novel independent prognostic factor for GC by Kaplan–Meier analysis and the log-rank test, as well as multivariate Cox regression analysis, indicating that GPx2 is a clinically significant biomarker that may be used to devise individualized therapies and precise treatments for GC.
However, the results of some studies indicate that GPx2 may play a protective role in urothelial and esophageal squamous cell carcinomas. These studies showed that decreased GPx2 expression levels were correlated with reduced survival in the above cancers.18,19 Thus, the results of the studies in question were inconsistent with those of this study and previous studies, which showed that increased GPx2 expression was associated with malignancy and poor prognoses in gastric, colorectal, and prostate carcinomas.13,15 The above findings indicate that GPx2 is differentially expressed and plays different roles in different tumors. In contrast to its antitumor role in urothelial squamous cell carcinomas, GPx2 may play a protective role in adenocarcinomas by defending highly proliferative tumor cells from p53-dependent oxidative damage. 33 This phenomenon may be the common mechanism by which GPx2 promotes malignancy in these gland cell–derived carcinomas susceptible to oxidative stress.34–36 However, the specific underlying mechanisms remain to be determined.
In summary, our findings indicate that GPx2 expression levels are increased in both primary tumor foci and lymphatic metastases in GC and are strongly correlated with various clinicopathological characteristic associated with tumorigenesis and aggressiveness, including the Ki-67 labeling index, tumor differentiation, tumor histological patterns, Lauren classifications, LN metastasis, vascular invasion, TNM stages, and H. pylori infection. Our results also indicate that GPx2 expression is a novel independent prognostic biomarker for GC that may be used to devise individualized therapies and precision treatments for this disease.
Footnotes
Acknowledgements
The authors thank Yonggang Liu for technical support.
Compliance with ethical standards
This study was approved by the Ethics Committee of Harbin Medical University Hospital.
Declaration of conflicts of interests
The author(s) declared no potential conflicts of interest with respect to the research, authorship, and/or publication of this article.
Funding
The author(s) received no financial support for the research, authorship, and/or publication of this article.