
Abstract
MicroRNAs are a kind of small and non-coding RNAs, which have been demonstrated to play an important role in the progression of human cervical cancer. Here, we found that the expression of miR-205 was low in cervical cancer cell lines and tissues, compared with matched non-tumor tissues and human endocervical epithelial cells. Also, miR-205 was inversely correlated with histological differentiation, metastasis, International Federation of Gynecology and Obstetrics stage, and the expression of insulin-like growth factor receptor 1 messenger RNA and protein. Besides, miR-205 or insulin-like growth factor receptor 1 expression is an independent prognostic factor. Mechanically, ectopic expression of miR-205 decreased proliferation, colony formation, and some proliferation/apoptosis-related proteins in cervical cancer cells. Ectopic expression of miR-205 caused G1 arrest. Luciferase reporter assays confirmed that binding of miR-205 to the 3′ untranslated region of insulin-like growth factor receptor 1 may potentially decrease the expression of insulin-like growth factor receptor 1. Notably, insulin-like growth factor receptor 1 overexpression attenuated the inhibitory effects of miR-205 on cell proliferation and invasion, while small interfering RNA–insulin-like growth factor receptor 1 enhanced the inhibitory effects of miR-205 on cell proliferation and invasion. In conclusion, our findings suggested that miR-205 serves as a prognostic factor and suppresses proliferation and invasion by targeting insulin-like growth factor receptor 1 in human cervical cancer. Thus, miR-205/insulin-like growth factor receptor 1 pathway may be of great benefit to cervical cancer patients.
Introduction
Cervical cancer (CC) acts as the second most common tumor among women in this world.1,2 It is estimated that about 5 millions of women patients are newly diagnosed and approximately 2 millions of cases died of CC every year. Accumulating evidence showed that human papillomavirus (oncogenic types) plays a crucial role in the induction and development of human CC.3–5 As reported, some patients did not get infected by human papillomavirus, suggesting that more potential factors promote the malignant progression of CC.6,7 Although some related studies were conducted, the molecular etiology of CC is still largely unknown. In this study, we will investigate the molecular mechanisms implicated in the development of CC.
MicroRNAs (miRNAs) have been reported as a class of about 19–25 nucleotide length non-coding RNAs, which controlled the expression of related genes by binding to the 3′ untranslated region (3′UTR) of target genes based on the post-transcriptional level. 8 Emerging studies have suggested that miRNAs are extensively deregulated in various tumors and exert anti-tumor or oncogenic role in biological progression of tumors, involving cell proliferation, apoptosis, motility, and invasiveness.9–11 MiR-205 was reported to be implicated in normal and pathological processes, including cell regeneration, proliferation, and invasion. 12 In addition, miR-205 exerts diverse effects on the progression of tumors, which relays on cell or tissue type. MiR-205 targets different genes or proteins by post-transcriptional regulation. 13 Notably, insulin-like growth factor receptor 1 (IGF1R) can be regulated at the level of translation by microRNAs directly or indirectly. IGF1R is a transmembrane receptor tyrosine kinase, closely related to the insulin receptor (InsR) that forms homodimers or heterodimerizes with InsR to recognize its ligands, IGF1 and IGF2. 14 Upon ligand binding, IGF1R activates multiple downstream signaling cascades, the two most prominent being phosphoinositide 3-kinase (PI3K)/AKT and RAS/RAF/mitogen-activated protein kinase kinase (MEK)/extracellular signal–regulated kinase (ERK). 15 PI3K/AKT enhances cellular metabolism and protein synthesis via mammalian target of rapamycin (mTOR) and enhances survival via Bcl-2-associated death promoter (BAD)/Bcl-2, p53, nuclear factor kappa B (NF-κB), and forkhead box protein O (FOXO), whereas RAS/RAF/MEK/ERK activation generally results in increased cellular proliferation. 16 However, the potential roles of miR-205 and IGF1R in CC pathogenesis remain unclear.
Here, we used in vitro assays to determine miR-205 expression profiles and analyzed their associations with clinicopathological characteristics and survival in CC patients. Furthermore, we investigated the impact of miR-205 on proliferation and invasion of CC cells in vitro. Finally, we used luciferase assays and western blot analysis to identify IGF1R as a target of miR-205. These findings will provide new insights into the molecular mechanisms underlying CC development and provide a therapeutic strategy for CC patients.
Methods and materials
Ethical statement
This study was approved by the Institutional Review Board of Baodi District Hospital of Tianjin. Written informed consent was obtained from all participants involved in this study.
Cell culture and tissues
Normal human endocervical epithelial cell (NEEC) was generated from human endocervical samples obtained from biopsies of women (22–23 years of age) who underwent surgery for minor gynecological issues and had no underlying endocervical pathology. None of them had received hormonal therapy in the 3 months preceding sample collection. Samples were minced into fragments <1 mm and subjected to mild collagenase digestion. NEEC was cultured to confluence in a steroid-depleted medium composed of 75% Dulbecco’s Modified Eagle’s Medium (DMEM) (Sigma, St. Louis, MO, USA) supplemented with antibiotics, 10% human albumin, and 5 mg/mL insulin (Sigma). Human CC cell lines SiHa, CaSki, and HeLa were purchased from American Type Culture Collection (Manassas, VA, USA). All cells were cultured in DMEM, 10% fetal bovine serum (Gibco, Grand Island, NY, USA), and 1% penicillin–streptomycin (Gibco) at 37°C in a humidified atmosphere under 5% CO2. In this study, 30 cases of CC samples and matched adjacent normal cervical tissues were randomly chosen from the Department of Pathology in Baodi District Hospital of Tianjin from January 2013 to January 2015. All samples were fixed with 10% formaldehyde and embedded with paraffin. Informed consent was obtained from all the patients.
Transfection
SiHa and HeLa cell lines were used for transfection. Oligonucleotides of miR-205 mimics, miRNA mimic negative control (mimic NC) were all purchased from Ambion (St. Austin, TX, USA). Cells (2 × 10⁵) were cultured in six-well plates for 24 h and were then transfected with 100 nM miR-205 mimics, miR-205, or corresponding controls using the jetPEI transfection kit (Polyplus Transfection, New York, NY, USA) according to the manufacturer’s instructions. Transfection efficiency was determined by quantitative real-time polymerase chain reaction (qRT-PCR). Besides, we used Lipofectamine 2000 transfection reagent (Invitrogen, Carlsbad, CA, USA) to carry out transfection of plasmids. In this work, IGF1R complementary DNA (cDNA) without carrying its 3′UTR was inserted into pcDNA3.1(+) vector to generate the recombinant pcDNA3.1(+)-IGF1R plasmid. At the same time, the pcDNA3.1(+) vector acts as control. All constructs were identified for sequence correctness using direct sequencing technology (Beijing Aodingsheng Corp., Beijing, China). For small interfering RNA (siRNA) transfection, cells were plated on six-well plates. After 24 h, the cells were transfected with control siRNA or with IGF1R siRNA (Santa Cruz Biotechnology, Santa Cruz, CA, USA) using siRNA transfection reagent (Santa Cruz Biotechnology) according to the manufacturer’s instructions.
RNA extraction and qRT-PCR
Total RNA was extracted from frozen tissues or cultured cells using TRIzol Reagent (Thermo Fisher Scientific, St. Waltham, MA, USA) following the manufacturer’s suggestions. MiR-205 expression was determined using TaqMan miRNA assays (Thermo Fisher Scientific) following the manufacturer’s protocol, and U6 small nuclear RNA (GeneCopoeia, Carlsbad, CA, USA) was used as an endogenous control. The expression of IGF1R was determined using SYBR Green qPCR assay (TaKaRa, Dalian, People’s Republic of China) and normalized with glyceraldehyde 3-phosphate dehydrogenase (GAPDH; GeneCopoeia). The primers used in this study are as follows—IGF1R primers: 5′-GGACTACTACGCCAAAGAAG-3′ (forward) and 5′-TCAAAAGACAGCCACTCAGG-3′ (reverse); GAPDH primers: 5′-TTGGTATCGTGGAAGGACTCA-3′ (forward) and 5′-TGTCATCATATTTGGCAGGTT-3′ (reverse); miR-205 primers: 5′-CTTGTCCTTCATTCCACCGGA-3′ (forward) and 5′-TGCCGCCTGAACTTCACTCC-3′ (reverse); and U6 primers: 5′-CTCGCTTCGGCAGCACA-3′ (forward) and 5′-AACGCTTCACGAATTTGCGT-3′ (reverse).
Western blot analysis
Protein was extracted from cells using 1× radioimmunoprecipitation assay lysis buffer (Santa Cruz Biotechnology), subjected to sodium dodecyl sulfate–polyacrylamide gel electrophoresis (SDS-PAGE), transferred to polyvinylidene difluoride membrane. Membranes were blocked for 2 h in 5% skimmed milk and probed with antibody against human IGF1R, Bcl-2, Bax, and cyclin D1 (1:1000 dilution; Abcam, Cambridge, UK) or β-actin (1:1000 dilution; Santa Cruz Biotechnology) for overnight at 4°C and then with peroxidase-conjugated secondary antibody (1:1000 dilution; Santa Cruz Biotechnology), followed by visualization by chemiluminescence (GE Healthcare, Fairfield, CT, USA).
Luciferase assays
For pGL3-IGF1R-3′UTR plasmid construction, the IGF1R-3′UTR containing miR-205 binding site was amplified by Igene Biotechnology, Co. (Shanghai, China) and cloned into dual-reporter vector pGL3. The PCR primers were designed according to DNA sequence in GenBank (https://www.ncbi.nlm.nih.gov/genbank/). KpnI and XhoI were introduced in the primers for inserting pGL3 vector. For miR-205 binding detection, cells were transiently co-transfected with pGL3-IGF1R-3′UTR and either miR-205 mimics or negative control. pGL3-basic vector was used as a negative control. After 12 h, a dual-luciferase reporter assay system was used to measure luciferase activity according to the manufacturer’s instructions (Promega, Madison, Wisconsin, USA).
Flow cytometry
Cells were detached with ethylenediaminetetraacetic acid (EDTA)–free trypsin and washed with phosphate-buffered saline (PBS) twice. The cells were harvested (1–5 × 10⁵). The binding buffer (50 µL) was mixed with 7-aminoactinomycin D (7-ADD) solution, and the cells were added to the mixture, followed by incubation at room temperature in the dark for 5–15 min. Flow cytometry was done using Annexin V-PE Apoptosis Detection Kit (Invitrogen, Beijing, China) at the fluorescence 2 (FL2) channel. At the excitation wavelength of 488 nm and the emission wavelength of 578 nm, orange fluorescence was observed. The 7-ADD was detected via the FL3 channel. Red fluorescence was observed at the excitation wavelength of 546 nm and emission wavelength of 647 nm. All experiments were performed in triplicate.
Assessment of apoptosis by Annexin V–fluorescein isothiocyanate
Apoptotic cell death was measured using fluorescein isothiocyanate (FITC)-conjugated Annexin V/propidium iodide (PI) assay kit by flow cytometry. Briefly, 5 × 10⁵ cells were washed with ice-cold PBS, resuspended in 100 mL of binding buffer, and stained with 5 mL of FITC-conjugated Annexin V (10 mg/mL) and 10 mL of PI (50 mg/mL). The cells were incubated for 15 min at room temperature in the dark, 400 mL of binding buffer was added, and the cells were analyzed (FACScan; Becton, Dickinson and Company, San Jose, CA, USA). The cells were gated separately according to their granularity and size on forward scatter versus side scatter plots. Early and late apoptosis was evaluated on FL2 (for PI) versus FL1 (for Annexin) plots. Cells stained with Annexin V alone were evaluated as being in early apoptosis; cells stained with both Annexin V and PI were evaluated as being in late apoptosis or a necrotic stage.
3-(4,5-Dimethylthiazol-2-yl)-2,5-diphenyltetrazolium bromide
Cells, seeded on 96-well plates, were stained at indicated time points with 100 mL of sterile 3-(4,5-dimethylthiazol-2-yl)-2,5-diphenyltetrazolium bromide (MTT) dye (0.5 mg/mL; Sigma) for 4 h at 37°C, followed by removal of the culture medium and addition of 150 mL of dimethyl sulfoxide (DMSO; Sigma). The absorbance was measured at 570 nm, with 655 nm as the reference wavelength. All the experiments were performed in triplicate.
Invasion assay
For invasion assay, cells were added to the upper well chamber and coated with Matrigel (BD Biosciences, San Jose, CA) for 24 h. Then, cells on the upper membrane surface were removed by careful wiping with a cotton swab, the filters were fixed with 95% ethanol, and then, the cells were stained with 0.2% crystal violet solution (Sigma) and counted.
Statistical analysis
Results of functional experiments are presented as mean values with standard deviation (SD) of three independent experiments performed in triplicates. Comparisons between two independent groups were performed using Student’s t test. For comparisons between dependent groups, the paired t test was utilized. For multiple comparisons of independent groups, analysis of variance (ANOVA) with Tukey–Kramer post-hoc test was applied. Statistical significance was determined by p value of less than 0.05. Statistical analyses were performed using SPSS 17.0 (SPSS, Inc., Chicago, IL, USA).
Results
The expression of miR-205 in CC tissues and cell lines
To further characterize the role and mechanism of miR-205 in CC, we further determined expression of miR-205 in CC and non-cancer samples and in cell lines SiHa and HeLa using qRT-PCR and RT-PCR. qRT-PCR analyses showed that expression of miR-205 was obviously decreased in CC tissues and cell lines as compared with those in normal human non-tumor tissues and NEECs (all p < 0.001; Figure 1(a) and (b)). At the same time, we also examined the expression of miR-205 using RT-PCR. As shown in Figure 2(b), RT-PCR analyses also showed that the expression of miR-205 was obviously decreased in CC tissues and cell lines as compared with those in normal human non-tumor tissues and NEECs (all p < 0.001; Figure 1(a) and (b)). Taken together, our findings suggested that miR-205 is decreased in the development of CC.

MiR-205 expression in CC tissues and cell lines. (a and b) Relative miR-205 expression in CC tissues and CC cell lines (SiHa and HeLa) was detected using qRT-PCR and RT-PCR. The miR-205 expression was normalized to U6 expression. Each bar represents the mean of three independent experiments (*p < 0.001, compared with control, one-way ANOVA).
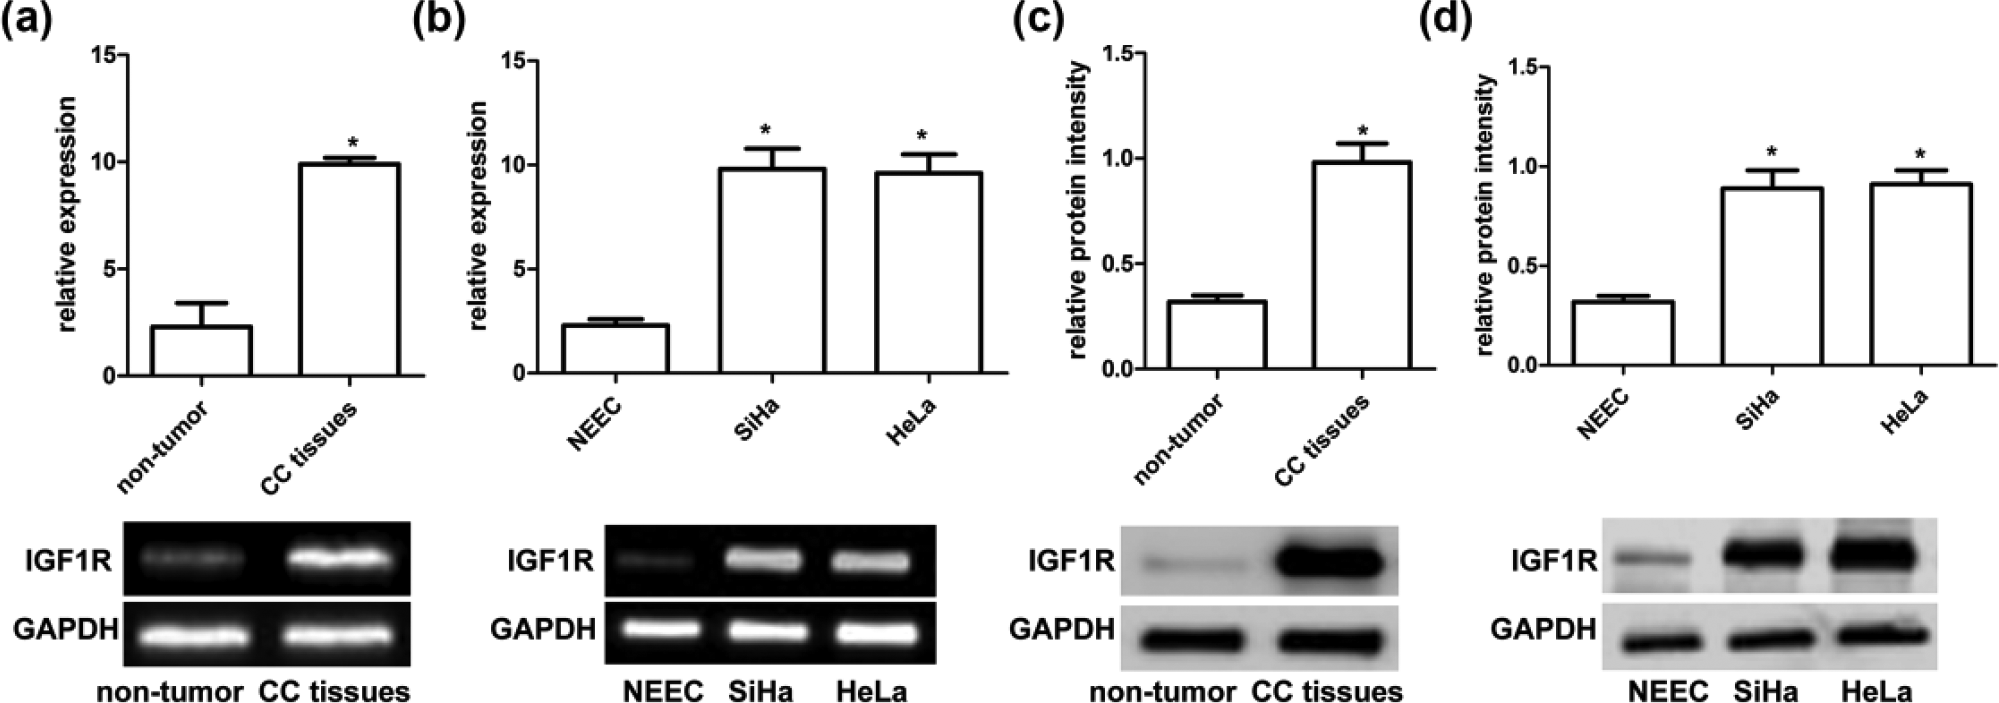
Analysis of IGF1R expression in CC tissues and cell lines. (a and b) qRT-PCR and RT-PCR analysis revealed the expression of IGF1R mRNA in 30 pairs of human CC tissues and cell lines (SiHa and HeLa). Quantification analysis was normalized with GAPDH. GAPDH was used as an internal control. Results shown are the mean ± SEM of repeated independent experiments (*p < 0.001, compared with control, one-way ANOVA). (c and d) The expression of IGF1R protein was examined in 30 pairs of human CC tissues and cell lines (SiHa and HeLa) using western blot analysis. IGF1R protein expression was normalized to GAPDH. Results shown are the mean ± SEM of repeated independent experiments (*p < 0.001, compared with control, one-way ANOVA).
The expression of IGF1R in CC tissues and cell lines
In order to figure out the function and mechanism of IGF1R and miR-205, we first determined the expression of miR-205 in CC and non-cancer samples and in cell lines SiHa and HeLa using qRT-PCR, RT-PCR, and western blot analysis. As shown in Figure 2, the expression of IGF1R messenger RNA (mRNA) was significantly upregulated in CC tissues as compared with those in non-cancer tissues (p < 0.001). In addition, western blot analysis revealed that expression of IGF1R protein was also significantly upregulated in CC tissues as compared with those in non-cancer tissues (p < 0.001). Second, we determined the expression of IGF1R in CC cell lines SiHa and HeLa using qRT-PCR, RT-PCR, and western blot analysis. We observed that the expression of IGF1R mRNA and protein was obviously higher as compared with those in normal NEECs (p < 0.001; Figure 2(b) and (c)).
The expression miR-205 is inversely related to the expression of IGF1R mRNA and protein
Based on the expression of miR-205 and IGF1R, we analyzed the association between miR-205 and IGF1R mRNA and IGF1R protein in 30 cases of CC specimens using Pearson correlation analysis. As illustrated in Figure 3, the linear regression analysis showed that the expression of miR-205 was inversely related to the expression of IGF1R mRNA (r2 = 0.865, p < 0.001; Figure 3(a)). Consistent with IGF1R mRNA, the expression of miR-205 was also inversely related to the expression of IGF1R protein (r2 = 0.832, p < 0.001; Figure 3(b)).

The correlation between miR-205 and IGF1R mRNA or protein expression. The correlation between miR-205 and (a) IGF1R mRNA or (b) protein expression in 30 CC tissues was analyzed using linear regression. The overall survival curves are shown for 30 CC patients with different levels of miR-205 and IGF1R expression. (c) Kaplan–Meier curves for overall survival in 22 patients with low miR-205 expression and 8 patients with high miR-205 expression. The difference between these two groups is determined by the log-rank test. (d) Kaplan–Meier curves for overall survival in 22 patients with high IGF1R expression and 8 patients with low IGF1R expression. The difference between these two groups is determined by the log-rank test.
Association of miR-205 and IGF1R expression with clinicopathology
We summarized the associations of miR-205 expression in CC with clinicopathological indicators as shown in Table 1. We found that the miR-205 expression was not correlated with age and tumor size. The miR-205 expression was obviously lower in patients with International Federation of Gynecology and Obstetrics (FIGO) I + II compared with those with FIGO III + IV (p = 0.001). Notably, the expression of miR-205 was identified to be negatively correlated with histological differentiation and lymph node metastasis (p < 0.05). Likewise, IGF1R expression was alsosignificantly associated with histological differentiation, FIGO stage, or lymph node metastasis (all p < 0.05;Table 1).
Correlations of miR-205 and IGF1R with clinicopathological indicators of cervical cancer.

IGF1R: insulin-like growth factor receptor 1; FIGO: International Federation of Gynecology and Obstetrics.
MiR-205 or IGF1R expression is an independent prognostic factor for CC patients
In this study, we indicated the average expression intensity of normal tissues to identify the low and high expression. We analyzed Kaplan–Meier curve for overall survival (OS) in 22 CC patients with low miR-205 expression and 8 CC patients with high miR-205 expression. Afterward, the log-rank test was applied to identify the between-group differences. Kaplan–Meier analysis showed that CC patients with low miR-205 expression had obviously lower OS (31.8%) than those with high miR-205 expression (50.0%; p = 0.038; Figure 3(c)). Conversely, high IGF1R expression was identified to be closely associated with poor 5-year OS (36.4% vs 62.5%; p = 0.005; Figure 3(d)). Furthermore, we explored the impact of miR-205 or IGF1R expression on OS of CC patients using multivariate Cox proportional hazard model. We found that miR-205 or IGF1R expression is an independent prognostic factor for CC patients (Table 2).
Multivariate analysis of the predictive value of overall survival of cervical cancer.

B: coefficient of regression; SE: standard error; Wald: Wald chi-square; df: degrees of freedom; Exp(B): B coefficient index; CI: confidence interval; OR: odds ratio; IGF1R: insulin-like growth factor receptor 1; FIGO: International Federation of Gynecology and Obstetrics.
p < 0.05.
MiR-205 mimics inhibit proliferation and invasion of CC cells
To explore the biological mechanisms of miR-205 in the development of CC, we first transfected miR-205 mimics into SiHa and HeLa cells and then examined the expression of miR-205 using qRT-PCR. qRT-PCR analysis revealed that miR-205 mimics effectively enhanced the expression of miR-205 in SiHa and HeLa cells (Figure 4(a)). Afterward, MTT assay showed that miR-205 mimics significantly inhibited SiHa and HeLa cell growth as compared with miR-NC (Figure 4(b)). Furthermore, we also observed that miR-205 mimics effectively inhibited cell invasion of SiHa and HeLa cells, which were indicated by decreased colony numbers and sizes (Figure 4(c)). These findings indicated that miR-205 mimics inhibit proliferation and invasion of CC cells.
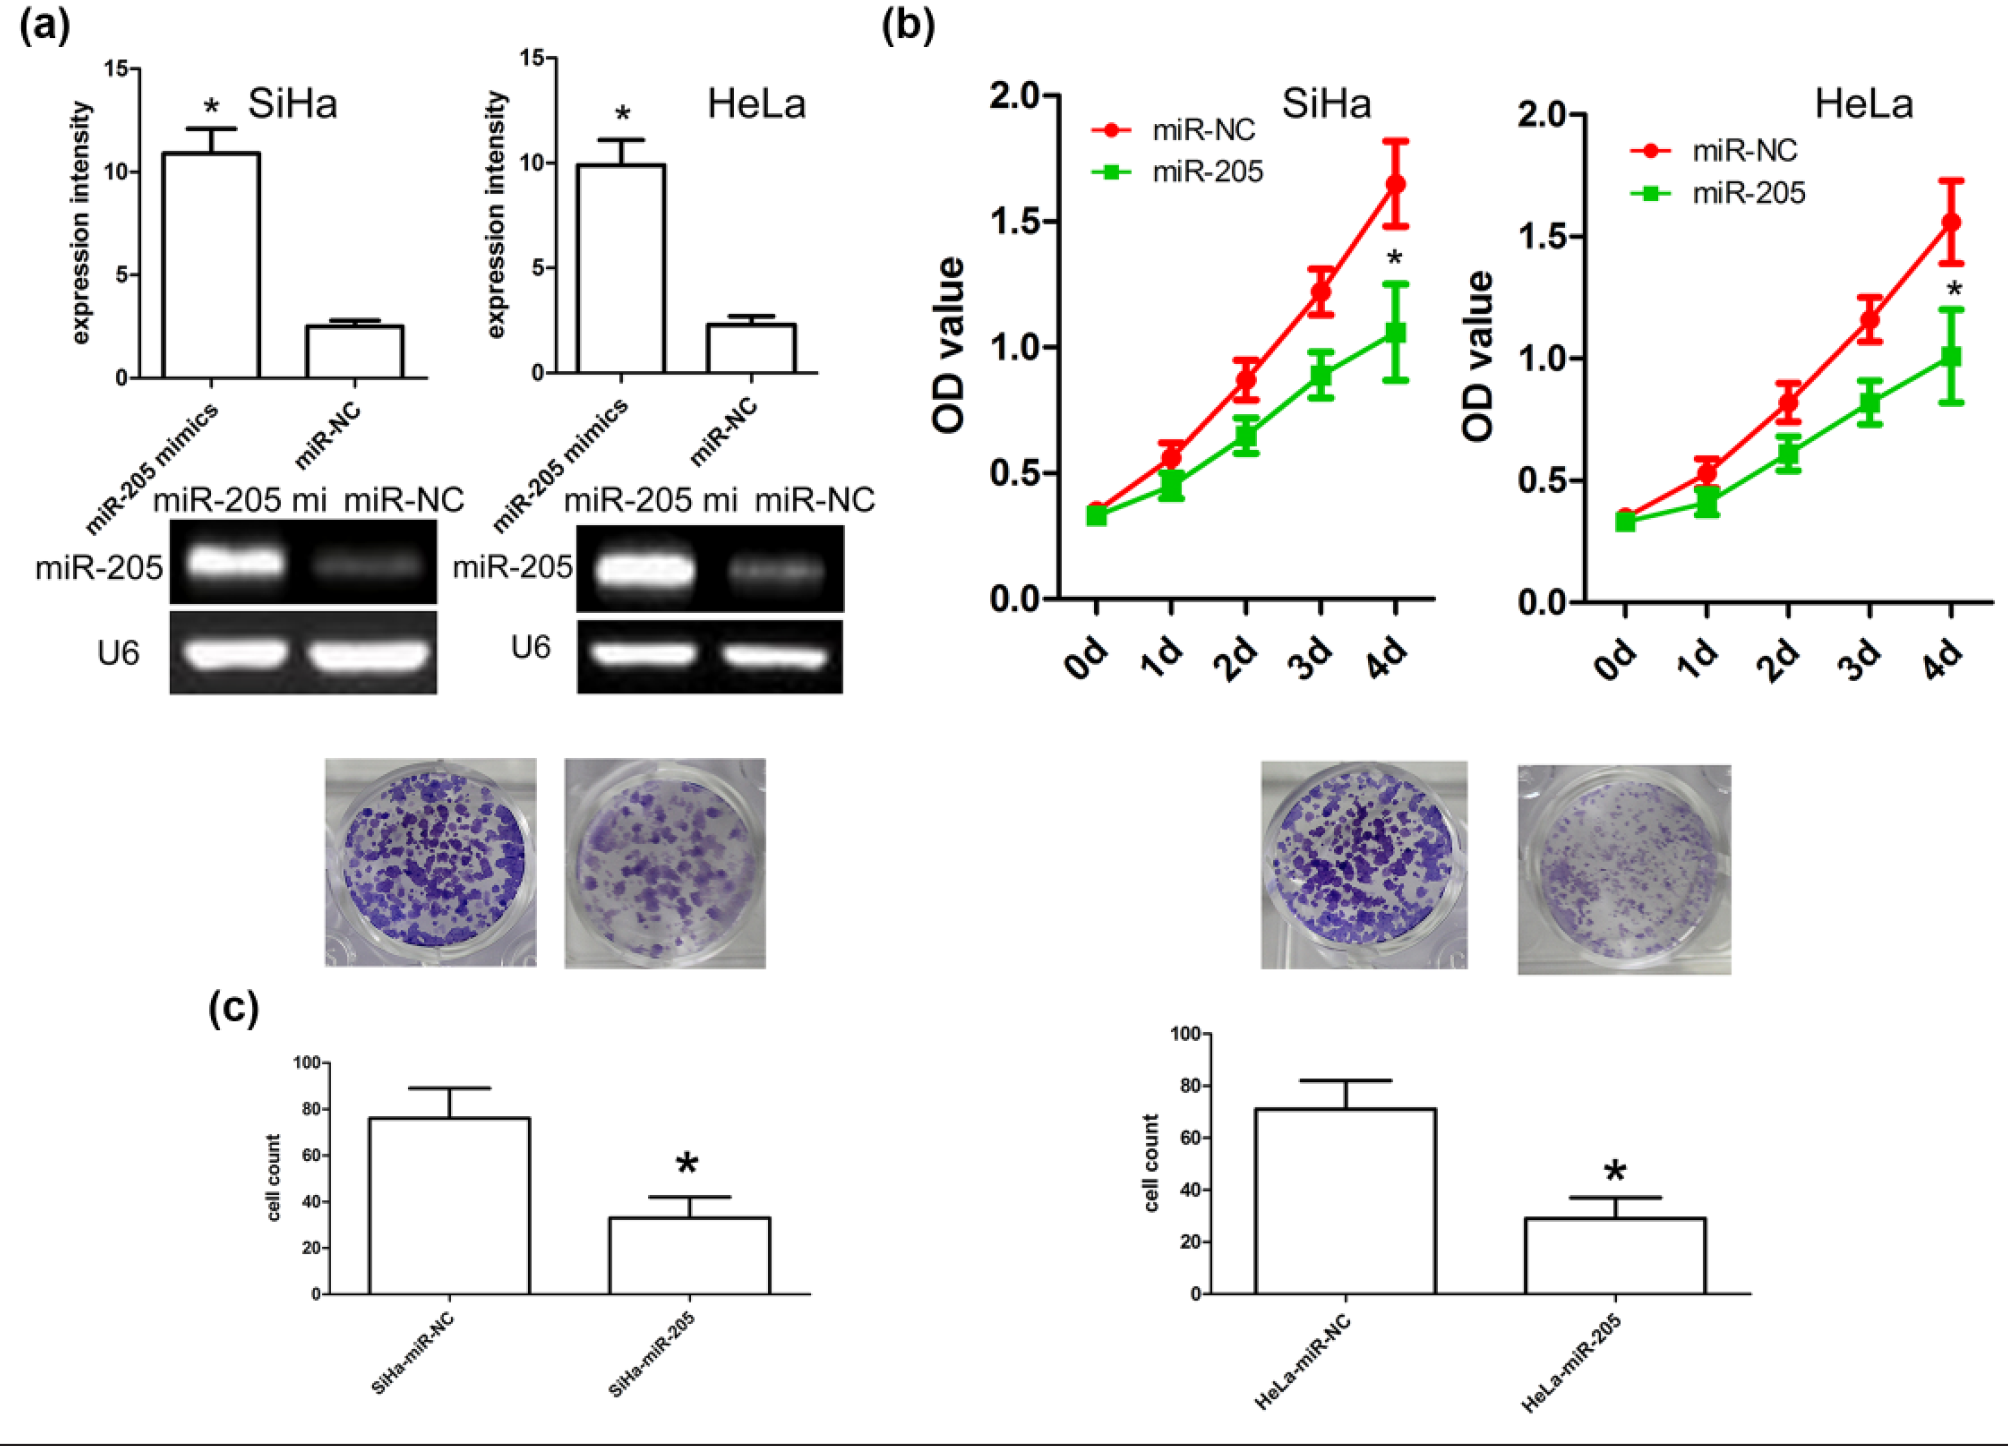
MiR-205 mimics inhibit cell proliferation and invasion. (a) Relative miR-205 expression in SiHa and HeLa cells was measured after the cells were transfected with miR-205 mimics or miR-NC using qRT-PCR and RT-PCR. (b) MTT assays revealed that miR-205 mimics reduced cell growth compared to miR-NC-transfected cells. Each bar represents the mean of three independent experiments (*p < 0.001, compared with control, one-way ANOVA). (c) MiR-205 mimics reduced cell invasion as indicated by invasion assay. Representative micrographs and quantification of colonies that were larger than 0.1 mm were scored. Each bar represents the mean of three independent experiments (*p < 0.001, compared with control, one-way ANOVA).
MiR-205 mimics cause G1 arrest in CC cells
To further identify the role of miR-205 in cell cycle and apoptosis, we carried out the flow cytometry analysis and observed that miR-205 mimics obviously reduced cell numbers of SiHa cells in the S phase; however, miR-205 mimics increased the percentage of SiHa cells in the G1/G0 phase (Figure 5(a)). Consistent with SiHa cells, results from HeLa cells also showed that miR-205 mimics obviously reduced cell numbers of HeLa cells in the S phase; however, miR-205 mimics increased the percentage of HeLa cells in the G1/G0 phase, which indicated that miR-205 mimics cause G1 arrest to inhibit cell growth. In addition, we determined the expression of Bcl-2, Bax, and cyclin D1, which are indicators for proliferation, and found that the expression of Bcl-2 and cyclin D1 was extremely reduced, while the expression of Bax was obviously increased in SiHa and HeLa cells transfected with miR-205 mimics as compared with miR-NC (Figure 5(b)).

MiR-205 mimics cause G1 arrest and enhance apoptosis in CC cells. (a) Flow cytometry analysis of indicated CC cells after transfection with miR-NC or miR-205 mimics. (b) Western blot analysis of expression of IGF1R, Bcl-2, Bax, and cyclin D1 in indicated cells. GAPDH serves as the loading control. (c) Assessment of apoptosis by Annexin V/propidium iodide in the SiHa and HeLa cells. The cell apoptosis was examined with flow cytometry after Annexin V/propidium iodide double staining. The necrotic cells lost cell membrane integrity that permits propidium iodide entry. Viable cells exhibit Annexin V−/propidium iodide−; early apoptotic cells exhibit Annexin+/propidium iodide−; late apoptotic cells or necrotic cells exhibit Annexin V+/propidium iodide+.
MiR-205 mimics enhance apoptosis of CC cells
The effect of miR-205 mimics on cell apoptosis was further investigated using an apoptosis detection kit. After treatment as mentioned above, the cells were harvested and the apoptosis was explored by flow cytometry. We found that miR-205 mimics in SiHa cells obviously increased early apoptotic cell (Annexin V+/PI−) percentage from (2.9% ± 0.5%) to (32.3% ± 0.6%) and late apoptotic cell percentage (Annexin V+/PI+) from (3.1% ± 0.2%) to (29.9% ± 0.3%) and increased by about 10-fold as compared with the miR-NC (p < 0.001; Figure 5(c)). Consistently, we also found that miR-205 mimics in HeLa cells significantly increased early apoptotic cell (Annexin V+/PI−) percentage from (2.1% ± 0.2%) to (30.6% ± 0.3%) and late apoptotic cell percentage (Annexin V+/PI+) from (1.1% ± 0.1%) to (49.9% ± 0.6%) and increased by more than 25-fold as compared with the miR-NC (p < 0.001; Figure 5(c)). These findings showed that miR-205 mimics had an obvious cell apoptotic effect on SiHa and HeLa cells.
3′UTR of IGF1R is a direct target of miR-205
To figure out the molecular mechanism underlying cell proliferation and invasion inhibited by miR-205, we predicted potential targets of miR-205 using bioinformatics resources including miRanda, PicTar, and TargetScan. Finally, IGF1R was chosen as a predicted target of miR-205 because IGF1R is suggested as an oncogene in diverse tumors (Figure 6(a)). To further confirm whether IGF1R binds to miR-205 by directly targeting its 3′UTR, we transfected IGF1R-3′UTR (wt/mut) and miR-205 mimics into SiHa and HeLa cells. First, we demonstrated that miR-205 mimics decreased the expression of IGF1R protein in SiHa and HeLa cells (Figure 6(b)), which suggested that miR-205 mimics inhibited cell proliferation most likely by targeting IGF1R expression. As shown in Figure 6, miR-205 mimics decreased the expression of IGF1R in SiHa and HeLa cells that contained the 3′UTR-wt of IGF1R, while miR-205 mimics did not alter the expression of IGF1R in SiHa and HeLa cells that contained the 3′UTR-mut of IGF1R, suggesting that 3′UTR of IGF1R is a direct target of miR-205 (Figure 6(c)). Most importantly, we observed that miR-205 mimics decreased the luciferase activity of cells with IGF1R-3′UTR-wt in a dose-dependent fashion (Figure 6(c)). However, miR-205 mimics did not reduce the luciferase activity of cells with IGF1R-3′UTR-mut, suggesting that IGF1R was a direct target of miR-205.

MiR-205 downregulates IGF1R by directly targeting 3′UTR. (a). The wt and mut type of 3′UTR of IGF1R mRNA contain the binding sequences of miR-205. (b and c) Western blot analysis of IGF1R expression was conducted in indicated cells transfected with the IGF1R-3′UTR-wt reporter or the IGF1R-3′UTR-mut reporter. (d and e). Luciferase assay was carried out in indicated cells transfected with the IGF1R-3′UTR-wt reporter or the IGF1R-3′UTR-mut reporter with increasing amounts (10, 20, and 40 nM) of miR-205 mimics or miR-NC. Each bar represents the mean ± SEM of three independent experiments (*p < 0.001, compared with control, one-way ANOVA).
Ectopic IGF1R expression abrogates miR-205-induced inhibitory effects
To further determine the effect of IGF1R on miR-205-mediated CC progression, we transfected pcDNA3.1(+)-IGF1R plasmids into SiHa and HeLa cells with miR-205 mimics to overexpress IGF1R protein. The MTT proliferation assay showed that overexpression of IGF1R promoted the proliferation of SiHa and HeLa cells (Figure 7(a)). In addition, the transwell assay also exhibited that overexpression of IGF1R in SiHa and HeLa cells with miR-205 mimics enhanced the invasion of SiHa and HeLa cells compared with vector control (Figure 7(b)).

IGF1R affects the effect of miR-205 on CC cell proliferation and invasion. (a) The proliferation capacity of miR-205-overexpressing SiHa and HeLa cells was partially improved when cells were transfected with IGF1R plasmids in comparison with miR-NC. (b) The invasion capacity of miR-205-overexpressing SiHa and HeLa cells were effectively improved when cells were transfected with IGF1R plasmids (*p < 0.001 vs vector). (c) The proliferation capacity of miR-205-overexpressing SiHa and HeLa cells was partially inhibited when cells were transfected with si-IGF1R compared with si-control. (d) The invasion capacity of miR-205-overexpressing SiHa and HeLa cells was effectively improved when cells were transfected with si-IGF1R (*p < 0.001 vs si-control).
Inhibition of IGF1R expression promotes miR-205-induced inhibitory effects
To elucidate the associations between miR-205 and IGF1R, we carried out the gene silencing assay and transfected IGF1R siRNA and control siRNA into SiHa and HeLa cells with miR-205 mimics to interfere with the expression of IGF1R protein. The MTT proliferation assay revealed that the expression of IGF1R was inhibited and further inhibited the proliferation of SiHa and HeLa cells (Figure 7(c)). In addition, the transwell assay showed that inhibition of IGF1R expression in SiHa and HeLa cells with miR-205 mimics repressed the invasion of SiHa and HeLa cells compared with si-control (Figure 7(d)).
Discussion
MiRNAs are a kind of small and non-coding RNAs, which repress or enhance related gene expression by regulating their target mRNAs in a sequence-specific manner.7,8 To date, miRNAs have been demonstrated to be important regulators in various tumors. At the same time, miRNAs have been reported to be extensively deregulated in different tumor tissues. 11 In this study, we demonstrated that expression of miR-205 was decreased in human CC tissues and cell lines, while expression of miR-205 was not changed in non-tumor tissues and NEECs. In addition, miR-205 was inversely correlated with histological differentiation, metastasis, FIGO stage, and the expression of IGF1R mRNA and protein. Besides, miR-205 or IGF1R expression is an independent prognostic factor. It has been reported that miR-205 is implicated into the initiation and occurrence of human malignant tumors. Some reports have identified that miR-205 expression is decreased in some tumor tissues.15,16 Overall, downregulated miR-205 expression is widely reported in other tumors, including breast carcinoma, prostate cancer, esophageal carcinoma, and head and neck tumors.17,18 Therefore, we assumed that miR-205 exerts diverse effects on the progression of tumors, which relays on cell or tissue type. Consistent with our reports, Xu et al. 19 reported that the expression of miR-205 was decreased in gastric cancer and osteosarcoma; thus, miR-205 may be a marker in CC patients.
Recently, miRNAs have been identified to be key regulatory molecules involved into a wide variety of signaling pathways, involving cell proliferation, apoptosis, and invasion. MiRNAs can serve as either tumor suppressors or oncogenes. 13 Deregulated expression of miR-205 has been reported to be implicated into the management of cell proliferation, apoptosis, and invasion. In this work, ectopic expression of miR-205 inhibited CC cell proliferation and enhanced cell apoptosis. Furthermore, we found that miR-205 mimics caused G1 arrest and enhanced apoptosis of CC cells. These findings suggested that miR-205 may serve as a tumor suppressor miRNA. In contrast, Su et al. 20 suggested that miR-205 promotes tumor proliferation and invasion through targeting estrogen-related receptor gamma (ESRRG) in endometrial carcinoma. These results showed that miR-205 exerts different effects on pathological processes of tumors according to tissue types.
Mechanically, miRNAs regulate gene expression by binding to the 3′UTR of their target mRNAs, modulating mRNA stability and/or translation.11–14 The IGF1R is a transmembrane receptor tyrosine kinase, closely related to the InsR that forms homodimers or heterodimerizes with InsR to recognize its ligands, IGF1 and IGF2. 21 Upon ligand binding, IGF1R activates multiple downstream signaling cascades, the two most prominent being PI3K/AKT and RAS/RAF/MEK/ERK. 22 PI3K/AKT enhances cellular metabolism and protein synthesis via mTOR and enhances survival via BAD/Bcl-2, p53, NF-κB, and FOXO, whereas RAS/RAF/MEK/ERK activation generally results in increased cellular proliferation. 23 In this study, miR-205 mimics decreased the expression of IGF1R in SiHa and HeLa cells that contained the 3′UTR-wt of IGF1R, while miR-205 mimics did not alter the expression of IGF1R in SiHa and HeLa cells that contained the 3′UTR-mut of IGF1R, suggesting that 3′UTR of IGF1R is a direct target of miR-205.
In our study, IGF1R has been found to be highly expressed in CC cancer tissues, while its expression was very low in normal tissues, indicating IGF1R is implicated in the development of CC. IGF1R was also reported to be regulated on a translation level by miRNAs, such as miR-374a, miR-505, and miR-124.15,16 Notably, IGF1R overexpression attenuated the inhibitory effects of miR-205 on cell proliferation and invasion; however, inhibited IGF1R expression enhanced the inhibitory effects of miR-205. Together with these findings, we demonstrated that miR-205 suppressed expression of IGF1R by binding to 3′UTR of IGF1R mRNA.
In conclusion, we demonstrated a novel mechanism of miR-205 and IGF1R by which miR-205 regulates the development of CC in humans. The altered expression of miR-205 closely correlated with cell proliferation and invasion of CC. Besides, we further demonstrated that miR-205 binds to 3′UTR of IGF1R mRNA and reduces the expression of IGF1R protein. Our findings provide a new insight for treatment of CC patients.
Footnotes
Acknowledgements
The authors thank all the members from the laboratory who supported this work.
Declaration of conflicting interests
The author(s) declared no potential conflicts of interest with respect to the research, authorship, and/or publication of this article.
Funding
The author(s) received no financial support for the research, authorship, and/or publication of this article.