
Abstract
Adenosine triphosphate–binding cassette proteins constitute a large family of active transporters through extracellular and intracellular membranes. Increased drug efflux based on adenosine triphosphate–binding cassette protein activity is related to the development of cancer cell chemoresistance. Several articles have focused on adenosine triphosphate–binding cassette gene expression profiles (signatures), based on the expression of all 49 human adenosine triphosphate–binding cassette genes, in individual tumor types and reported connections to established clinicopathological features. The aim of this study was to test our theory about the existence of adenosine triphosphate–binding cassette gene expression profiles common to multiple types of tumors, which may modify tumor progression and provide clinically relevant information. Such general adenosine triphosphate–binding cassette profiles could constitute a new attribute of carcinogenesis. Our combined cohort consisted of tissues from 151 cancer patients—breast, colorectal, and pancreatic carcinomas. Standard protocols for RNA isolation and quantitative real-time polymerase chain reaction were followed. Gene expression data from individual tumor types as well as a merged tumor dataset were analyzed by bioinformatics tools. Several general adenosine triphosphate–binding cassette profiles, with differences in gene functions, were established and shown to have significant relations to clinicopathological features such as tumor size, histological grade, or clinical stage. Genes ABCC7, A3, A8, A12, and C8 prevailed among the most upregulated or downregulated ones. In conclusion, the results supported our theory about general adenosine triphosphate–binding cassette gene expression profiles and their importance for cancer on clinical as well as research levels. The presence of ABCC7 (official symbol CFTR) among the genes with key roles in the profiles supports the emerging evidence about its crucial role in various cancers.

Keywords
Introduction
Despite the wide range of modern options for treatment of specific cancer types, the main currently available therapies are generally based on surgery and the use of cytotoxic drugs and/or ionizing radiation, which have potent antitumor activity. Tumor chemoresistance, constitutional as well as acquired, limits the effect of administered chemotherapy or can even cause its failure. Resistance of cancer cells to several structurally and functionally distinct chemotherapeutics composes a phenomenon known as multidrug resistance (MDR), which is one of the main obstacles to tumor chemotherapy efficiency at present. This problem has first of all dramatic health impacts, but also high worldwide economic impacts.1–3
Changes to any of several physiological processes ongoing in cells can initiate the development of chemoresistance. Processes mostly involved include blocking of important pathways leading to apoptosis, increased drug efflux or decreased uptake, accelerated catabolism of drugs, formation of a protective barrier of the tumor microenvironment, cell phenotype change via epithelial–mesenchymal transition, strengthened or weakened cell adhesion to the extracellular matrix, cell cycle phase switching, epigenetic changes or accelerated DNA repair.4,5 However, these processes do not stand alone, and in case of chemoresistance development, imbalances between several inter-connected processes play a key role.1,5 Cancer stem cell (CSC) theory, which has been increasingly supported in recent years, can also provide an explanation for the origin of chemoresistance.3,6
Increased drug efflux based on high expression of adenosine triphosphate–binding cassette (ABC) transport proteins (ABC family) is believed to be one of the major factors determining development of chemoresistance.1,4,7,8 ABC proteins constitute a large family of mostly active transporters located in extracellular and intracellular membranes in eukaryotic as well as bacterial cells. All 49 recognized ABC genes in humans can be classified into seven subfamilies according to the similarities in structure and order of domains—ABCA (ABC1), ABCB (MDR/TAP), ABCC (CFTR/MRP), ABCD (ALD), ABCE (OABP), ABCF (GCN20), and ABCG (White).8–10
After ATP binding by nucleotide-binding domains, these pumps use chemical energy for specific transportation of a wide spectrum of substrates, which are bound by transmembrane-binding domains. From ions and amino acids, through cholesterol and its derivatives, glycolipids, phospholipids, sugars, and vitamins, to whole proteins, all these molecules are among their transported physiological substrates. ABC proteins naturally constitute integral parts of the processes mediated by these substrates, for example, membrane homeostasis, lipid trafficking, waste disposal and detoxification, or cell signaling.8,11,12 Toxic endogenous molecules and xenobiotics could also become substrates, as has been shown by many studies and which has raised considerable interest.8,13 Moreover, members of ABCE and ABCF subfamilies lack transmembrane-binding domains and are purported to play a role in protein translation.12,13 Importantly, Barbet et al. 12 also stressed the role of ABC transporters in maintenance of stem cells’ pluripotency. However, the overlapping nature of ABC substrates could be one of the main obstacles to research on ABC gene function and also to developing promising ABC inhibitors. 14
This article follows three recently published works, which originated from our laboratories and explored the connection between the expression levels of ABC genes and clinicopathological features in three types of cancer individually. Expression of all human ABC genes in breast carcinoma (BC) was analyzed by Hlaváč et al., 15 in colorectal carcinoma (CC) by Hlavata et al., 16 and in pancreatic carcinoma (PC) by Mohelnikova-Duchonova et al. 17 In comparison to the corresponding non-neoplastic control samples, many significantly downregulated or upregulated ABC transporters were revealed for each tumor type. Moreover, some relationships between dysregulation of individual ABC genes and prognostic or predictive markers were statistically significant. Based on our previous results and influenced by the concept of hallmarks of cancer, 18 we hypothesized the existence of ABC gene expression profiles (signatures), which are common among multiple types of tumors. These profiles could have common characteristics on the expression as well as functional levels and bring some general information related to tumor pathogenesis. In clinical practice, the development of new prognostic or predictive markers could be based on knowledge of these profiles. Moreover, general ABC expression profiles could constitute tumor attributes in a more general manner, which is getting closer to the concept of hallmarks of cancer in the context established in the work of Hanahan and Weinberg. 18 Bioinformatic analyses in this article are presented in support of this hypothesis.
Materials and methods
Dataset characteristics
Our bioinformatic analyses were performed on a merged dataset of 151 Czech cancer patients diagnosed in four Czech hospitals (Medicon, Prague; University Hospital Pilsen, Pilsen; Institute of Clinical and Experimental Medicine, Prague; and University Hospital Brno, Brno). ABC transporter expression data from 68 BC patients, published separately in Hlaváč et al., 15 were included as the first subset of our primary data. Data from both types of tissues—tumor as well as non-neoplastic control tissues—were available for 43 patients, and for 25 patients, only tumor samples were available. Gene expression of 49 human ABC genes (including the ABCC13 pseudogene) was measured; all genes could be interpreted and entered for further analyses.
The second subset of primary data was composed of 51 CC samples; details of this subcohort were separately discussed in Hlavata et al. 16 Data from 50 tumor and paired non-neoplastic tissue samples were available, and only one patient was missing a control tissue sample. The expression of 49 ABC genes was measured for the CC samples. The data of all genes except ABCC12, which was below the limit of method detection in all samples, were included in the following analyses.
The third subset of primary data was based on the cohort incorporated in the study conducted by Mohelnikova-Duchonova et al. 17 and contained 32 pancreatic adenocarcinoma (PC) tumor samples and 27 paired control non-neoplastic tissue samples. The expression data of 49 ABC genes with the exception of the ABCG4 and ABCG5 genes, which were also below the limit of method detection, were included in our present analyses.
The three above-mentioned studies were our previous works performed in our laboratories. All clinical data available for our analyses have been continuously updated with the last update in April 2016. This study was conducted in accordance with the Declaration of Helsinki and Uniform Requirements for Manuscripts Submitted to Biomedical Journals.
Gene expression profiling
Isolation of total RNA, complementary DNA (cDNA) preparation, and quantitative real-time polymerase chain reactions (qRT-PCR) adhered to the Minimum Information for Publication of Quantitative Real-Time PCR Experiments Guidelines 19 and were precisely described in our previous articles.15–17 The same amount and quality of input RNA were applied for each sample within the studied tumor cohorts.
Statistics and bioinformatics
Preprocessing of our gene expression data was performed in Microsoft Excel 2013 and NetWalker software. 20 Raw gene expression data (Ct values) from individual tumor types were normalized by the average Ct value of each gene of interest (individual ABC genes) and then log2-transformed (following the guidelines for data import and processing to the NetWalker software). Log2-transformed row-normalized gene expression data from BC, CC, and PC datasets were collected into one MS Excel spreadsheet and transposed to a format with cases in rows and ABC genes in columns, with the aim of creating a merged tumor dataset. Because of the missing data about the expression of ABCC12 in the CC dataset and ABCG4 and ABCG5 in the PC dataset, all the data about the expression of these three genes were excluded from the merged dataset table. Afterwards, tree clustering was performed with the merged dataset with the same methodology as with the individual tumor datasets.
Statistical analyses (including survival analyses) were conducted with the help of Statistica (Statsoft, Czech Republic) and the freely available PAST statistical software package. 21 Two types of tree clustering—an unweighted pair-group method using arithmetic averages (UPGMA) and Ward’s method—were performed. Determined clusters were visualized in a heat map manner. Heat maps with mean values for each cluster and each gene were calculated with the aim of showing comparable characteristics. Clinical data were sorted according to the relevant clusters, visualized in heat maps for an overall review and statistically tested using predominantly non-parametric statistics (the Mann–Whitney U and Kruskal–Wallis tests). Results with a two-sided p value less than 0.05 were considered to be statistically significant. Disease-free survival (DFS) was defined as the time elapsed between surgery and disease recurrence or death. Overall survival (OS) was defined as the time elapsed between surgery and patient’s death from any cause. Median survival was estimated using the Kaplan–Meier method, and the difference was tested using the log-rank test. The characteristics based on the maximum of five most downregulated and five most upregulated ABC genes were proposed for each of the determined profiles. The comprehensive analysis of ABC gene functions was based on multiple searches in several publicly available databases—mainly NCBI Gene, The Weizmann Institute of Science GeneCards, UniProtKB/Swiss-Prot, UCSC Genome Browser, Kyoto Encyclopedia of Genes and Genomes, and Reactome.
Results
Breast cancer
Tree clustering with Ward’s method divided the set of 68 BC samples into five main clusters (BC1–BC5), which consisted of 3, 19, 16, 13, and 17 cases. Heat map visualization of the clustering analysis is shown in Figure 1 (the clustering dendrogram is available in Figure S1 in the Supplementary Materials). Possible significant relationships between these established BC clusters and relevant clinical data (age; menopausal status; tumor size (pT); regional lymph node metastasis (pN); distant metastases (cM); clinical stage; histological type and grade; expression of estrogen receptor (ER), progesterone receptor (PR), and human epidermal growth factor receptor 2 (HER2); expression of the Ki-67 protein; triple-negative breast cancer (TNBC) status; neoadjuvant chemotherapy (NACT) regimen; outcome; and survival) were further tested by statistical analyses.

Heat map visualization of the tree clustering (Ward’s method and Euclidean distances) of the expression levels of 49 human ABC genes in breast carcinoma samples.
The cluster BC3 (with 31 ABC genes upregulated and 15 downregulated) significantly prevailed in ER-negative (p = 0.012), PR-negative (p = 0.009), and TNBC (p = 0.022) cases, that is, in patients with a generally worse prognosis. Within the cluster BC3, ABCA13, B2, B3, D1, and F2 showed the highest level of upregulation and ABCC11, C12, C13, C8, and A10 showed the highest level of downregulation. These deregulations also constitute the characteristic features of this cluster, defining it against the other clusters. Median values for each gene within the established clusters were calculated with the aim to show comparable characteristics between the clusters. In a similar heat map manner, these median values are presented in Figure 2. Significant and clinically important findings together with the characteristics of all BC clusters are summarized in Figure 3. The cluster BC4 was revealed to be connected with older patients; no patient younger than 40 years old (there were 15 patients younger than 40 years in the BC cohort) was present in this cluster (p = 0.031). A trend for a higher number of pN0 patients was seen in the cluster BC5 (p = 0.064). Comparison of clusters with the vast majority of downregulated ABC genes (clusters BC1 and BC5) against clusters with mostly upregulated genes (clusters BC2, BC3, and BC4) resulted in the significant finding that cases with pN0 status were prevalent in the clusters BC1 and BC5 combined, compared with the rest of the clusters (p = 0.019). Similarly, a trend for longer DFS for the cluster BC5 patients was recognized (Log rank test chi2, p = 0.06). Moreover, after combining the cluster BC1 and BC5 patients, the result—better DFS for patients in this combined cluster—fulfilled the criteria for statistical significance (Log rank test chi2, p = 0.034).
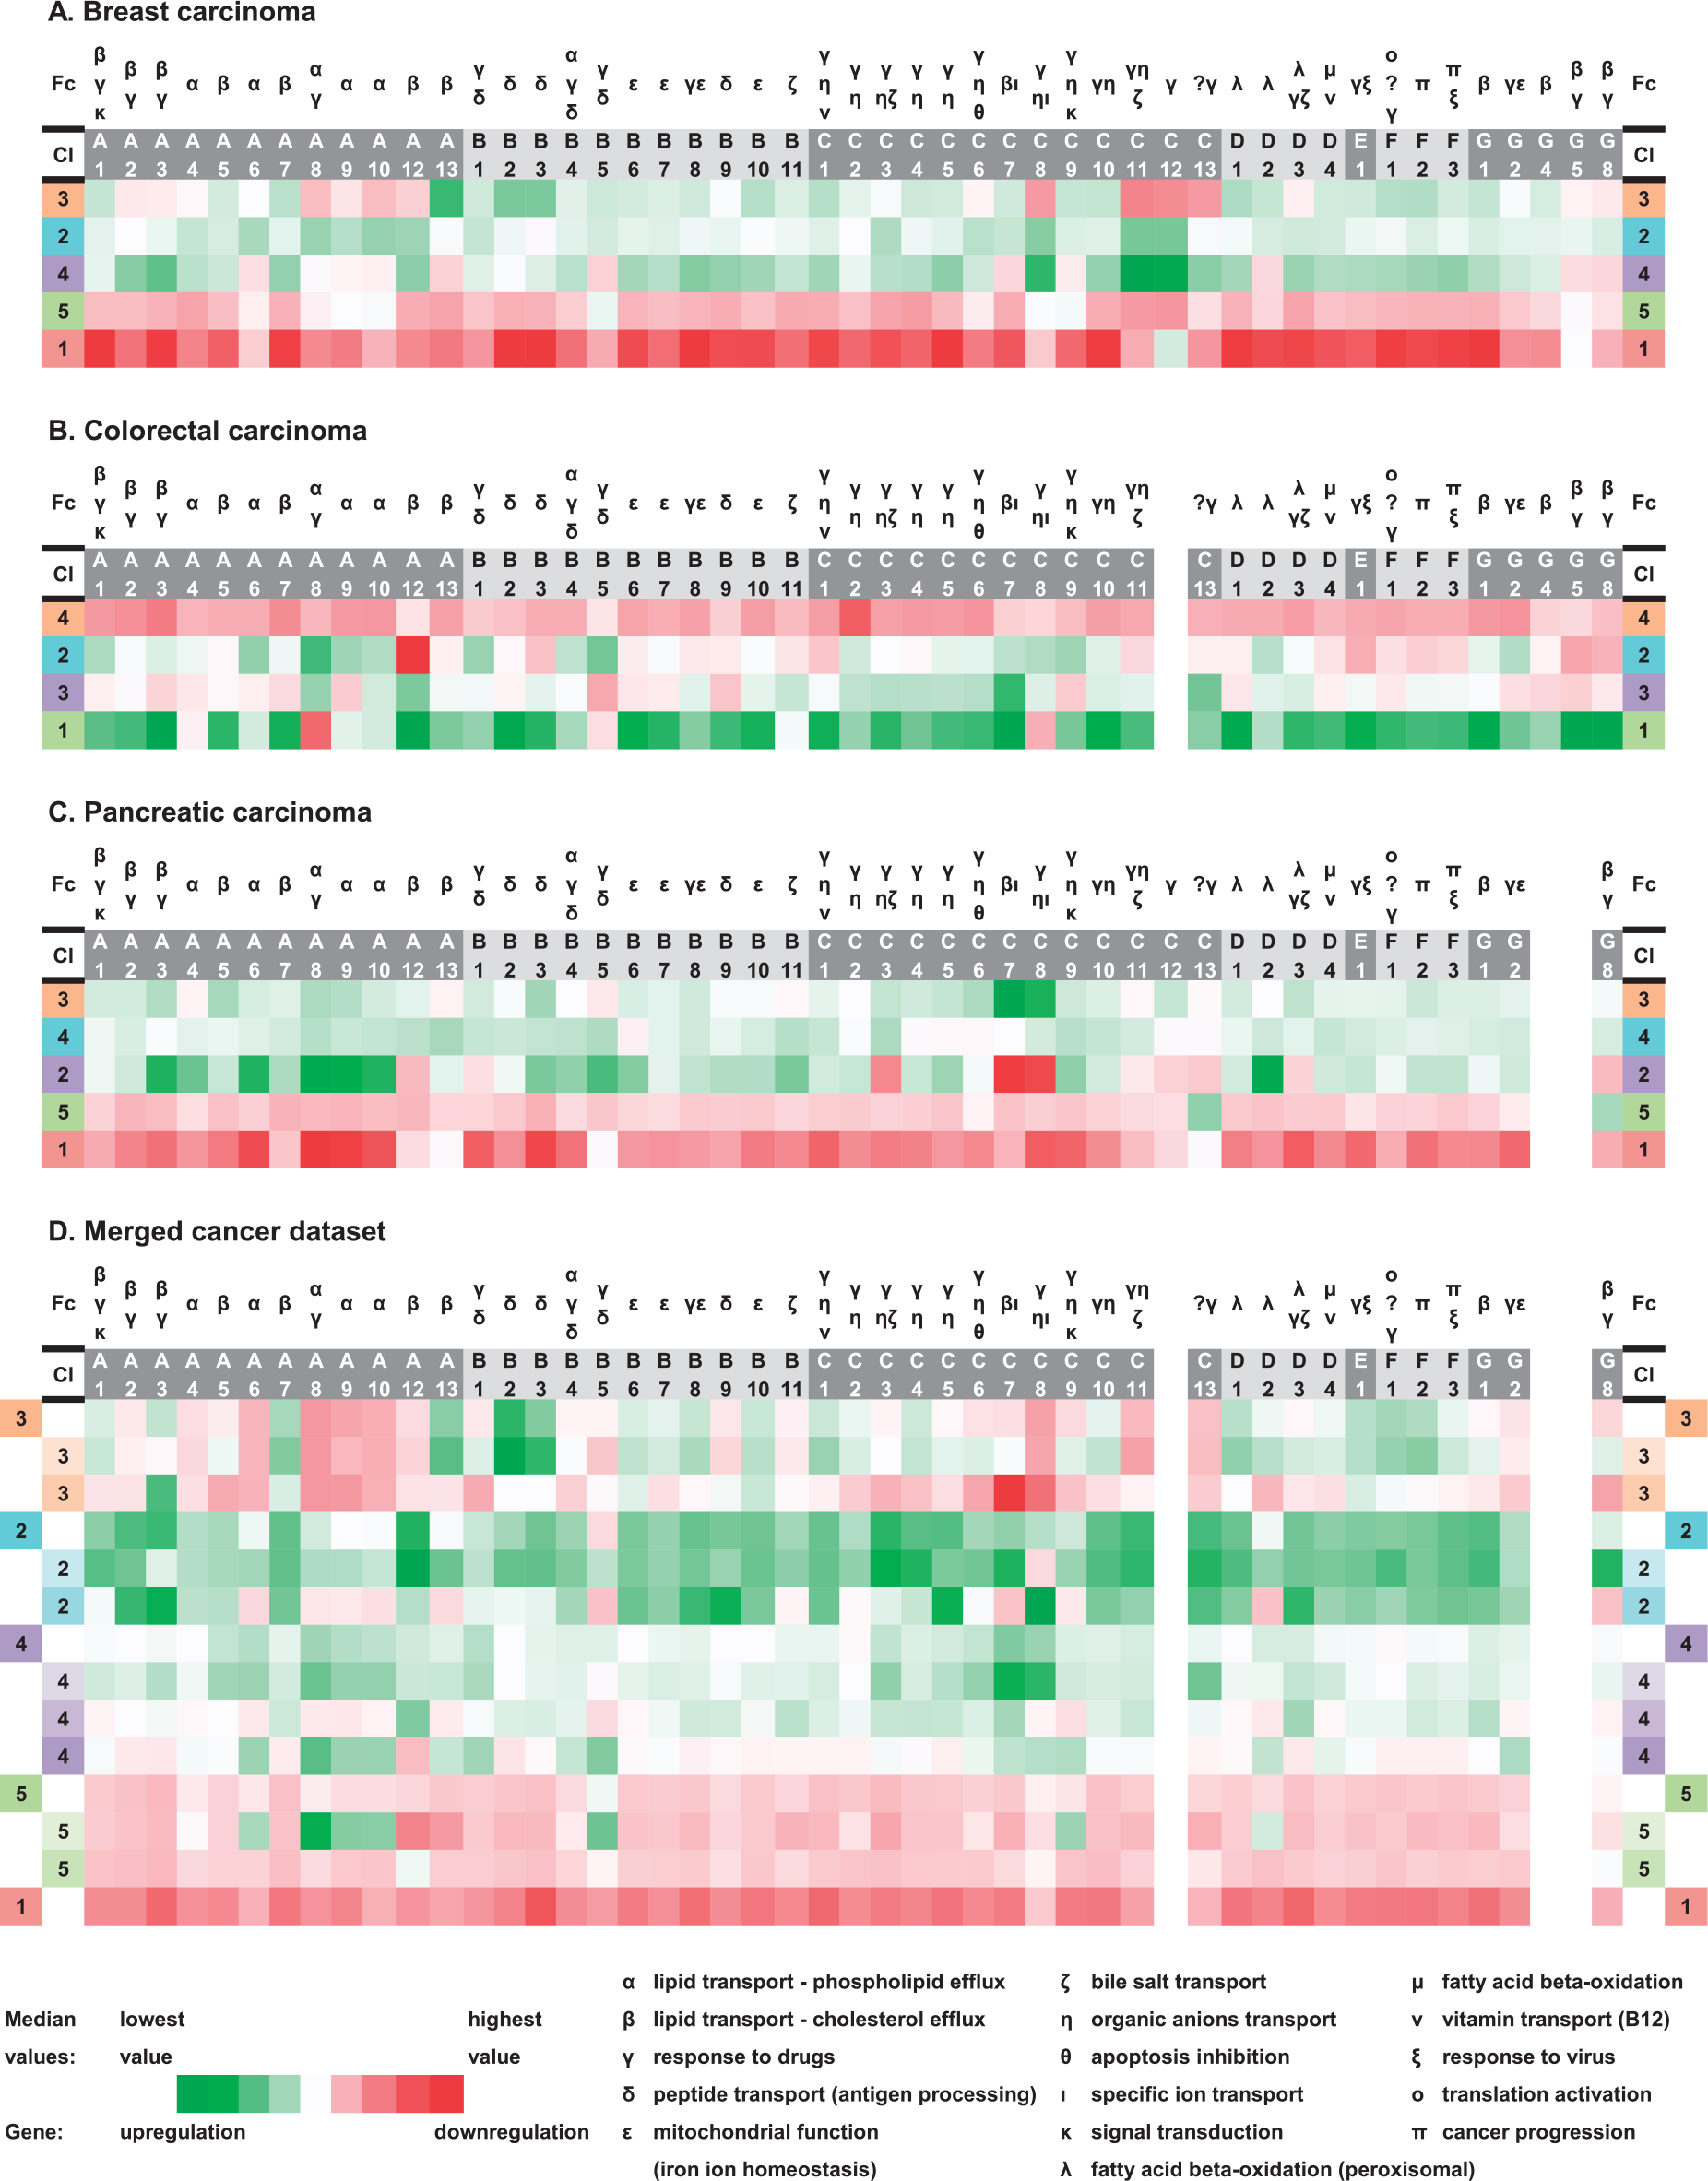
Heat map summary highlighting ABC gene profiles in individual tumors as well as the merged tumor dataset (based on gene expression median values for each ABC gene): (a) breast carcinoma, (b) colorectal carcinoma, (c) pancreatic carcinoma, and (d) merged cancer dataset.

Summary of the most deregulated ABC genes, gene functions, and significant clinically important findings in relation to the established ABC gene expression profiles in the individual tumors as well as merged tumor dataset (repeated functions were highlighted): (a) breast carcinoma, (b) colorectal carcinoma, (c) pancreatic carcinoma, and (d) merged cancer dataset.
Colorectal cancer
Tree clustering with Ward’s method divided the set of 51 CC samples into four main clusters (CC1–CC4) composed of 6, 13, 13, and 19 members. A heat map presenting the results of the CC sample clustering is shown in Figure 4 (for details, see Figure S2 in the Supplementary Materials). Gene median values for each CC cluster can be compared in Figure 2. For statistical testing of CC samples, we considered the following clinical data: gender, age, tumor size (pT), lymph node involvement (pN), distant metastases (cM), clinical stage, histological grade, primary tumor localization (colon C18, rectosigmoideum C19, and rectum C20), chemotherapy, Grade 3 or 4 toxicity, post-operative radiotherapy, outcome, and survival. Surprisingly, the cluster CC4 (representing cases with the vast majority of ABC genes downregulated) showed a significantly higher incidence of cases with pN1 or higher (p = 0.035). Primary tumor localization in rectum compared with colon prevailed significantly among CC3 patients (p = 0.006). Within the cluster CC3, ABCC7, C13, A12, A8, and C3 were the most upregulated genes, and ABCB5, B9, C9, A9, and G5 were the most downregulated—constituting the cluster characteristics. There was no case with pN2 status in the cluster CC2 (p = 0.036). Similar to the BC set, in patients treated by adjuvant therapy after radical surgical resection R0, DFS was evaluated as a measure of short-term survival. Comparison of DFS and OS between samples with mostly downregulated ABC genes (cluster CC4) versus samples with most of the genes upregulated (clusters CC1, CC2, and CC3) was performed; however, no statistically significant association was observed. The other survival analyses of the individual clusters against the rest also did not show statistical significance. Figure 3 summarizes the significant results and cluster characteristics for the CC set.
Heat map visualization of the tree clustering (Ward’s method and Euclidean distances) of the expression levels of 48 human ABC genes in colorectal carcinoma samples.
Pancreatic cancer
Five main clusters (PC1–PC5) were created in the set of 32 PC samples after the clustering analysis, which was performed in a similar way as in the previous two tumor sets. These clusters contained 1, 2, 10, 13, and 6 cases and can be examined in Figure 5 (Figure S3 in the Supplementary Materials provides the clustering dendrogram). In Figure 2, gene expression median values for each PC cluster can be studied and compared with the other tumor clusters. From available clinical information, we evaluated gender, age, histological grade, Pathological tumor–node–metastasis (pTNM) stage, angioinvasion (pA), perineural invasion (pP), margin status (R0 versus R1), KRAS mutations in codons 12 and 13 (wild type versus mutant), chemotherapy administration, and OS in the PC set. Similar types of statistical analyses, as for the BC and CC sets, were conducted; however, no statistically significant association of the ABC profiles with the clinicopathological features were found for our PC samples.

Heat map visualization of the tree clustering (Ward’s method and Euclidean distances) of the expression levels of 47 human ABC genes in pancreatic carcinoma samples.
Merged cancer dataset
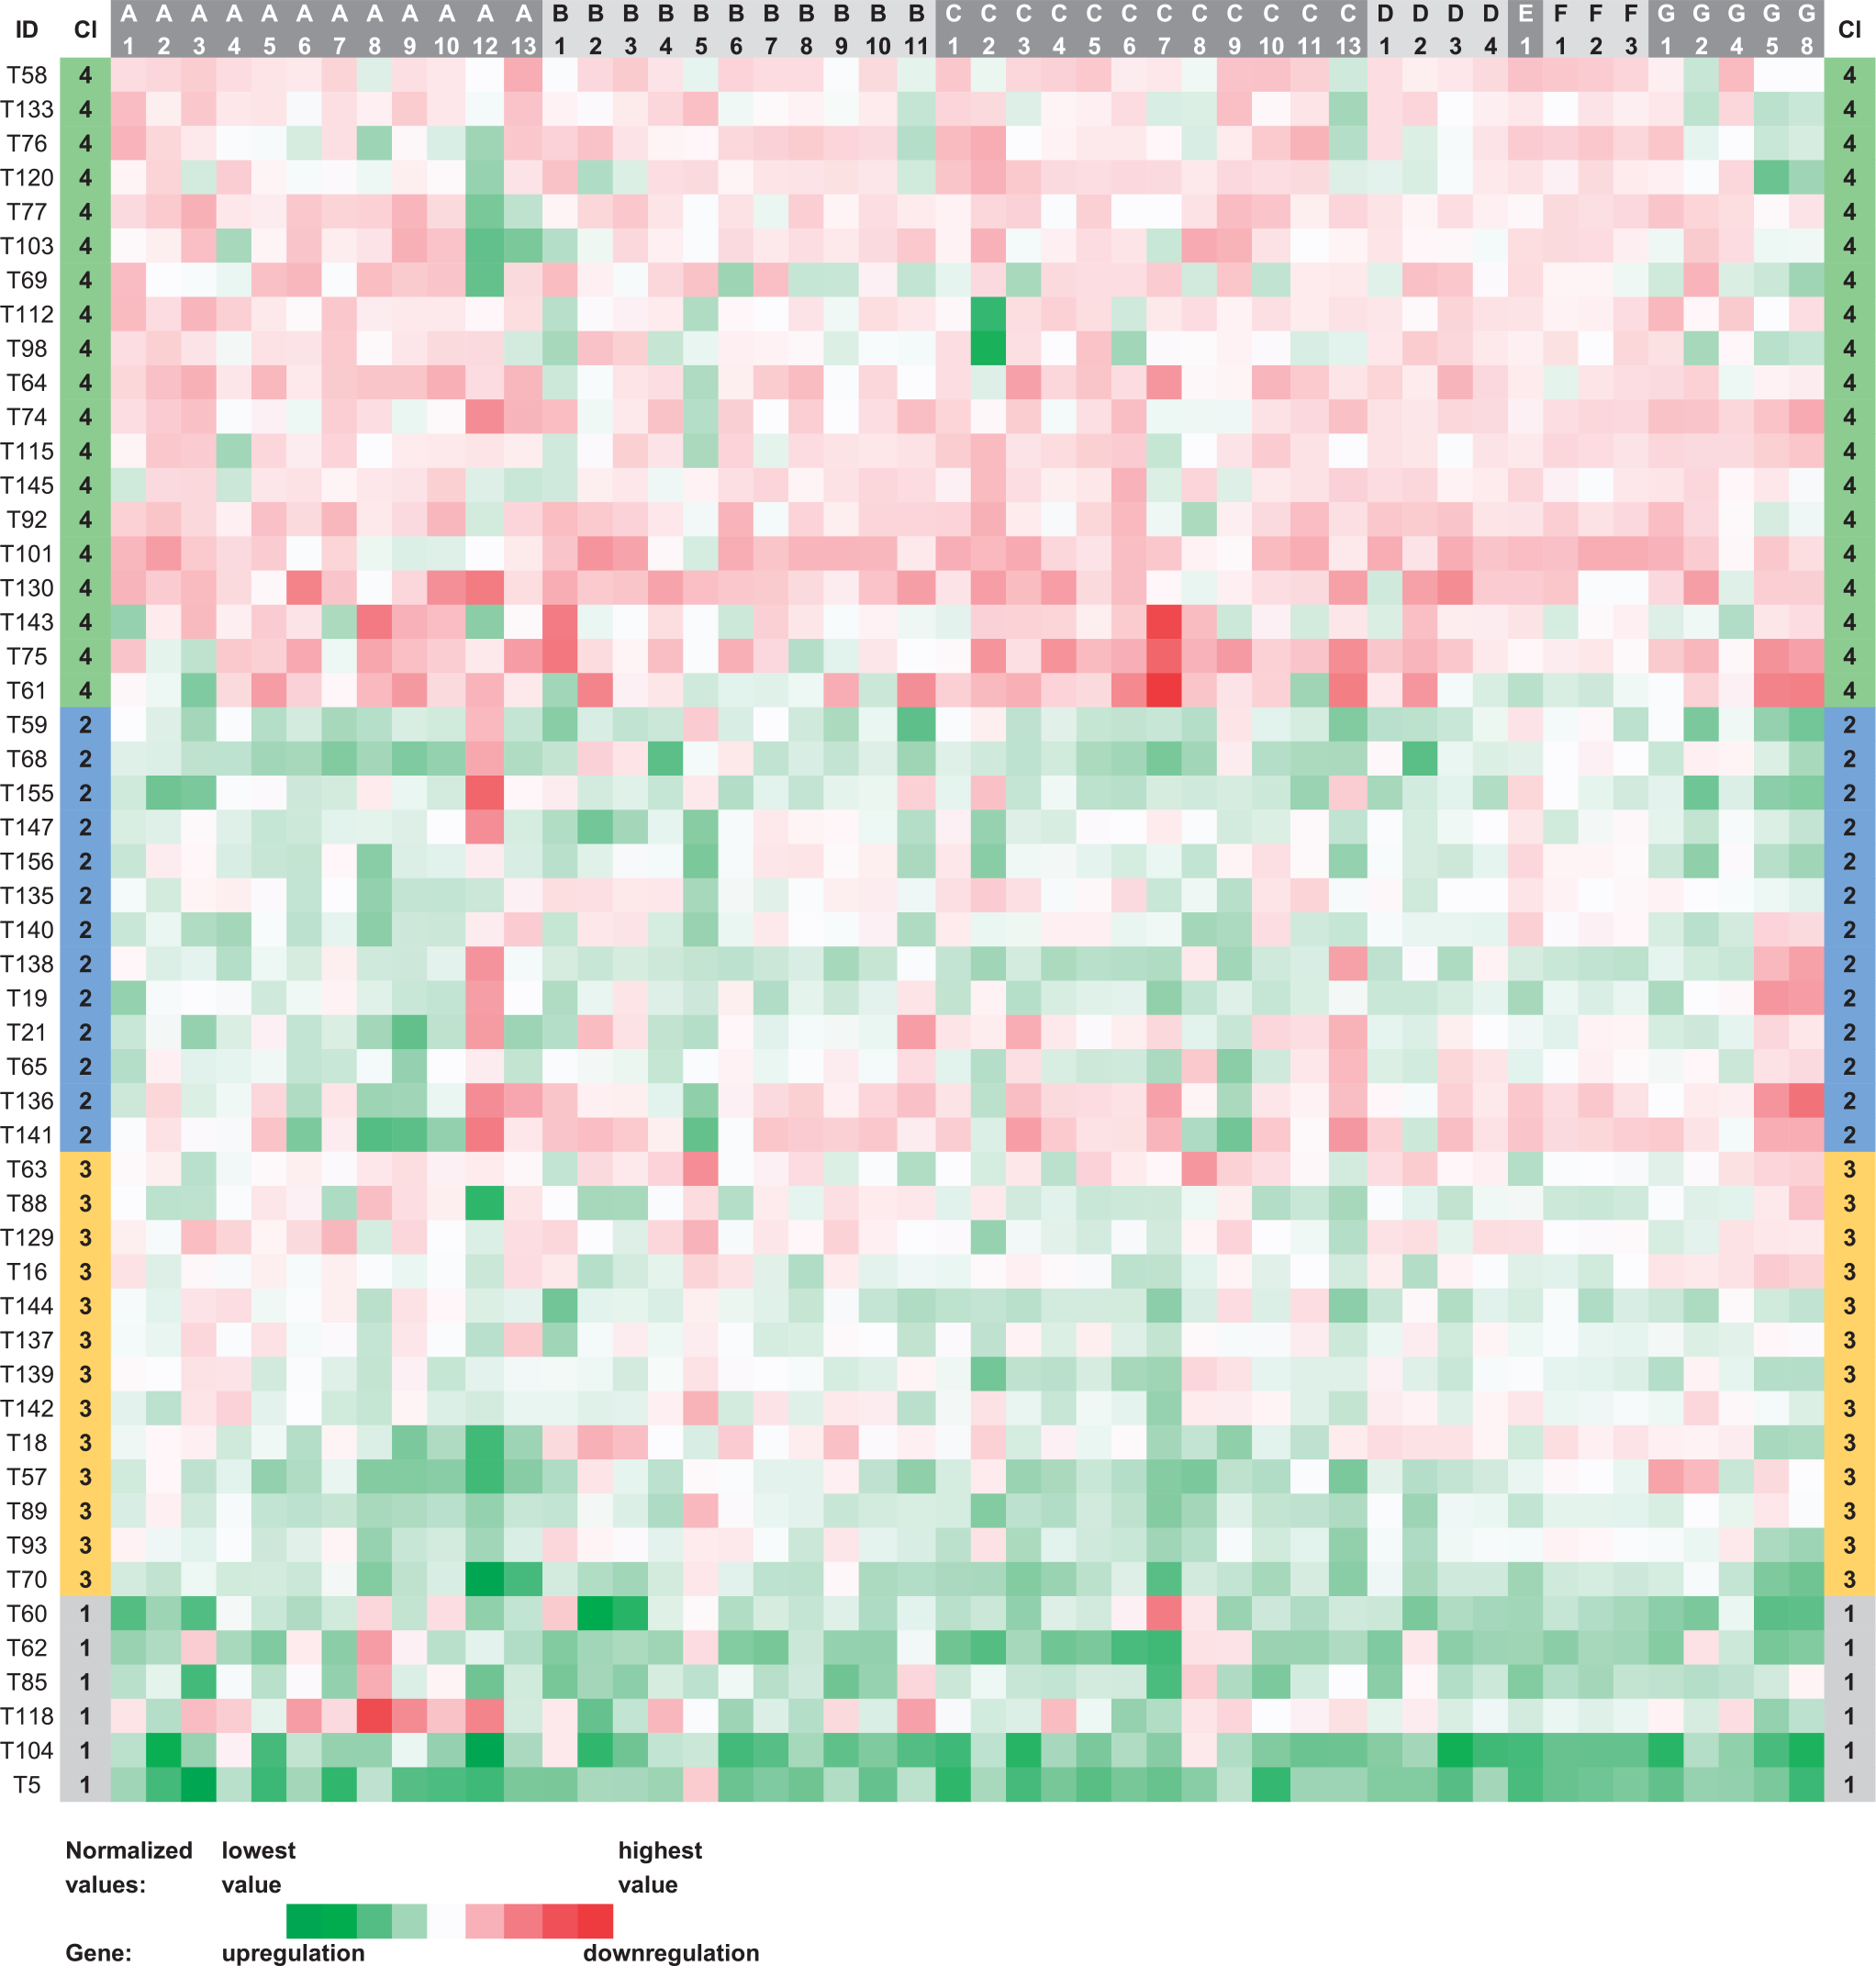
Which general ABC gene expression profiles can be distinguished across several different tumor types? To address this crucial question, we created a merged dataset composed of all available tumor samples (see section “Materials and methods”). Similar procedures as described above for the separate tumor cohorts were applied to the combined cohort afterwards. Tree clustering with Ward’s method created five main clusters (JC1–JC5) within 151 tumor samples of the merged dataset. Importantly, each main cluster contained some samples from each of the analyzed tumor types, with the exception of the cluster JC1, which contained only BC and PC samples. The summary of the number of patients from individual tumor types within the established ABC expression profiles of the merged tumor dataset is available in Table S1 in the Supplementary Materials. The overall number of the cases, which were assigned to the main clusters, was 6, 21, 18, 66, and 40 cases (from JC1 to JC5). After a comparative analysis of the characteristic expression profiles of these main clusters, further subdivision into nine subclusters was possible. The clustering results of the merged dataset can be observed in Figure 6 (Parts 1 and 2); the clustering dendrogram is provided in the Supplementary Materials as Figure S4. The characteristics of all the merged dataset clusters and subclusters in the form of expression median values of each ABC gene are shown in Figure 2. The cluster JC1 had no subcluster and was characterized by a strong downregulation of all the 46 ABC genes, which were tested across all our tumor samples. The cluster JC2 had two subclusters (JC2.1 and JC2.2), and contrary to the cluster JC1, showed upregulation of 45 out of 46 ABC genes. In the JC2, the five most upregulated genes were ABCA12, C3, A3, C11, and C13 (in descending order) and the only downregulated gene was B5. In all, 21 upregulated genes (ABCB2, B3, A13, F1, A7, etc.) and 18 downregulated genes (ABCA8, C8, A9, A10, A6, etc.) were observed within the cluster JC3, which could also be further divided into two subclusters (JC3.1 and JC3.2). Milder upregulation of all 46 genes, compared with the JC2, constituted the characteristic feature of the JC4 having three subclusters (JC4.1–4.3); genes ABCC7, C8, A8, A9, and A6 showed the highest level of upregulation. Importantly, upregulation of only one gene, ABCB5, and downregulation of 44 genes (ABCA3, C3, B3, C1, A7, etc.) were discovered as the typical pattern of the JC5, which was further divided into two subclusters (JC5.1 and 5.2) in the detailed division. Thus, JC1 and JC2 were the most distinctive ones and interesting for further comparisons (Figure 3).

Heat map visualization of the tree clustering (Ward’s method and Euclidean distances) of the expression levels of 46 human ABC genes in the merged tumor dataset (breast, colorectal, and pancreatic carcinoma samples , blue, green, and yellow colored IDs, respectively).
In the further statistical analyses, only those clinicopathological features which were available for all the samples in the merged dataset could be evaluated. These were gender, age, histological grade, clinical stage, pN and pT status, and newly calculated relative risk. Relative risk was defined as the value 1 or 0 (achieved versus not achieved), according to 1-year OS in PC patients, 3-year DFS in BC patients, and 3-year OS (all CC patients) or DFS (adjuvantly treated CC patients) in CC patients. The cluster JC3 contained significantly more Grade 3 or 4 patients (p = 0.010). A trend for higher incidence of smaller size tumors (pT1 or pT2) was seen for the subcluster JC3.1 (p = 0.056). Significantly higher incidence of such smaller size tumors was noted in the subcluster JC2.2 (p = 0.041). On the contrary, a higher incidence of larger size tumors (pT3 or pT4) was recognized for the whole cluster JC4 (p = 0.017). Moreover, this tendency was most prominent within the subcluster JC4.3, though not fulfilling the cut-off for statistical significance (p = 0.059). Within the cluster JC5, the subcluster JC5.1 had significantly higher incidence of pN0 patients (p = 0.048) together with higher incidence of smaller size tumors (p = 0.013). Surprisingly, the subcluster JC5.2 showed significantly higher incidence of patients with larger size tumors (p = 0.024) and two times more patients with pN1 or higher than pN0. Higher incidence of stage I or II patients (p = 0.025) and smaller size tumors (p = 0.038) was observed for the cluster JC1. All statistically significant findings for the merged tumor dataset are also summarized in Figure 3. No significant association between JCs and relative risk was revealed.
Discussion
The evidence in support of a new approach in the field of ABC gene expression profiles (signatures) is presented in the current article. We believe that ABC gene expression profiles in cancer can be recognized on a more general level than the level of individual tumor types. This theory originated from our previous results, which were obtained from the analyses of the expression levels of all recognized human ABC genes separately in three tumor types, and also the results of several published studies, which explored ABC profiles in different tissues.
Scientific articles reporting the relationships between ABC gene expression profiles, based on the analyses of all described ABC genes in humans, and important biological or clinical consequences have been published since 2006. Two main directions can be distinguished in this research field, one focusing on the characterization of different stem cells and the other one on different tumor types.
The ABC transporter expression signature of hematopoietic stem cells (HSCs) was first determined by de Grouw et al. 22 and further explored by Tang et al. 23 Unexpectedly, most transporters showed apparently higher expression in developed blood cell types (monocytes, granulocytes, CD71+ erythroid progenitors, T cells, and natural killer (NK) cells) compared to stem cells, challenging the concept that individual transporters may function in maintaining stem cell integrity by protecting them against xenobiotics.23,24 Instead, a distinct expression profile for ABC transporters might be essential for stem cell function rather than overexpression of individual transporters. It is also tempting to speculate that the ABC expression profile could represent (and serve as a diagnostic tool for) the differentiation status or even “stemness” of stem cells including those with carcinogenic potential.
In the field of stem cell characterization, a comparison of human ABC gene expression profiles between pluripotent human embryonic stem cells (hESCs) and early and late multipotent human mesenchymal stem cells (hMSCs) was presented by Barbet et al. 12 and extended by Erdei et al. 25 The most important differences were due to variations in ABC transporters with low but significant gene expression, suggesting their important roles in pluripotency. Similar to this study, several of these highlighted transporters shared similar substrates but differed regarding gene regulation. In line with the previous studies, most of the ABC transporters were expressed at significantly higher levels in the differentiated cell types than in the pluripotent hESCs. The only ABC transporter that showed a decreased expression level in all differentiated cell types was ABCG2.
Using oligonucleotide microarrays, Park et al. 26 analyzed the ABC transporter gene expression profiles in breast cancer patients who underwent NACT. The expression profile of ABC transporters in melanoma (47 ABC genes were tested) was generated in the study performed by Heimerl et al. 27 Marzac et al. 28 highlighted the putative role of less explored ABC transporters in primary chemoresistant acute myeloid leukemia, extending the research in the direction of tumor characterization. They all emphasized the diversity of ABC transporters that cooperate to promote chemoresistance rather than overexpression of single transporters and called for further research on ABC expression profiles in cancer. Recently published ABC gene expression profiles (based on the analysis of all human ABC genes) characteristic of specific tumors (in comparison with non-malignant control tissues) are summarized in Table 1, and profiles with clinical importance are stressed in Table 2.
Summary of recently published ABC gene expression profiles (based on the analysis of all human ABC genes) associated with characteristics of individual tumor types.

a. o.: alphabetical order.
Summary of recently published ABC gene expression profiles (based on the analysis of all human ABC genes) associated with clinical consequences in cancer.
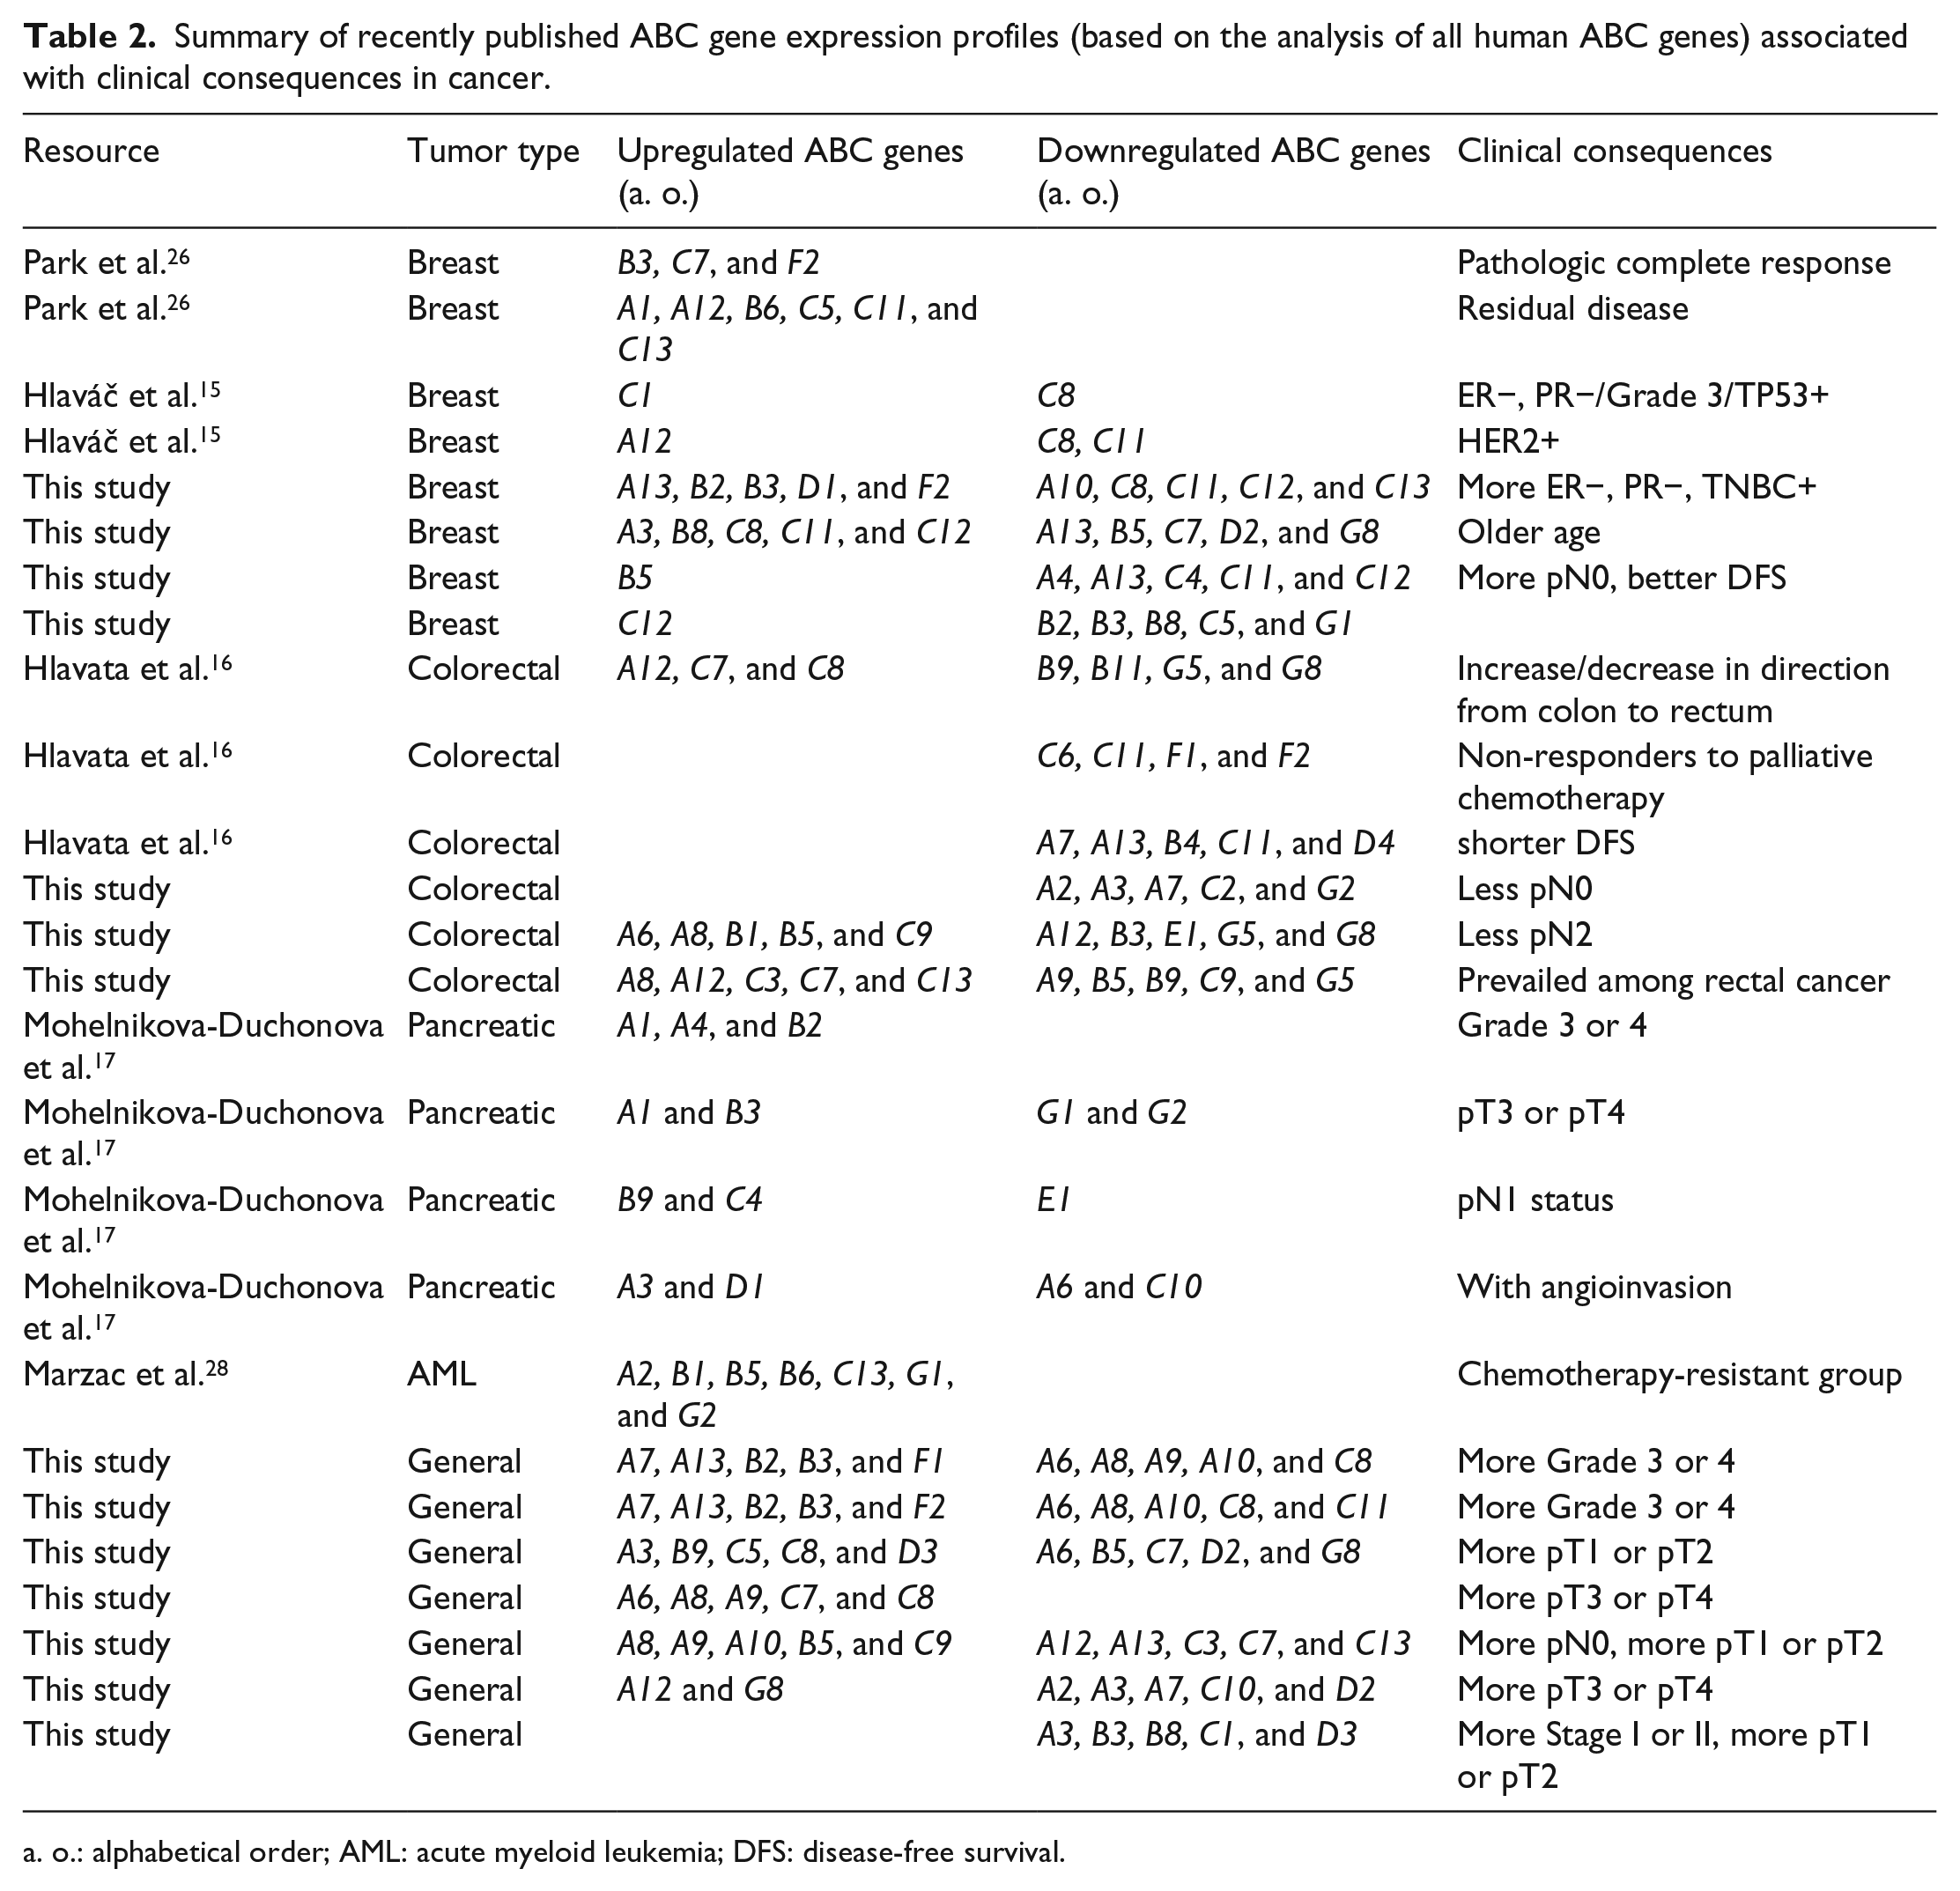
a. o.: alphabetical order; AML: acute myeloid leukemia; DFS: disease-free survival.
Among the work originating from our laboratories, transcript levels of all human ABCs were explored in tumors and non-neoplastic control tissues from CC patients collected before the first line of treatment by a 5-fluorouracil (5-FU)-containing regimen. 16 Several significant results with clinical consequences for CC patients were generated and ABCC11 was proposed as a promising candidate marker for a validation study on 5-FU therapy outcome (Table 2). A major goal of our second ABC study 15 was to investigate associations between the expression of ABC genes and outcome of BC patients. Transcript levels of all human ABC genes were determined in post-treatment tumor and non-neoplastic tissue samples from patients treated by NACT. Six ABC genes were then evaluated in an independent series of pretreatment patients. ABCA12, A13, C1, C8, and D2 were suggested as potential modifiers of progression and response to the chemotherapy of BC. Evaluation of human ABC gene transcript levels in one of the most drug-resistant cancers, the PC, was the aim of our third ABC study, conducted by Mohelnikova-Duchonova et al. 17 The observed upregulation of ABCB4, B11, C1, C3, C5, C10, and G2 in tumors may contribute to the generally poor treatment response of the disease. Furthermore, the upregulation of ABCA1, A7, and G1 implicated a serious impairment of cellular cholesterol homeostasis. However, the observed downregulation of ABCA3, C6, C7, and C8 suggested a possible role of stem cells in the development and progression of PC.
Dysregulation of cholesterol homeostasis and tumor progression in human prostate cancer through cancer-specific ABCA1 hypermethylation and loss of protein expression was proposed by Lee et al. 30 Their results were recently confirmed by Demidenko et al., 29 who reported that the ABC gene expression profile characterized by the downregulation of several genes was particularly prevalent in the TMPRSS2-ERG-negative prostate tumors. However, although the TMPRSS2-ERG gene fusion is the most prevalent genetic rearrangement, found in approximately 50% of prostate cancers, studies examining its clinical implications have reported ambiguous results.31,32
Based on all the above-described research findings, our team raised the question about the existence of general ABC gene expression profiles, which could be common to different tumor types, and their possible clinical implications. This question was addressed for the first time in the current work. The clustering methodology, used in this article, was first applied to the expression data from individual tumor types—BC, CC, and PC. The variability in expression of ABC genes within each tumor type was shown and ABC gene profiles specific to individual tumor types were established. Similar clustering was then performed on a merged dataset, which was composed of all expression data from the three tumor types together. Altogether, data from 151 oncology patients were incorporated in the merged dataset. The ABC expression profiles common to these three types of tumors were revealed, and it can be concluded that the existence of general ABC expression profiles was supported. It was shown that the spectrum of general ABC gene profiles, established by the clustering methodology, was similar to the spectrum of profiles seen in individual tumors. Characteristics of all the discovered profiles, from genetic as well as functional points of view, were established in the presented bioinformatic analyses and summarized in Figure 3. The characteristics based on the maximum of five most downregulated and five most upregulated ABC genes were proposed for each of the determined profiles. In the following statistical analyses, important connections to relevant clinical markers were revealed.
In the study, the BC cluster characterized by upregulation of ABCA13, B2, B3, D1, and F2 and downregulation of ABCC11, C12, C13, C8, and A10 was revealed to predominate in TNBC-positive patients. Among dysregulated functions, peptide transport (antigen processing) was strongly upregulated and responsiveness to drugs and organic anion transport were downregulated in this cluster. ABCB3 and ABCF2 were previously described as upregulated in the BC group with pathologic complete response by Park et al. 26 Downregulation of ABCC8 was found in relation to expression of hormone receptors, grade or TP53 protein level in BC patients by Hlaváč et al. 15 The same work connected downregulation of ABCC8 and ABCC11 with HER2 positivity. Older patients were found to have higher incidence in the BC cluster with mostly upregulated genes ABCC11, C12, C8, A3, and B8 and downregulated genes ABCB5, A13, G8, C7, and D2 resulting in strong dysregulation of response to drugs, upregulation of organic anion transport, and downregulation of lipid transport including cholesterol efflux. However, a possible more general link between ABC expression profiles and aging was not confirmed by the analysis of the merged tumor dataset. In Park et al., 26 upregulation of ABCC11 was described in the BC group with residual disease. Importantly, better DFS and higher incidence of pN0 status were shown for BC patients belonging to two clusters with the vast majority of ABC genes downregulated in this study. Surprisingly, the CC cluster with the vast majority of ABC genes downregulated showed lower incidence of patients with pN0 status, suggesting a greater importance of specific ABC genes than whole ABC gene profiles in this matter. The CC cluster having ABCC7, C13, A12, A8, and C3 genes mostly upregulated and ABCB5, B9, C9, A9, and G5 genes mostly downregulated prevailed among our rectal cancer patients. Lipid transport including cholesterol efflux was strongly upregulated and peptide transport (antigen processing) downregulated in this CC cluster along with a strong dysregulation of response to drugs in both directions. Expression of ABCA12 and ABCC7 was shown to increase in direction from colon to rectum in our previous work on the CC topic, 16 where expression of ABCB9 and ABCG5 also decreased in the same direction.
Within the general ABC gene profiles established in this study, several of them were significantly connected with clinical markers. Prevalence of Grade 3 or 4 tumors was revealed between samples attributed to the cluster characterized by high upregulation of ABCB2, B3, A13, F1, and A7 and downregulation of ABCA8, C8, A9, A10, and A6. Strong upregulation of peptide transport (antigen processing) together with lipid transport including cholesterol efflux, and in contrast, downregulation of lipid transport without cholesterol efflux together with responsiveness to drugs characterize the general cluster from functional point of view. Mohelnikova-Duchonova et al. 17 showed a connection between upregulation of ABCB2 and B3 and Grade 3 or 4 and pT3 or pT4, respectively, in PC patients. Downregulation of ABCA6 was shown to be related to the presence of angioinvasion in the same work, as well as the downregulation of ABCC8 in BC Grade 3 patients described above. A higher incidence of small-sized tumors (pT1 or pT2) was found to be joined together with three separate clusters, again pointing to the similar importance of different ABC gene combinations. In contrast, two different clusters were shown to have a higher incidence of large-sized tumors (pT3 or pT4). A higher number of pN0 patients (together with higher number of small-sized tumors) were shown to have the cluster with ABCA8, B5, A9, A10, and C9 mostly upregulated and ABCA12, A13, C3, C7, and C13 downregulated. These alterations are in line with a strong response to drug deregulation together with lipid transport without cholesterol efflux upregulation, but lipid transport including cholesterol efflux downregulation. In contrast, ABCB5 was upregulated in the chemotherapy-resistant group studied by Marzac et al. 28 Prevalence of stage I or II (together with a higher number of smaller sized tumors as well) was noticed in the general cluster with all 46 measured ABC genes downregulated. In descending order, ABCB3, D3, A3, C1, and B8 were the five most downregulated genes, underlining the strong downregulation of responsiveness to drugs within the cluster.
The frequency of the ABC genes among the five most upregulated or downregulated genes, within the revealed general ABC profiles, was also analyzed. Most interestingly, the ABCC7 gene was found to be three times among the most upregulated and also three times among the most downregulated genes. ABCC7, official symbol CFTR, codes for chloride channels and also controls the regulation of other transport pathways. Defective CFTR is widely known to cause cystic fibrosis; however, there is accumulating evidence that suggests an unexpected role of CFTR in various cancers, especially in gastroenterological cancers, such as pancreatic and colon cancers.33–35 From the above-mentioned previously published ABC studies, Park et al. 26 and Hlavata et al. 16 included ABCC7 in the ABC expression profiles with clinical consequences. Furthermore, each of the ABCA3, A8, A12, and C8 genes was present between the most deregulated ABC genes in five general ABC profiles. A tight connection between each of these four genes and different types of tumors has been also previously published.
The major limitation of the current pioneering study was the number of patients and tumor types that could be included. It is known that the expression and/or function of drug transporters may be influenced by genetic polymorphisms. 36 Therefore, the analyses of the most important genetic polymorphisms related to alterations in ABC gene functions should be performed and possible bias caused by the accumulation of specific variants determined, after the collection of more eligible samples.
In conclusion, this study demonstrates the existence of general ABC gene expression profiles in cancer and their importance on the clinical as well as research levels. It points to several ABC genes (ABCC7, A3, A8, A12, and C8), which could play key roles and be interesting also from a pharmacological point of view. The relationships between ABC gene expression profiles and some clinicopathological features also point to the wide range of functions not limited to transport fulfilled by ABC proteins. However, the number of patients and tumor types included was the major limitation. Further research in this field, taking into account more types of tumors and larger datasets, is therefore needed.
Footnotes
Author contributions
P.S. and P.D. designed the study; P.D. performed the statistics and bioinformatic analyses; P.S., P.D., and M.P. interpreted the results; P.D. and P.S. wrote the manuscript; and P.S. and M.P. critically reviewed the manuscript.
Declaration of conflicting interests
The author(s) declared no potential conflicts of interest with respect to the research, authorship, and/or publication of this article.
Funding
The author(s) disclosed receipt of the following financial support for the research, authorship, and/or publication of this article: This work was supported by the Czech Ministry of Health (grant no. AZV 15-25618A), the Czech Science Foundation (project no. P303/12/G163), and the National Sustainability Program I (NPU I) provided by the Ministry of Education, Youth and Sports of the Czech Republic (project no. LO1503).
References
Supplementary Material
Please find the following supplemental material available below.
For Open Access articles published under a Creative Commons License, all supplemental material carries the same license as the article it is associated with.
For non-Open Access articles published, all supplemental material carries a non-exclusive license, and permission requests for re-use of supplemental material or any part of supplemental material shall be sent directly to the copyright owner as specified in the copyright notice associated with the article.