
Abstract
Pancreatic ductal adenocarcinoma is a highly malignant tumor with poor prognosis, and the biomarkers for the early diagnosis, targeting therapy, and prognosis are still not clinically available. This study investigated the expression of forkhead box P1 and forkhead box O3a proteins in human pancreatic ductal adenocarcinoma tumor tissues and pancreatic tissues with and without benign lesions using immunohistochemical staining. Results showed that the positive rates of forkhead box P1 and forkhead box O3a protein expression were significantly lower in pancreatic ductal adenocarcinoma tumors compared to peritumoral tissues, benign pancreatic tissues, and normal pancreatic tissues (p < 0.01). Pancreatic tissues with negative forkhead box P1 and forkhead box O3a protein expression exhibited dysplasia or intraepithelial neoplasia. The positive rates of forkhead box P1 and forkhead box O3a expression were significantly lower in cases with tumor mass >5 cm, lymph node metastasis, invasion to surrounding tissues and organs, and tumor–node–metastasis III + IV stage disease compared to cases with tumor mass ⩽5 cm (p < 0.05), no lymph node metastasis (p < 0.001 and p = 0.001, respectively), no invasion (p = 0.003 and p = 0.004, respectively), and tumor–node–metastasis I or II stage disease (p < 0.05). Kaplan–Meier survival analysis showed that pancreatic ductal adenocarcinoma patients with negative forkhead box P1 and forkhead box O3a expression survived significantly shorter than patients with positive forkhead box P1 and forkhead box O3a expression (p = 0.000). Cox multivariate analysis revealed that negative forkhead box P1 and forkhead box O3a expression was an independent poor prognosis factor in pancreatic ductal adenocarcinoma patients. The area under the curve of a receiver operating characteristic curve was 0.642 for forkhead box P1 (95% confidence interval: 0.553–0.730) and 0.655 for forkhead box O3a (95% confidence interval: 0.6568–0.742). Loss of forkhead box P1 and forkhead box O3a protein expression is associated with carcinogenesis, progression, and poor prognosis in patients with pancreatic ductal adenocarcinomas.
Keywords
Introduction
Pancreatic ductal adenocarcinoma (PDAC) is a highly malignant tumor with poor prognosis, and it is estimated that about 39,590 pancreatic cancer patients died of PDAC in 2014 in United States. 1 The 5-year survival rate of PDAC is as low as 5%. 2 This poor prognosis of PDAC is mainly associated with the late diagnosis due to the lack of specific signs and biomarkers for early diagnosis, the high metastatic potential of tumor cells, and its resistance to chemotherapy. However, the biomarkers for the diagnosis, targeting therapy, and prognosis of PDAC are still not clinically available.
The forkhead box (FOX) proteins are a family of transcription factors consisting of 19 subfamilies of transcription factors that share a highly conserved DNA-binding domain of approximately 110 amino acids: the FOX domain (also known as the winged-helix domain). Within this family, the O subgroup contains four members: FOXO1, FOXO3, FOXO4, and FOXO6, 3 and the P subgroup contains FOXP1, FOXP2, FOXP3, and FOXP4. FOX proteins have pioneering transcription activity by being able to bind condensed chromatin and regulate the expression of genes involved in cell growth, proliferation, differentiation, longevity, and embryonic development.4,5
FOXO3 is critical in cell growth, proliferation, and development of cancer.6–8 The levels of FOXO3 are lower in most human cancers such as ovarian cancer, 9 cervical cancer, 10 prostate cancer, 11 hepatocellular carcinoma, 12 gastric cancer, 13 and colorectal cancer, 14 and low FOXO3 expression correlates with high malignancy and poor prognosis in these cancers. Liu et al. 15 found that lower FOXO3a expression is closely correlated with the aggressiveness of lung adenocarcinoma. FOXO3 was found to have a pro-metastatic role in promoting tumor progression in colorectal cancer. 16 Zhang et al. 17 found that the transcriptional factor FOXO3 decreased the expression of the tumor metastasis suppressor gene nm23-H1 in the non–small cell lung cancer. However, the expression and clinical significance of FOXO3 in the pancreatic cancer have not been reported.
FOXP1 is a member of the FOXP subfamily and a transcriptional repressor that has a broad range of functions. FOXP1 may act as a tumor suppressor as it is lost in several tumor types. 4 However, the reported clinical significance of FOXP1 in cancer is conflicting. For example, high FOXP1 nuclear expression was correlated with a worse prognosis in lymphoma patients in one study, 18 but showed no correlation with prognosis of lymphoma in another study. 19 The controversial findings in the prognostic effect of FOXP1 are also reported in breast cancer 20 (high expression correlated with favorable prognosis), non–small cell lung cancer (low expression correlated with poor prognosis), 21 hepatocellular carcinoma (high expression correlated with poor prognosis), 22 colorectal neoplasia (low expression correlated with poor prognosis), 23 prostate cancer (decreased expression correlated with poor prognosis), 24 and ovarian cancer (decreased nuclear expression correlated with poor prognosis). 25 The clinical significance of FOXP1 in PDAC has not been addressed.
In this study, FOXP1 and FOXO3 expression in benign and malignant pancreatic lesions was measured by immunohistochemistry. The clinicopathological significance of FOXP1 and FOXO31 expression and their associations with the prognosis of PDAC were analyzed.
Material and methods
Ethics
The protocol of this study was approved by the Ethics Committee of The Second Xiangya Hospital, Central South University. All procedures performed in the studies involving human participants were in accordance with the ethical standards of the institutional and/or national research committee and with the 1964 Helsinki declaration and its later amendments or comparable ethical standards.
Case selection
A total of 106 PDACs, 35 peritumoral tissues, 55 precursor pancreatic tissues, and 13 normal pancreatic tissues were collected at the Second and Third Xiangya Hospitals, Central South University. Invasion and lymph node metastasis were evaluated according to the standard criteria. 19
All tissues were treated with 4% formaldehyde for 24 to 48 h and then fixed in 10% formalin solution followed by paraffin embedding. Survival information was obtained through letters and phone calls from all the patients with adenocarcinoma. This study was pre-approved by the Ethics Committee for Human Study of Central South University.
Immunohistochemistry
Rabbit anti-human FOXP1 and FOXO3 polyclonal antibodies and EnVision™ Detection Kit were purchased from Dako (Carpinteria, CA, USA). EnVision immunohistochemistry of FOXP1 and FOXO3a was performed by following the user’s manual. Briefly, 4-µm-thick sections were cut from paraffin-embedded tissues. The sections were deparaffinized and then incubated with 3% H2O2 in the dark for 15 min. The antigen retrieval was performed with sodium citrate buffer (10 mM Sodium citrate, 0.05% Tween 20, pH 6.0) at 96°C for 30 min. The sections were incubated with rabbit anti-human FOXP1 and FOXO3a primary antibodies (1:100 dilution) for 1 h and then incubated with several drops of Solution A (horseradish peroxidase (HRP)–conjugated secondary antibodies) for 30 min, followed by 3,3′-diaminobenzidine (DAB) staining and hematoxylin counterstaining (Dako, Carpinteria, CA, USA). Positive controls were provided with the EnVision™ Detection Kit. The sections were dehydrated, soaked in xylene, and mounted with neutral balsam. A volume of 500 cells from 10 random fields were examined per section by two observers independently. An average of the percentages from these two observers was used for final evaluation. Cases with positive cells ⩾25% were considered positive, whereas other cases were considered negative. 26
Statistical analysis
Data were analyzed using the SPSS 17.0 (Statistical Package for the Social Sciences, Version 17.0; SPSS Inc., Chicago, IL, USA). The inter-relationship of FOXP1 and FOXO3a with histological or clinical factors was analyzed using χ2 test or Fisher’s exact test. The overall survival of patients with PDAC was analyzed using Kaplan–Meier univariate survival analysis and log-rank tests. Multivariate analysis was performed with Cox proportional hazards model and the 95% confidence interval (CI) was calculated. The area under the curve (AUC) for ARG2 or ASPH was performed with receiver operating characteristic curve (ROC). A p < 0.05 was considered to be statistically significant.
Results
The demographic and histopathological data
Among the 106 adenocarcinomas, 61 were collected from male patients (57.5%) and 45 from female patients (42.5%) with an average age of 54.50 ± 11.53 years. Histopathological subtypes of the 106 PDACs include 38 well-differentiated (35.8%), 35 moderately differentiated (33%), and 43 poorly differentiated (31.1%) adenocarcinomas. Among the 106 adenocarcinomas, 11 cases (10.4%) were T1, 41 (39.6%) were T2, 37 (34.9%) were T3, and 16 (15.1%) were T4 stage tumors. Of the 106 PDACs patients, 29 (27.5%) had regional lymph node metastasis, and 64 (60.4%) had invasion to surrounding organs and tissues. The peritumoral tissues ⩾2 cm were collected from the tumors. Of the 35 peritumoral tissues, 12 were normal, 10 were pancreatic intraepithelial neoplasms (PanINs) grade I, 8 were PanINs grade II, and 5 were PanINs grade III.
Fifty-five precursor pancreatic tissues were collected from 29 (52.7%) males and 26 (47.3%) females. Of the 55 precursor specimens, 13 (23.6%) were ⩽45 years and 42 (76.4%) were >45 years. The 55 precursor tissues included 20 chronic pancreatitis tissues (36.4%), 20 adenomas (36.4%), and 15 PanINs (27.3%). A total of 10, 6, and 4 of the 20 chronic pancreatitis tissues had mild, moderate, and severe pancreatitis, respectively. The 20 adenomas included 5 mucinous adenomas and 15 serous adenomas. A total of 4, 3, and 2 of the 20 adenomas had mild, moderate, and severe dysplasia, respectively. Among the 15 PanINs, 6 had grade I, 5 had grade II, and 4 had grade III PanINs. The 13 normal pancreatic tissues were collected from the 20 pancreatic adenomas.
FOXP1 and FOXO3a protein expression in adenocarcinoma, peritumoral, precursor, and normal pancreatic tissues
Immunohistochemical staining showed that positive FOXP1 and FOXO3a expression was found in the cytoplasm (Figures 1 and 2). In the 106 PDACs, 49 and 50 were FOXP1 (46.2%) and FOXO3a (47.2%) positive, respectively. In the 35 peritumoral tissues, 26 were FOXP1 (74.2%) and 26 were FOXO3a (74.2%) positive, respectively. In 55 precursor pancreatic lesions, 41 and 43 were FOXP1 (74.5%) and FOXO3a (78.2%) positive, respectively. In 13 normal tissues, all were FOXP1 and FOXO3a positive. The positive rate of FOXP1 or FOXO3a expression was significantly lower in PDAC than that in peritumoral, precursor, and normal pancreatic tissues (p < 0.01; Table 1). Peritumoral tissues and precursor pancreatic lesions with negative FOXP1 and/or FOXO3a expression exhibited moderate to severe dysplasia and grade II or III PanINs. Among the 55 precursor lesions, the positive rates of FOXP1 in chronic pancreatitis, adenomas, and PanINs were 85.0% (17/20) and 70.0% (14/20), 66.7% (10/15), respectively. The positive rates of FOXO3a in chronic pancreatitis, adenomas, and PanINs were 85.0% (17/20) and 75.0% (15/20), 73.3% (11/15), respectively. No significant differences in the positive rates of FOXP1 and FOXO3a were observed between three types of precursor lesions (p > 0.05).

Immunohistochemical staining of FOXP1 expression. (a) Positive FOXP1 expression in well-differentiated PDAC, ×200. (b) Negative FOXP1 expression in moderately differentiated PDAC, ×200. (c) Negative FOXP1 expression in chronic pancreatitis, ×200. (d) Negative FOXP1 expression in adenoma, ×200.

Immunohistochemical staining of FOXO3a expression. (a) Positive FOXO3a expression in moderately differentiated PDAC, ×200. (b) Negative FOXO3a expression in poorly differentiated PDAC, ×200. (c) Negative FOXO3a expression in PanINs II, ×200. (d) Negative FOXO3a expression in peritumoral tissue, ×200.
Comparison of FOXP1 and FOXO3a expression in normal, benign, and malignant pancreatic tissues.
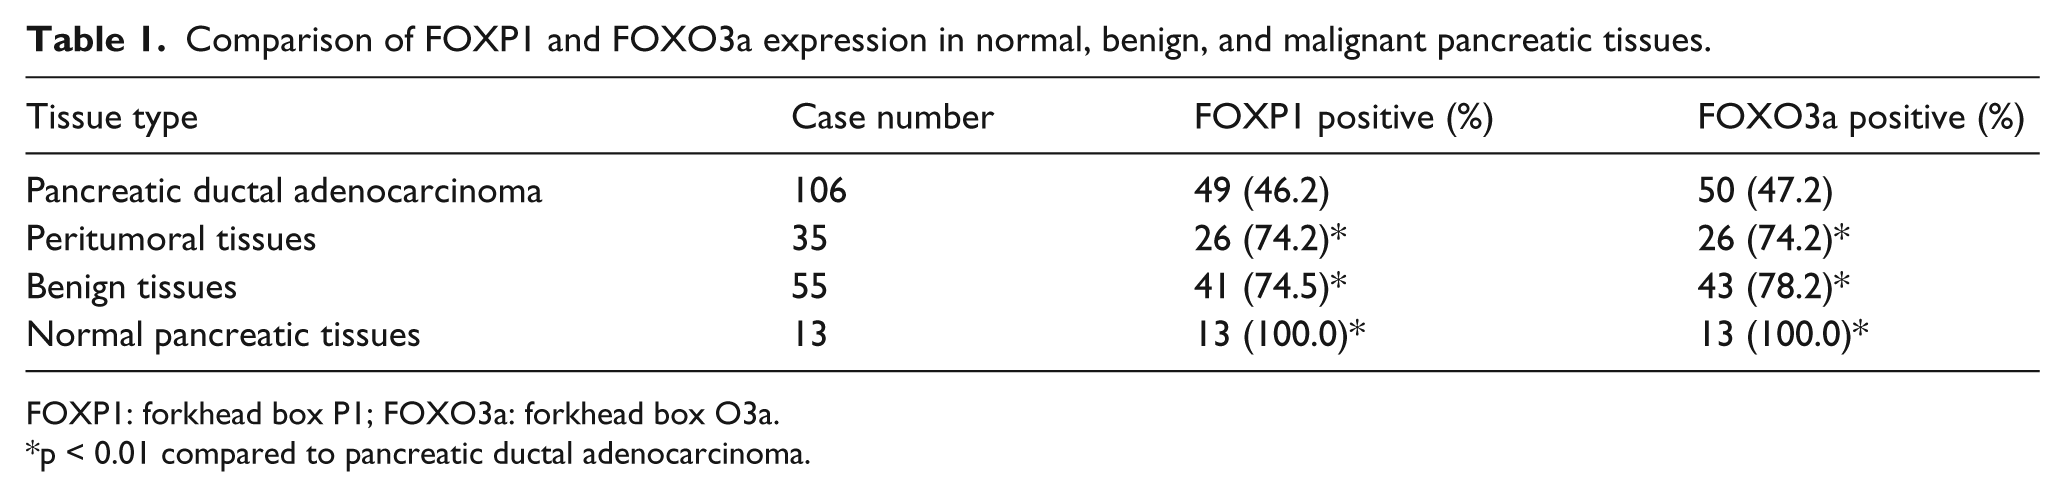
FOXP1: forkhead box P1; FOXO3a: forkhead box O3a.
p < 0.01 compared to pancreatic ductal adenocarcinoma.
FOXP1 and FOXO3a protein expression was associated with clinicopathological characteristics of PDAC
As shown in Table 2, positive rates of FOXP1 and FOXO3a expression were significantly lower in cases with tumor diameter ⩽5 cm, no lymph node metastasis, no invasion to surrounding tissues and organs, and tumor–node–metastasis (TNM) I + II stage disease compared to cases with tumor diameter >5 cm, lymph node metastasis, invasion, and TNM III or IV stage disease (p < 0.05 or p < 0.01). The expression of FOXP1 and FOXO3a exhibited no significant association with sex, age, and differentiated degrees of PDAC patients (p > 0.05). Among the 49 cases with positive FOXP1 expression, 39 cases had positive FOXO3a expression. Among the 57 cases with negative FOXP1 expression, 46 cases had negative FOXO3a expression. The expression of FOXP1 was positively correlated with FOXO3a (χ2 = 38.438; p = 0.000).
Correlations of FOXP1 and FOXO3a protein expression with the clinicopathological characteristics of PDAC.

FOXP1: forkhead box P1; FOXO3a: forkhead box O3a; PDAC: pancreatic ductal adenocarcinoma; TNM: tumor–node–metastasis.
FOXP1 and FOXO3a protein expression correlated with overall survival in patients with PDAC
Survival information of all patients was collected. Twenty-nine patients survived over 1 year, but 77 patients survived shorter than 1 year. Kaplan–Meier survival analysis revealed that the differentiation, tumor size, lymph node metastasis, invasion, and TNM stage were significantly associated with the average overall survival time of patients with PDAC (p < 0.05 or p < 0.01; Table 3). Average overall survival time in FOXP1, FOXO3a, and both FOXP1 and FOXO3a positive patients was significantly longer than patients with FOXP1, FOXO3a, and both FOXP1 and FOXO3a negative expression, respectively (p = 0.000; Figure 3). Cox multivariate analysis showed that poor differentiation, tumor mass, invasion, and high TNM stage (III or IV) are negatively correlated with overall survival and positively correlated with mortality. Positive FOXP1 and FOXO3a expression is positively correlated with overall survival and negatively correlated with mortality, and FOXP1 and FOXO3a positive expression is an independent prognostic factor (Table 4). An ROC curve was used to evaluate the diagnostic value of FOXP1 and FOXO3a as a marker of PDAC by plotting the true positive rate (sensitivity) against the false positive rate (1−specificity) at various threshold settings. ROC analysis showed an AUC of 0.642 for FOXP1 (95% CI: 0.553–0.730) and an AUC of 0.655 for FOXO3a (95% CI: 0.568–0.742; Figure 4).
Correlations of clinicopathological characteristics and FOXP1 and FOXO3a expression with the mean survival in patients with PDAC.

FOXP1: forkhead box P1; FOXO3a: forkhead box O3a; PDAC: pancreatic ductal adenocarcinoma; TNM: tumor–node–metastasis.
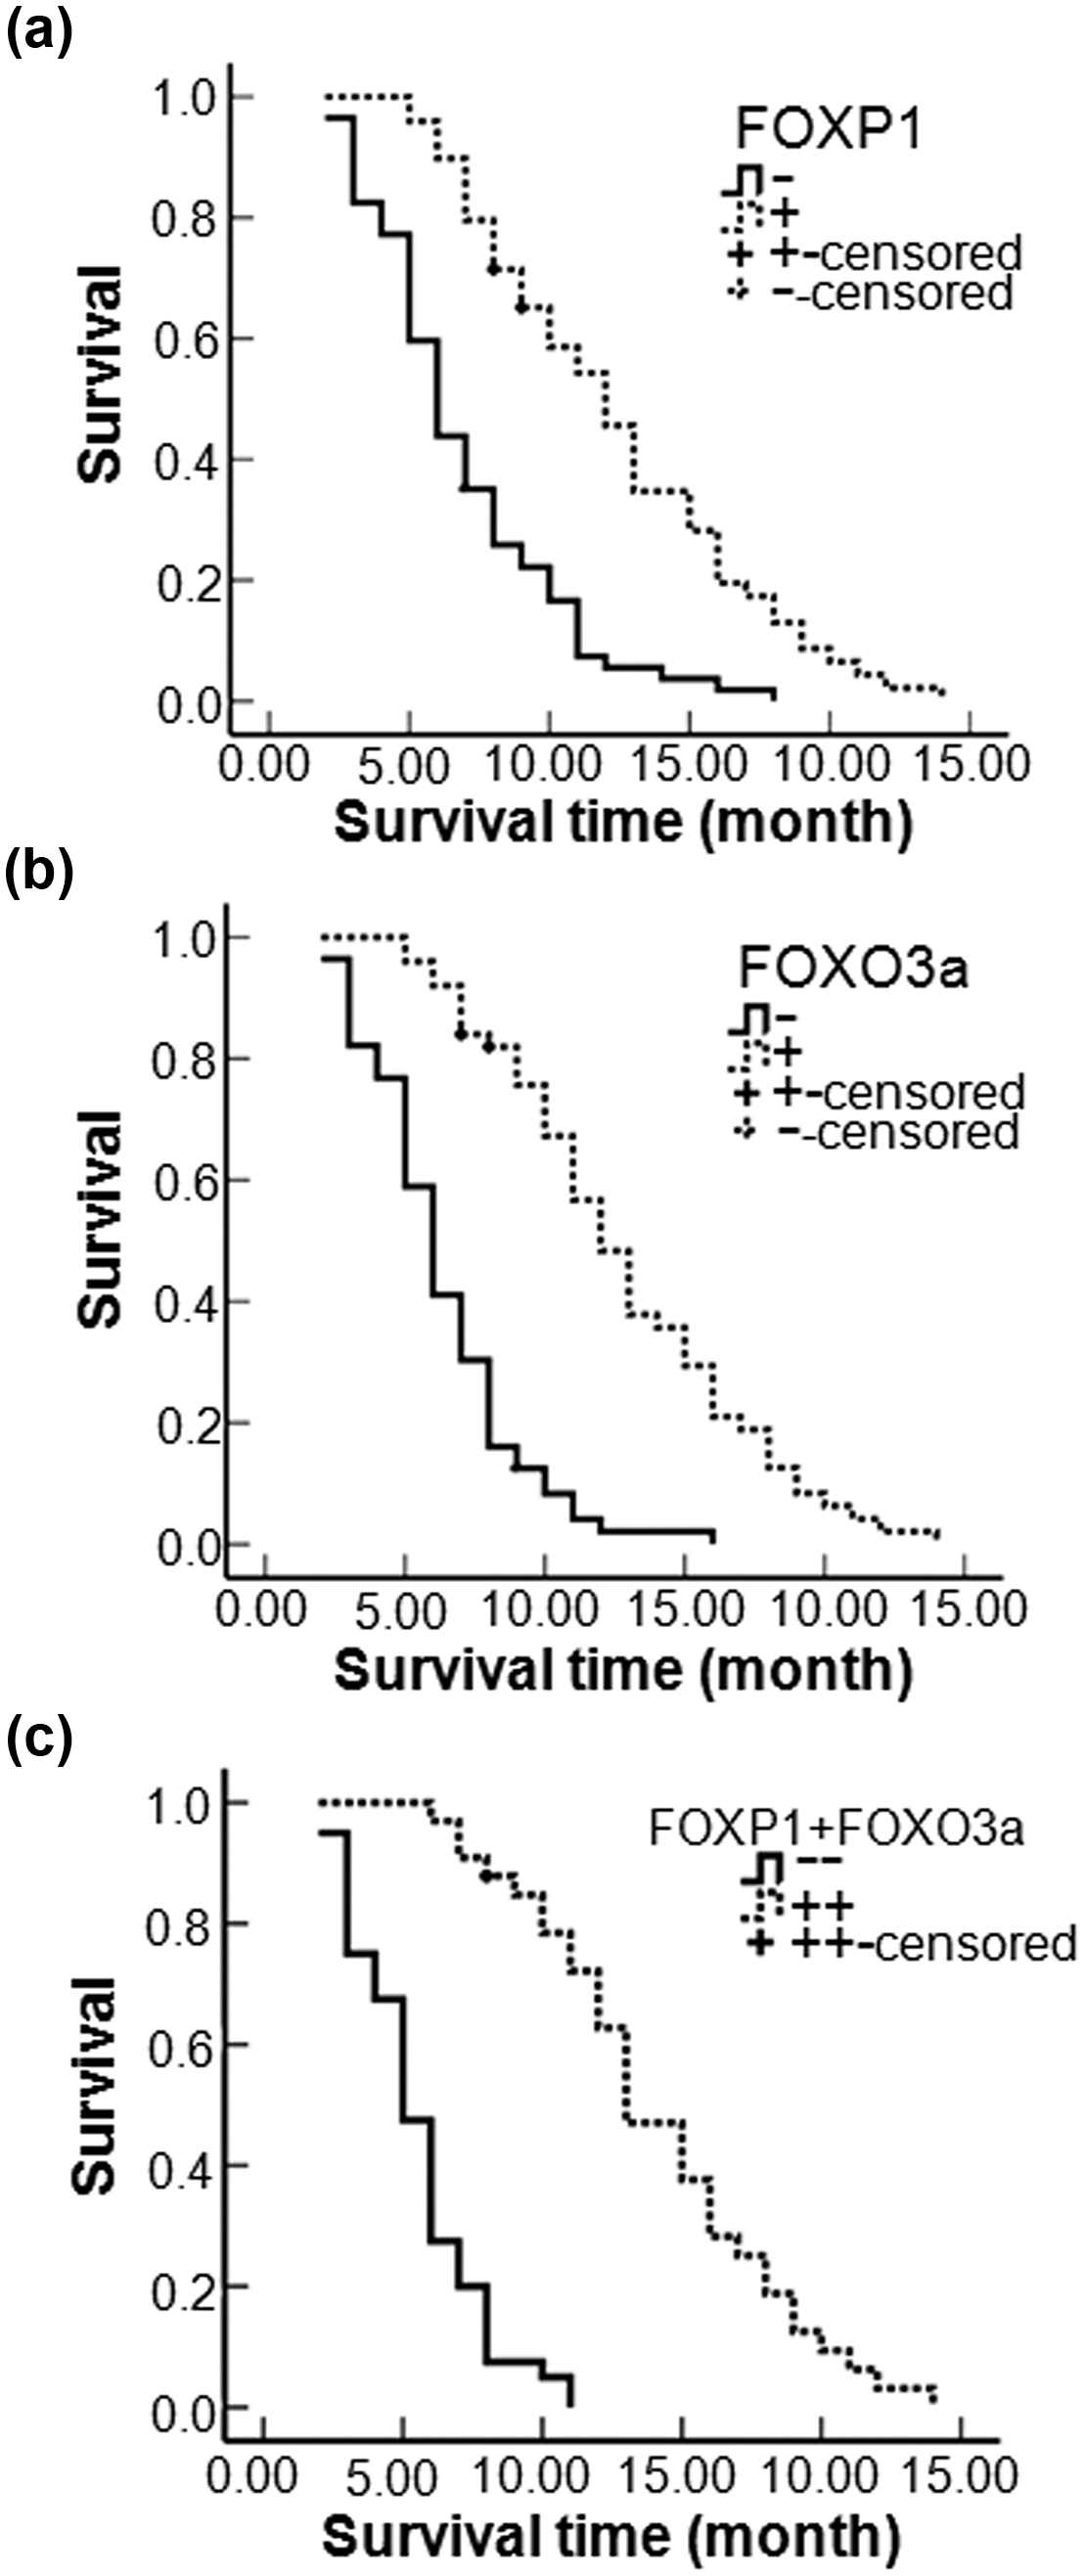
Kaplan–Meier plots of overall survival in patients with PDAC and with positive and negative FOXP1 and FOXO3a expression. (a) Kaplan–Meier plots of overall survival in patients with PDAC and with positive and negative FOXP1 expression. (b) Kaplan–Meier plots of overall survival in patients with PDAC and with positive and negative FOXO3a expression. (c) Kaplan–Meier plots of overall survival in patients with PDAC and with FOXP1(+) + FOXO3a(+) and FOXP1(−) + FOXO3a(−) expression.
Multivariate Cox regression analysis of survival rate in patients with pancreatic ductal adenocarcinoma and FOXP1 and FOXO3 expression.

FOXP1: forkhead box P1; FOXO3a: forkhead box O3a; SE: standard error; RR: relative risk; CI: confidence interval; TNM: tumor–node–metastasis.

Receiver operating characteristic curve analysis. (a) ROC shows the ability of FOXP1 in diagnosis of PDAC. (b) ROC shows the ability of FOXO3a in PDAC diagnosis.
Discussion
FOXP1 and FOXO3 expression has been studied in a variety of tumors, and most studies observed that the loss in their expression is being associated with tumor progression and poor prognosis. Generally, FOXP1 and FOXO3 function as a tumor repressor through regulating the tumor metastasis. However, the expression of FOXP1 and FOXO3 in PDAC has not been previously reported. This study investigated FOXP1 and FOXO3 protein expression in PDAC tumors, peritumoral tissues, benign pancreatic lesions, and normal pancreatic tissues using immunohistochemistry. A significant decrease in FOXP1 and FOXO3 expression in PDAC tumors was observed. Negative FOXP1 and FOXO3 expression is associated with severe clinical symptoms and poor prognosis in PDAC patients.
FOXP1 has been suggested to be both a tumor suppressor and potential oncogene, due to its differential expression levels in distinctive types of tumors. FOXP1 functions as an oncogene with high expression identified in B-cell lymphomas, glioblastoma, and hepatocellular carcinoma, and it is associated with a poor outcome.22,27,28 In contrast, loss of FOXP1 expression has been observed in colorectal neoplasia, 23 endometrial, 29 prostate, 24 ovarian cancer, 25 and renal cell carcinoma, 30 and the loss of FOXP1 expression in these tumors has been associated with lower survival rates. Our study is the first to show that 53.8% PDAC patients lost FOXP1 expression, and the negative FOXP1 expression is significantly correlated with severe clinical symptoms. Moreover, patients with negative FOXP1 expression survived significantly shorter than patients with positive FOXP1 expression, and Cox multivariate analysis suggested that negative FOXP1 expression is an independent poor prognostic factor in patients with PDAC.
Previous studies have shown that FOXO3a is a tumor growth suppressor and is negatively regulated by growth factors.31,32 During tumor development, inhibition of the transcriptional activity of FOXO3a promotes cell transformation and angiogenesis.33,34 However, to our knowledge, no study has reported the expression of FOXO3a in PDAC. Our study is the first to show that 52.8% PDAC patients lost FOXO3a expression, and negative FOXO3a expression is significantly correlated with severe clinical symptoms. Moreover, patients with negative FOXO3a expression survived significantly shorter than patients with positive FOXO3a expression, and negative FOXO3a expression is an independent poor prognostic factor in patients with PDAC.
FOXO3 was found to have a pro-metastatic role through decreasing the expression of the tumor metastasis suppressor gene nm23-H1.16,17 FOXP1 is recently reported to be a metastatic and chemotherapic resistance–associated gene in epithelial ovarian cancer. 35 Our study showed that loss of FOXP1 and FOXO3a protein expression is significantly correlated with the lymph node metastasis and invasion of tumor cells in PDAC patients, suggesting that both FOXP1 and FOXO3a proteins are tumor metastasis suppressors and loss of their expression enhances tumor metastasis. This study also showed that the expression of FOXP1 is positively correlated with the expression of FOXO3a in PDAC tumor tissues and loss of these two protein expression was more significantly associated with a poor prognosis in PDAC patients. These findings suggest that FOXP1 and FOXO3a may collaborate in the tumor growth and metastasis in PDAC patients. In this study, FOXP1 and FOXO3a expression was lost in PDAC, but highly expressed in normal pancreatic tissues, suggesting a significance of these two markers in the diagnosis of PDAC. In addition, the ROC curve showed a high sensitivity of FOXP1 and FOXO3a in the diagnosis of PDAC. Thus, FOXP1 and FOXO3a can be used as markers for the diagnosis of PDAC. This study also showed that peritumoral tissues and precursor pancreatic lesions with negative FOXP1 and/or FOXO3a expression exhibited moderate to severe dysplasia and grade II or III PanINs. This finding suggests that FOXP1 and FOXO3a may inhibit tumorigenesis and loss of their expression may cause tumor formation.
In conclusion, FOXP1 and FOXO3a are involved in the tumorigenesis and progression of PDAC, and negative FOXP1 and FOXO3a expression is a predictive marker for poor prognosis in patients with PDAC. Loss of FOXP1 and FOXO3a expression can be used as a sign of PDAC.
Footnotes
Declaration of conflicting interests
The author(s) declared no potential conflicts of interest with respect to the research, authorship, and/or publication of this article.
Funding
The author(s) disclosed receipt of the following financial support for the research, authorship, and/or publication of this article: The author(s) received no financial support for the research, authorship, and/or publication of this article.