
Abstract
Breast cancer is the leading cause of cancer-related mortality. DNA methylations play important roles in cancer development and progression. Formal concept analysis was previously utilized for data mining hypermethylated and hypomethylated genes in breast cancer molecular subtypes in illumina methylation–based microarray database, to laboratory validate their outputs; HS3ST2 (heparan sulfate
Introduction
Breast cancer is considered the most common cancer among women accounting for 22.9% of all female cancers. 1 It is the leading cause of cancer-related death in females. Earlier detection than treatment thought to improve survival. 2 In cancer, epigenetic changes in cytosine-phosphate-guanosine (CpG) methylation could negatively affect gene transcription. DNA methylation is considered an important and early event in carcinogenesis. Moreover, as a potential therapeutic target, DNA methylation is an emerging field of biomarkers. 3 Quantitative methylation analysis of cancer-related genes may be helpful for cancer diagnosis. 4
Several microarray-based methods have been developed, which allow rapid screening of multiple CpG sites in many gene promoters simultaneously. 5 Illumina high-throughput methylation microarray was used to analyze the data retrieved by Bediaga et al., 6 in which DNA methylation level of 806 cancer-related genes in 28 breast cancer subtypes paired samples was analyzed. The methylation data reported have been previously deposited in NCBI’s Gene Expression Omnibus (GEO) and are accessible through GEO Series accession number 7 (GEO: GSE22135).
A formal concept analysis (FCA) was utilized for data mining hypermethylated and hypomethylated genes in breast cancer molecular subtypes: luminal A, luminal B, basal like, and HER2+. It represents the relationship between objects (breast cancer subtypes) and attributes (hypermethylated and hypomethylated genes), which can be easily represented by a cross-table.8,9
Luminal A tumors are characterized as early-stage breast cancer, with tumor–node–metastasis (TNM) stages (stage IA, stage IB, stage IIA, and stage IIB), histopathological grade 1, and receptor status (estrogen receptor (ER)-positive, progesterone receptor (PR)-positive, and Her2-negative (ER+/PR+/Her2−)), and luminal A tumors tend to have the best outcome, while luminal B tumors are characterized as late-stage breast cancer with TNM stages (stage IIIA, stage IIIB, and stage IV), histopathological grade 2 or 3, and receptor status (ER-positive, PR-positive or negative, and Her2-positive (ER+/PR±/Her2+)). Luminal B breast tumors have aggressive clinical and biological features. 6
Two genes HS3ST2 (heparan sulfate
Heparan sulfate proteoglycans (HSPGs) are present in the extracellular matrix (ECM) and on the surface of every cell type.
10
There is now convincing evidence that HSPGs regulate several features of cancer biology, like tumorigenesis, invasion, and metastasis, moreover tumor HSPGs differ in composition from those in normal tissue, which could affect the efficiency of growth factor stimulation of cancer cells.
11
Substantiation has revealed that epigenetic changes in HSPG modification enzyme genes may be implicated in the process involved in HSPGs remodeling during tumor progression.
12
Heparan sulfate
The MUC1 transmembrane is expressed at a basal level by normal ductal epithelial cells of secretory organs, including breast. 14 MUC1 overexpression is related to the invasive proliferation of cancer and is considered a predictive of poor outcome for patients. 15
MUC1 is implicated in cancer progression by many mechanisms. The oncogenic MUC1 C-terminal transmembrane subunit (MUC1-C) associates with receptor tyrosine kinases and enhances their signaling pathways. It also localizes to the nucleus, then interacts with certain transcription factors, and contributes to their transactivation function. 16 In this manner, MUC1-C has been linked to the nuclear factor-κB (NF-κB) pathway, thereby contributes to the activation of NF-κB target genes,17,18 which support a direct role for MUC1-C in induction of (1) inflammatory cytokines, including interleukin (IL)-8; (2) the epithelial–mesenchymal transition (EMT) with downregulation of the CDH1 gene that encodes E-cadherin (ECAD); and (3) self-renewal capacity.19–21
The core of this study was to laboratory validate the results of FCA conducted on methylation-based microarray data of hypermethylated and hypomethylated genes in breast cancer molecular subtypes by evaluating the methylation pattern of HSPGs and MUC1 in breast cancer subtypes in comparison with benign breast conditions and normal breast using methylation-specific polymerase chain reaction (MS-PCR). Furthermore, this study also elucidate the methylation status of both genes in early and late stages of breast cancer in comparison and thus evaluate their role in cancer progression and invasion, which could be of future benefit in the development of new chemical biology approaches to retard tumor progression through the modulation of deregulated methylation pathways.
Patients and methods
Patients and samples
This study was conducted on 60 snap-frozen breast samples; the study was performed in accordance with Declaration of Helsinki and was approved by the Research Ethics Committee of Ain Shams University, Cairo, Egypt. An informed consent was obtained from all participants. Of these samples, 30 were malignant: 15 were obtained from breast cancer patients diagnosed as early-stage breast cancer (luminal A subtype) and the other 15 diagnosed as late-stage breast cancer (luminal B subtype). Clinical staging of breast cancer was performed according to TNM classification of American Joint Committee on Cancer (AJCC) 22 and graded according to American Cancer Society. 23 ER, PR, and Her-2/neu scores were detected by an experienced pathologist using immunohistochemistry techniques. Another 15 samples were obtained from patients with benign breast conditions: 12 were diagnosed as fibroadenoma, while 3 patients had fibroadenosis. The last 15 samples were obtained from apparently healthy normal individuals without any specific breast disease. They were recruited from the Plastic Surgery Department of El-Demerdash Hospital after performing plastic breast reduction as controls.
Bioinformatics
According to the results of FCA conducted on methylation-based microarray data of hypermethylated and hypomethylated genes in breast cancer molecular subtypes8,9 (Supplementary Tables 1 and 2 and Figures 1 and 2), two genes HS3ST2 and MUC1 were retrieved, which were proven by methylation-based microarray to be epigenetically controlled by methylation in breast cancer. Picking these two genes particularly has several aspects, which are as follows:
First, the malignant breast tissue samples collected for this study were categorized into luminal A and luminal B breast cancer subtypes, and according to the concept lattice results, MUC1 and HS3ST2 genes were epigenetically controlled by aberrant methylation in luminal A and luminal B molecular subtypes.
Second, MUC1 was proven to be hypomethylated in cancer, while HS3ST2 was proven to be hypermethylated in cancer, thus we picked these two genes to test the efficacy of MS-PCR in detecting both hypomethylated and hypermethylated genes.
Finally, both increased expression of MUC1 gene by hypomethylation and decreased expression of HS3ST2 gene by hypermethylation result in increased invasion of cancer cells and facilitating their metastasis, therefore epigenetic control of both genes leads to common effect in malignant tissue.
Laboratory validation of the methylation status of HS3ST2 and MUC1 in breast cancer subtypes benign and normal breast conditions using MS-PCR
DNA extraction and quantification of purified DNA
DNA was isolated from breast tissue using the QIAamp DNA Mini Kit (QIAGEN®, Hilden, Germany) following the manufacturer’s specifications. The concentration of the extracted DNA was determined spectrophotometrically by measuring their absorbance at 260 nm of a 1:25 dilution using a BioPhotometer (Ultrospec 1000; Amersham Pharmacia Biotech, England).
Sodium bisulfite modification of the DNA
Genomic DNA was subjected to bisulfite-conversion method, which induces chemical modification of cytosine residues to uracil in unmethylated DNA, whereas those that are methylated are resistant to treatment and remain as cytosines. 24 A volume of 20 µL of purified DNA sample was used for bisulfite conversion using the EpiTect Bisulfite Kit (QIAGEN, Germany) according to the manufacturer’s instructions.
MS-PCR
For MS-PCR, 25 1 mL of the sodium-bisulfite-treated DNA was amplified with primers specific for hypermethylated or hypomethylated sequences of both genes as shown in Table 1.13,26 Primers were purchased from Matrix Scientific Trade Co. (Haram Cairo, Egypt).
Primers used in MS-PCR analysis.

Complete in vitro methylation of the control DNA was achieved using SssI methylase. Bisulfite conversion of control DNA was achieved using the EpiTect Bisulfite Kit and used as a control. For M and U set primers, the annealing temperature (58°C) and PCR cycles (39 cycles) were similarly determined.
The MS-PCR products were visualized by 2% agarose gel electrophoresis and photographed in Genius gel documentation system (Syngene Bioimaging; Synoptics Ltd, England). Gene snap automatic image capture software from Syngene was used.
Quantitative estimation of the percentage of methylated alleles (PMA) of MUC1 and HS3ST2 genes in malignant, benign, and normal groups was performed using the “Quantity One” computer program, version 4.6.3 (Bio-Rad Laboratories, USA): PMA was calculated by dividing the quantity of methylated alleles by the total quantity of methylated and unmethylated alleles obtained from the MS-PCR reactions carried out for breast tissue samples of the four studied groups. 27
Statistical analysis
Univariate analysis was performed using a chi-square test of association of categorical variables. The threshold value for optimal sensitivity and specificity of PMA of HS3ST2 and MUC1 was determined by receiver operating characteristics (ROC) curve. The nonparametric Kruskal–Wallis test was used for the statistical comparison of variables among groups. Sensitivity, specificity, positive predictive value (PPV), negative predictive value (NPV), and accuracy were calculated according to standard statistical methods. All analyses were performed using Statistical Package for the Social Sciences software (version 17, SPSS Inc., USA).
Results
As regards HS3ST2, methylated HS3ST2 appeared as a band at 171 bp, while unmethylated HS3ST2 appeared as a band at 172 bp (Figure 1(a) and (b)). Each case in Figure 1 was represented by two successive lanes, one for methylated band (M) and the other for unmethylated band (U).
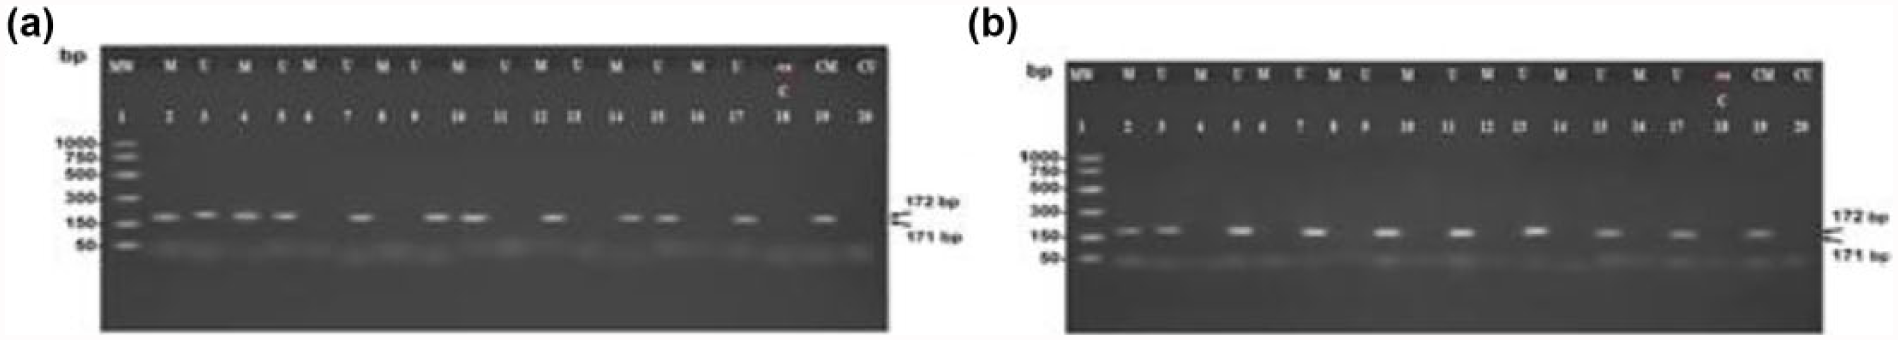
Methylation-specific PCR product analysis of breast cancer tissue by agarose gel electrophoresis and ethidium bromide staining. Unmethylated HS3ST2 band at 172 bp and methylated HS3ST2 band at 171 bp (Lane 1: PCR markers (MW: 50, 150, 300, 500, 750, and 1000 bp); Lane 18: negative control; Lane 19: control M; Lane 20: control U). (a) Breast cancer tissue. Lanes 2–9: PCR products of DNA from breast cancer patients with luminal A subtype. The first two cases show positive methylated and unmethylated HS3ST2 bands (M/U), while the third and fourth cases (Lanes 6 and 9) show positive unmethylated HS3ST2 band only (U/U). Lanes 10–17: PCR product of DNA from breast cancer patients with luminal B subtype. The first two cases show positive methylated HS3ST2 band only (M/M), while the third case (Lanes 14 and 15) shows positive methylated and unmethylated HS3ST2 bands (M/U) and the fourth case shows positive unmethylated HS3ST2 band (U/U). (b) Benign and normal breast tissue. Lanes 2–9: PCR product of DNA breast tissue from patients with benign breast tumors. The first case shows positive methylated and unmethylated HS3ST2 bands (M/U), while the other three cases (Lanes 4–9) show positive unmethylated HS3ST2 band only (U/U). Lanes 10–17: breast tissue from healthy normal subjects. All the cases show only positive unmethylated HS3ST2 band (U/U).
Frequency of methylated HS3ST2 gene in all groups of the study was compared using chi-square test and showed a highly significant difference (p < 0.0001) among the four groups (Table 2).
Pattern of HS3ST2 methylation in the different groups of the study (n = 60).

χ2: chi-square test; crosstab: cross tabulation (Pearson chi-square value).
p < 0.01 is highly significant.
On comparing the cancer group versus the control, 50% of the breast cancer cases showed the heteroplasmic methylation pattern (M/U), while 37% showed the homoplasmic unmethylation pattern (U/U) and 13% showed the methylation pattern (M/M). While 90% of the benign and normal cases (control group) showed the unmethylation pattern (U/U), 7% revealed the methylation pattern (M/M) and 3% showed the methylation pattern (M/U). There was high statistical significant difference between control and malignant breast cases (p < 0.01; Table 2).
On comparing the early versus the late stages of cancer, luminal A breast cancer cases constituted 60% of the unmethylation pattern (U/U) and 40% of methylation pattern (M/U), and none of the cases showed homoplasmic methylation of HS3ST2 gene; however, luminal B breast cancer cases constituted 13% of the unmethylation pattern (U/U), 27% of methylation pattern (M/M), and 60% of methylation pattern (M/U). There was high statistical significant difference between luminal A and B subtypes in relation to methylation pattern (p < 0.01; Table 2).
As regards MUC1, methylated MUC1 gene appeared as a band at 78 bp, while unmethylated MUC1 appeared as a band at 82 bp (Figure 2(a) and (b)). Each case in Figure 2 was represented by two successive lanes, one for methylated band (M) and the other for unmethylated band (U).

Methylation-specific PCR product analysis of breast cancer tissue by agarose gel electrophoresis and ethidium bromide staining. Unmethylated MUC1 band at 82 bp and methylated MUC1 band at 78 bp (Lane 1: PCR markers (MW: 50, 150, 300, 500, 750, and 1000 bp); Lane 18: negative control; Lane 19: control M; Lane 20: control U). (a) Breast cancer tissue. Lanes 2–9: PCR product of DNA from breast cancer patients with luminal A subtype. The first two cases show positive methylated and unmethylated MUC1 bands (M/U), while the third case (Lanes 6 and 7) shows methylated MUC1 band only (M/M) and the fourth case shows unmethylated MUC1 band only (U/U). Lanes 10–17: PCR product of DNA from breast cancer patients with luminal B subtype. The first case shows positive methylated and unmethylated MUC1 bands (M/U), while the other three cases (Lanes 12–17) show unmethylated MUC1 band only (U/U). (b) Benign and normal breast tissue. Lanes 2–9: PCR product of DNA from benign breast tissue. The first two cases (Lanes 2–5) show methylated MUC1 band only (M/M), while the other two cases (Lanes 6–9) show positive methylated and unmethylated MUC1 bands (M/U). Lanes 10–17: PCR product of DNA from healthy normal breast tissue. All the cases show methylated MUC1 band only (M/M), while the last case (Lanes 16 and 17) shows positive methylated and unmethylated MUC1 bands (M/U).
Methylation patterns among the groups of the study are shown in Table 3. Frequency of the methylated MUC1 gene was compared using chi-square analysis and revealed highly significant difference (p < 0.01) among the four groups.
Pattern of MUC1 methylation in the different groups of the study (n = 60).
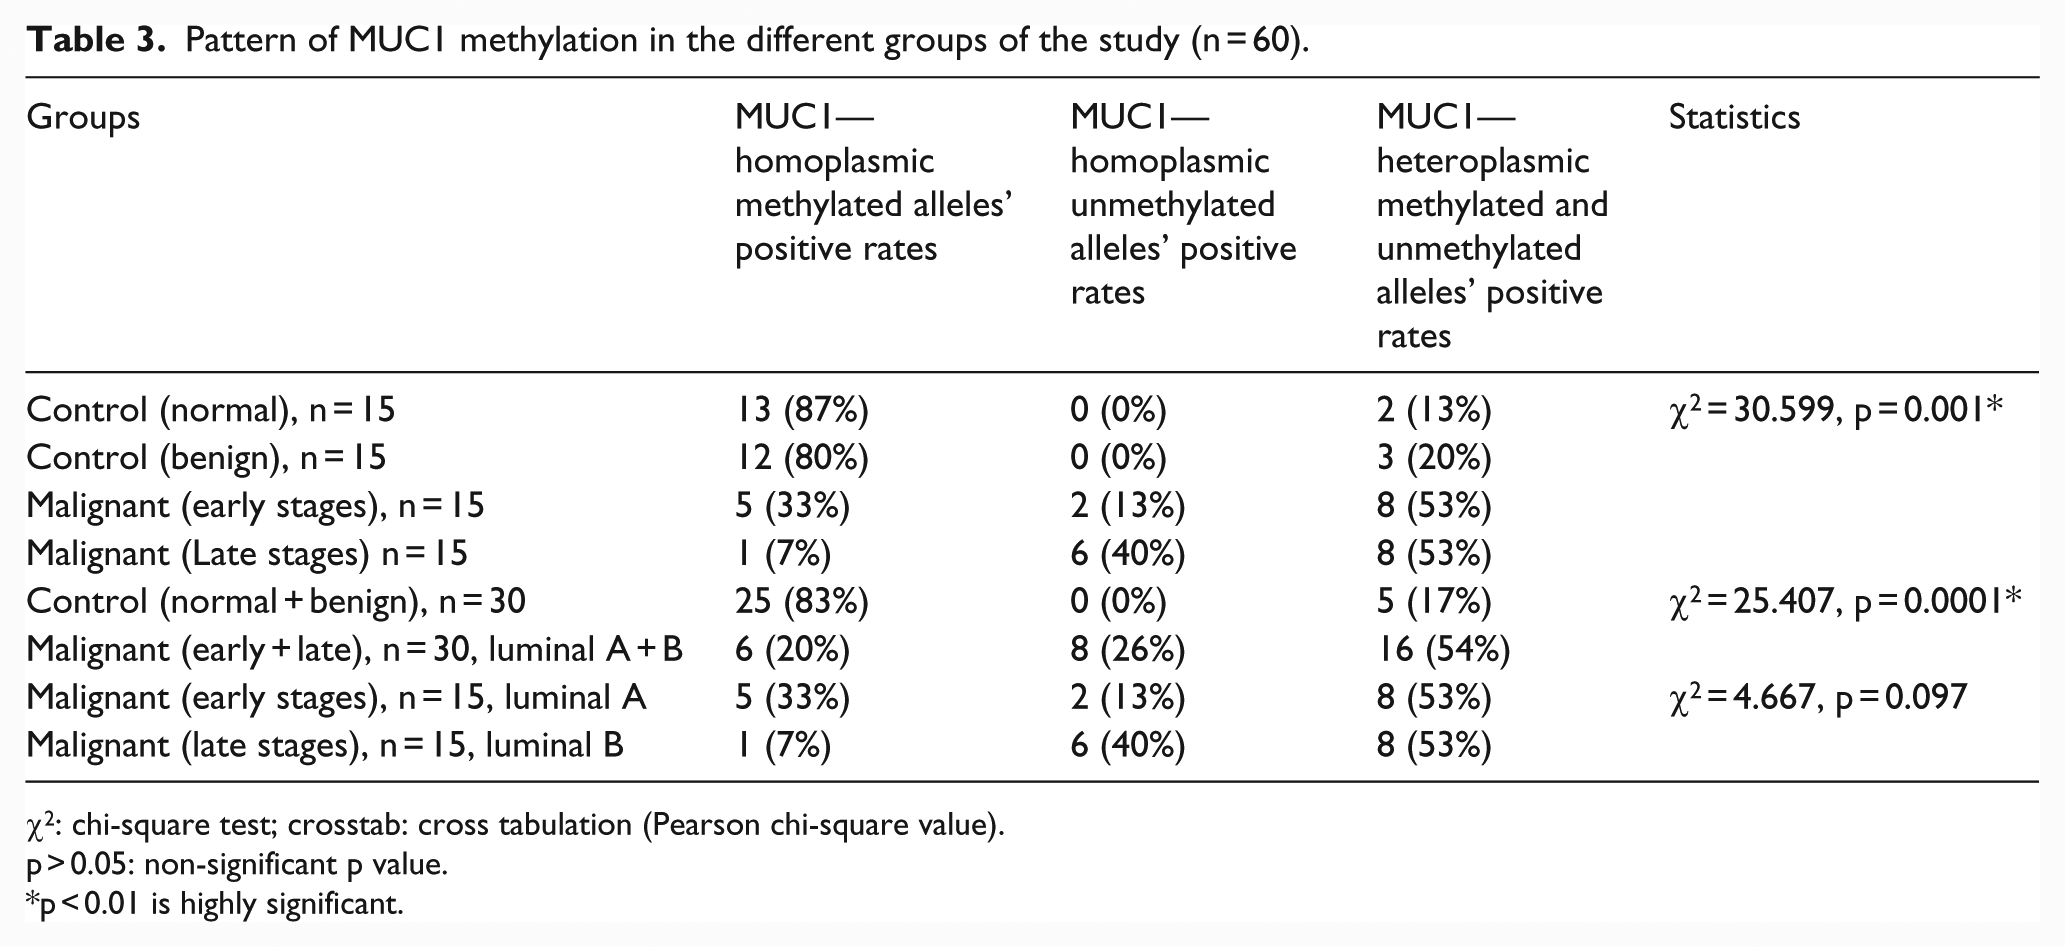
χ2: chi-square test; crosstab: cross tabulation (Pearson chi-square value).
p > 0.05: non-significant p value.
p < 0.01 is highly significant.
On comparing the cancer group versus the control, breast cancer cases represented 54% of the methylation pattern (M/U), 20% of the methylation pattern (M/M), and 26% of the methylation pattern (U/U), while 83% of the benign and normal cases showed the methylation pattern (M/M) and the remaining 17% showed the methylation pattern (M/U). There was high statistical significant difference between control and malignant breast cases (p < 0.01; Table 3).
On comparing the early versus the late stages of cancer, luminal A breast cancer cases constituted 33% of the methylation pattern (M/M) and 13% of methylation pattern (U/U); however, luminal B breast cancer cases constituted only 7% of the methylation pattern (M/M) and 40% of methylation pattern (U/U), while both luminal A and luminal B cases showed 53% of the methylation pattern (M/U). However, there was no statistical difference between luminal A and luminal B cases in relation to the methylation pattern (p > 0.05; Table 3).
Quantitative analysis of HS3ST2 and MUC1 MS-PCR products
Quantitative estimation of the (PMA) of HS3ST2 gene in malignant, benign, and normal groups revealed that it was significantly higher in the luminal B malignant group (mean rank = 47.07) as compared to luminal A malignant group (mean rank = 29.03), benign group (mean rank = 26.40), and normal control groups (mean rank = 19.50; p < 0.01; Table 4).
Quantitative MS-PCR presented as PMA of MUC1 and HS3ST2 genes and positivity rate in the malignant group compared to benign and normal control groups.

χ2: Kruskal–Wallis test (chi-square value).
χ2: chi-square test; crosstab: cross tabulation (Pearson chi-square value).
p < 0.01 is highly significant.
Regarding MUC1 gene, PMA was significantly lower in the luminal B malignant group (mean rank = 11.47) as compared to luminal A malignant group (mean rank = 27.67), benign group (mean rank = 41.13), and normal control groups (mean rank = 41.73, p < 0.01; Table 4).
ROC curve showed that the best cutoff value by considering the benign and healthy normal groups as non-malignant control group for HS3ST2 gene methylation was 13 and the area under the curve was 0.752 (Figure 3(a)). The positivity rate of quantitative MS-PCR of HS3ST2 (no. of cases ≥13) was estimated among different groups of the study. In healthy control group, methylated HS3ST2 gene positivity rate was 0%, in benign group 20%, in luminal A malignant group 40%, and in luminal B malignant group 86.6% with high statistical significant difference between the four groups (p < 0.01). No significant correlation was found between methylated HS3ST2 gene positivity rate and any of studied clinicopathological factors (p > 0.05; Supplementary Table 3).

ROC curve analysis for the percentage of methylated alleles (PMA) of (a) HS3ST2 and (b) MUC1 genes in malignant group versus benign and normal control groups to calculate the best cutoff value.
Sensitivity, specificity, PPV, NPV, and accuracy for discrimination between malignant and non-malignant groups, based on HS3ST2 gene methylation, at this cutoff value are 63%, 90%, 86%, 71%, and 76.6%, respectively, as shown in Table 5.
Performance characteristics of the positivity of HS3ST2 and MUC1 gene unmethylation and hypermethylation in breast tissue.

PPV: positive predictive value; NPV: negative predictive value.
By applying the ROC curve analysis for PMA of MUC1 gene, the best cutoff for MUC1 gene methylation was 62 and the area under the curve was 0.864 (Figure 3(b)). The positivity rate of quantitative MS-PCR of MUC1 gene (no. of cases ≤62) was estimated among the different groups of the study (Table 4). In healthy control group, methylated MUC1 gene positivity rate was 13.33%, in benign group 20%, in luminal A malignant group 53.3%, and in luminal B malignant group 93.3%, with high statistical significant difference between the four groups (p < 0.01). No significant correlation was found between positivity rate of quantitative MS-PCR of MUC1 gene and any of the studied clinicopathological factors (p > 0.05; Supplementary Table 4).
Sensitivity, specificity, PPV, NPV, and accuracy for discrimination between malignant and non-malignant groups, based on MUC1 gene unmethylation, at this cutoff value are 73%, 83%, 81%, 75.7%, and 78%, respectively, as shown in Table 5.
Discussion
Breast cancer is a major health problem; genetic, chromosomal, and epigenetic changes are implicated in the development of breast cancer, and understanding the molecular mechanisms may hold the key for better clinical management.28,29 DNA methylation is an early event in carcinogenesis as well as a potential therapeutic target. 3 Methylation-based microarray methods are an extension of the technologies available to analyze bisulfite-treated DNA. Meanwhile, they allow for genome-wide analysis of methylation. 5 With this rapid advance in technology, data are being generated in large throughput so that an imposing data mining task is mandatory to effectively and efficiently extract useful biological information from the huge and fast-growing gene methylation data. 30
FCA is a technique that was utilized for data mining hypermethylated and hypomethylated genes in breast cancer molecular subtypes in methylation-based microarray database. The method has been applied to molecular breast cancer subtypes luminal A and luminal B and revealed that HS3ST2 and MUC1 genes have specific hypermethylation and hypomethylation status, respectively, in both luminal A and luminal B. 31 This study aims to laboratory validate the FCA as a reliable technique to data mine and analyze methylation-based microarray results.
Thus, the two genes HS3ST2 and MUC1 were retrieved from the previous FCA in order to validate and compare their methylation status among 60 subjects including breast cancer patients of luminal A (early stages) and luminal B (late stages) subtypes, patients with benign breast conditions, and apparently healthy normal individuals. The net outcome of anticipated altered methylation of both genes is the increase in the invasion behavior of breast cancer cells and facilitation of their metastasis.
HSPGs play vital roles in tumor progression. Several aberrant modulation of several key HS biosynthetic enzymes such as HS3ST2 results in the production of tumor-specific HS which helps cancer cells to breakdown ECM to spread, alter signaling pathways to increase their proliferation, enhance angiogenesis to receive nutrients, and escape natural killer cells. 32
In this study, we found that 87% of late-stage breast cancer cases showed methylation of HS3ST2 gene, while only 40% of early-stage breast cancer cases showed methylation. However, only 20% of benign breast cases showed methylation of HS3ST2 gene. Furthermore, all the normal control cases showed homoplasmic unmethylation of that gene. There was high a statistical significant difference between early and late stages of breast cancer cases in relation to methylation pattern (p < 0.01). Quantitative estimation of the PMA of HS3ST2 gene in malignant, benign, and normal groups revealed that it was significantly higher in the luminal B malignant group (mean rank = 47.07) as compared to luminal A malignant group (mean rank = 29.03), benign group (mean rank = 26.40), and normal control groups (mean rank = 19.50, p < 0.01).
The obtained results increase the evidence that epigenetic changes in HS3ST2 may underlie the mechanisms involved in tumor progression, being more methylated in advanced stages of the disease.
These results are in accordance with a study conducted by Miyamoto et al., 13 which proved that methylation-associated silencing of HS3ST2 was found in human breast, colon, lung, and pancreatic cancers.
Furthermore, Fernández-Vega et al. 33 revealed that the transcription of HS3ST2 gene was downregulated in about 45% of breast cancer cases analyzed and HS3ST6 revealed significant differences, appearing to be downregulated about 10 fold in more than 80% of metastatic and non-metastatic IDCs.
Moreover, the study conducted by Vijaya Kumar et al. 34 demonstrated the impact of HS3ST2 silencing on signaling events modulating breast cancer cell invasion and resistance to chemotherapy, which could open new strategies for cancer therapy.
In conclusion, once the role of HS3ST2 silencing in cancer development and progression is clarified, the presence of its product in the ECM could be useful as a target for cancer therapeutics.
However, MUC1 gene is highly expressed in breast cancer tissue and its protein product may function as an anti-adhesion molecule, permitting invasion into the surrounding tissues and thus serve as markers for tumor progression and metastasis.15,35
Moreover, MUC1 is of importance in regulation of gene expression in cancer; on that basis, Rajabi et al. 36 demonstrated that MUC1-C selectively and coordinately activates the DNA methyltransferase genes (DNMT1 and DNMT3b) in breast cancer cells and thereby causes specific changes in DNA methylation which could include HS3ST2, indicating a possible synergistic effect between high expression of MUC1 leading to methylation and silencing of HS3ST2 resulting together in increase in the invasiveness behavior of breast cancer.
This study revealed a high statistical significant difference between control and malignant breast cases in relation to methylation pattern of MUC1 (p < 0.01). However, there was no statistical difference between luminal A and luminal B breast cancer subtypes in relation to the methylation pattern (p > 0.05). Regarding MUC1 gene, the PMA was significantly lower in the luminal B malignant group (mean rank = 11.47) as compared to luminal A malignant group (mean rank = 27.67), benign group (mean rank = 41.13), and normal control groups (mean rank = 41.73, p < 0.01).
Conclusion
The results of MS-PCR in this study validate the FCA method for data mining the illumina methylation–based microarray so that it can be trusted in the future.
FCA is very powerful for identifying the relationship between objects (breast cancer subtypes), but the comparison with the other related approaches needs to be considered in future works.
The detection of MUC1 and HS3ST2 promoter methylation status appears to be a promising marker for detecting early onset of breast cancer and could be used as useful molecular markers for assessing the progressive state of the disease. Moreover, could be helpful in discriminating different molecular subtypes.
However, further multicentric studies should be required to define the impact of these molecular markers on disease detection and monitoring; also, longitudinal follow-up of breast cancer cases is needed to understand the association of methylation of candidate genes in cancer development.
Footnotes
Declaration of conflicting interests
The author(s) declared no potential conflicts of interest with respect to the research, authorship, and/or publication of this article.
Funding
The author(s) received no financial support for the research, authorship, and/or publication of this article.
References
Supplementary Material
Please find the following supplemental material available below.
For Open Access articles published under a Creative Commons License, all supplemental material carries the same license as the article it is associated with.
For non-Open Access articles published, all supplemental material carries a non-exclusive license, and permission requests for re-use of supplemental material or any part of supplemental material shall be sent directly to the copyright owner as specified in the copyright notice associated with the article.