
Abstract
We aimed to investigate the prognostic value of the immune cells population in peripheral blood from patients with advanced gastric cancer treated with neoadjuvant chemotherapy. A total of 105 patients with advanced gastric cancer were evaluated in this study. Blood samples were collected before and 1 week after the last dose of chemotherapy. The percentage of CD3+, CD3+CD4+, CD3+CD8+, and CD4+CD25+Foxp3+ T cells was assessed using flow cytometry analysis. The relationship between T cell subsets and clinical outcome was evaluated. The percentage of CD3+CD8+ lymphocytes was significantly increased after chemotherapy and CD4+CD25+Foxp3+ regulatory T cells (Tregs) decreased (p = 0.003 and p < 0.001, respectively). The percentage of CD3+CD8+ lymphocytes and Tregs was strongly associated with response to chemotherapy (p = 0.017 and p < 0.030, respectively). Patients with high CD3+CD8+ T cells and low CD4+CD25+Foxp3+ Tregs had significantly increased overall survival (p = 0.012 and p = 0.048, respectively). Neither CD3+ nor CD3+CD4+ T cells showed significant changes after chemotherapy or correlations with the clinical outcome. The positive correlation between a high CD3+CD8+ T cells or low CD4+CD25+Foxp3+ Tregs and clinical outcome indicates its key role in the prognosis of gastric cancer patients and may serve as a biomarker to identify patients likely to benefit from neoadjuvant chemotherapy.
Background
Gastric cancer is the second common cause of cancer-related mortality worldwide, and its incidence in China alone accounts for nearly half of all cases around the world. 1 Most cases of gastric cancer in China are diagnosed as advanced gastric cancer.2,3 Several clinical trials have shown that perioperative chemotherapy additional to adequate complete surgical resection (R0) is able to improve disease-free survival and overall survival (OS) in patients with locally advanced gastric cancer.4–6 Despite advances in surgical techniques and variety of combined chemotherapy regimens, the overall response rate to chemotherapy is less than 50% and the prognosis is still very poor.4,7 It would be advantageous to predict which patients would benefit most from neoadjuvant chemotherapy and who might gain the best survival advantage.
The immune response to gastric cancer is complex, involves the interaction of several cell types of the immune systems, which plays an important role in the progression of the disease. It is generally believed that T lymphocytes represent the major population of tumor-infiltrating immune cells; among which CD3+CD4+ T cells and CD3+CD8+ T cells comprise the primary immune cells, which are responsible for inhibiting tumor growth and development. 8 Studies revealed a significant correlation between high tumor-infiltrating lymphocytes (TILs), such as CD3+ and CD3+CD8+ T cells, and improved outcome in patients with cancer.9,10 In contrast, regulatory T cells (Tregs), defined as CD3+CD4+CD25+CD4+CD25+Foxp3+ T cells, are thought to function primarily by repressing CD3+CD8+ T cell functionality and associated with poor prognosis in cancers.11,12 Increased levels of Tregs in both the tumor microenvironment and peripheral blood have been reported in patients with gastrointestinal cancer, breast cancer, pancreatic cancer, hepatocellular cancer, and so on.13–15
In this work, we aimed to investigate the potential immunomodulatory effect of neoadjuvant chemotherapy on the immune cells population, including CD3+, CD3+CD4+, CD3+CD8+, and CD4+CD25+Foxp3+ in peripheral blood in advanced gastric cancer patients. In addition, the correlation with clinical parameters and patient outcome was examined in order to determine the potential prognostic impact of the immune T cells on response to neoadjuvant chemotherapy and OS.
Patients and methods
Patients
From 2005 to 2010, 105 out of a total of 885 hospitalized gastric cancer patients diagnosed with locally advanced gastric cancer were treated with neoadjuvant chemotherapy at the Department of General Surgery, Jinling Hospital. All cases were diagnosed by endoscopic biopsy and evaluated by contrast-enhanced computed tomography (CT) scan and endoscopic ultrasound. Laparoscopy combined with peritoneal cytology was performed in patients with potentially resectable liver and peritoneal metastases. The 6th edition UICC TNM classification is used for preoperative staging, and the number of lymph node stations was determined according to the Japanese Gastric Cancer Association (JGCA) classification.
Treatment protocol and follow-up
All patients received two cycles of preoperative chemotherapy with a regimen of 5-Fu/leucovorin/etoposide/oxaliplatin/epirubicin (FLEEOX) combination via intravenous and intra-arterial administration. 5-Fu (370 mg/m2) and leucovorin (200 mg/m2) were administered by intravenous infusion on days 1–5. Intra-arterial administration of etoposide (80 mg/m2), oxaliplatin (80 mg/m2), and epirubicin (30 mg/m2) was performed by Seldinger method on days 6 and 20, the catheter was inserted through femoral artery into the celiac artery and the chemicals were injected initially at relatively high doses, followed by 14 days’ rest. The chemotherapeutic response was evaluated using contrast-enhanced CT scan by two experienced radiologists, who were blinded to any of the clinical data independently, according to the Response Evaluation Criteria in Solid Tumors (RECIST) guidelines. 16 The patients evaluated as resectable underwent gastrectomy with D2 lymphadenectomy. D2+ lymphadenectomy would be performed if preoperative CT scan shows N3 lymph node metastasis. Patients who underwent surgical treatment received six cycles of chemotherapy with the regimen of XELOX, oxaliplatin (130 mg/m2) on day 1 and xeloda (1000 mg/m2) on days 1–14 of a 28-day cycle. The rest changed to other regimens and/or best supportive care.
Follow-up examinations were performed according to the institutional protocol, and tumor markers carcinoembryonic antigen (CEA) and CA19-9 were examined every 3 months. Chest X-ray and abdominal/pelvic CT scan were performed every 6 months. Gastroscopy was also required each year. Positron emission tomography (PET) scan was suggested when recurrence was suspected. The frequency of follow-up is trimonthly in the first 2 years and every 6 months after 2 years.
The protocol was approved by Chinese Ethics Committee of Registering Clinical Trials, ChiECRCT, and Independent Institutional Review Board (IRB) of Jinling Hospital.
Collection of peripheral blood and flow cytometry
Venous blood samples (20 mL) were drawn into heparinized tubes from patients pre- and post-chemotherapy. Peripheral blood mononuclear cells (PBMCs) were separated by Ficoll-Hypaque centrifugation. The PBMCs were then placed in RPMI 1640 with 10% fetal bovine serum under sterile conditions and analyzed by flow cytometry.
Cells were stained with fluorescein-labeled monoclonal antibodies: CD3-allophycocyanin (APC), CD4-fluorescein isothiocyanate (FITC), and CD8-phycoerythrin (PE; BD Pharmingen, San Diego, CA, USA). Isotype-matched antibodies were used as negative controls. The cells were run on a FACSCalibur cytometer (BD Biosciences, San Jose, CA, USA), and 10,000 events were analyzed using CellQuest software (BD Biosciences). The absolute specific cell populations were calculated by multiplying the respective percentages by the whole number of lymphocytes. Relative proportions of circulating Treg cells were analyzed using EITC-labeled CD4, PerCP-labeled CD25, and PE-labeled Foxp3 antibodies. Intracellular staining for Foxp3 was performed according to the manufacturer’s protocol (eBioscience, San Diego, CA, USA).
Statistical analysis
Statistical analyses were performed using SPSS version 19.0 (SPSS Inc., Chicago, IL, USA) and GraphPad Prism version 6.0 (GraphPad software Inc., San Diego, CA, USA). The differences between categorical variables were assessed by Fisher’s exact test. OS was calculated from the date of case registered to the date of death or date last known alive. Survival curves were calculated using the Kaplan–Meier method and compared by the log-rank (Mantel–Cox) test. Hazard ratios (HRs) were determined using Cox proportional hazards regression. p values < 0.05 were considered to be significant.
Results
Patient characteristics and treatment response
Between July 2006 and July 2011, 105 patients, out of a total 885 hospitalized gastric cancer patients, were included in this study. Characteristics of the 105 patients are shown in Table 1. Mean age at the time of diagnosis was 62 years and 67.6% were male. Patients were clinical TNM stage IIIB (61.9%) and stage IIIC (38.1%). All patients completed two cycles of neoadjuvant chemotherapy, and the clinical overall response rate of primary tumor was 78.1%, including 7 cases of CR (complete response), 75 cases of PR (partial response), 11 cases (10.5%) of SD (stable disease), and 12 cases (11.4%) of PD (progressive disease). There were no treatment-related deaths. The most frequent toxicities were nausea, vomiting, and diarrhea. Among the hematological adverse events, 15.2% of patients experienced grade 3–4 anemia and leukopenia. No abnormal results for liver or renal function tests were observed in grade 3–4.
Patient characteristics.

A total of 78 patients (74.3%) underwent surgery, including 59 cases of D2 gastrectomy and 19 cases of D2+ gastrectomy. In all, 67 patients achieved R0 resection (85.9%). All patients were assessable for pathologic response: 19 cases of Grade 1 (24.4%), 50 cases of Grade 2 (64.1%), and 9 cases of Grade 3 (11.5%). All patients recovered and were discharged.
Changes of the immune T cells in peripheral blood after neoadjuvant chemotherapy
The flow cytometry data for 105 patients before and after chemotherapy are summarized in Table 2. Representative flow cytometric analysis is shown in Figure 1. The proportion of CD3+CD8+ T cells was significantly increased before and after chemotherapy (pre-chemotherapy 22.56% ± 8.28%, post-chemotherapy 24.67% ± 9.07%; p = 0.003). The proportion of CD3+CD4+CD25+CD4+CD25+Foxp3+ T cells also decreased significantly (pre-chemotherapy 8.32% ± 3.92%, post-chemotherapy 5.81% ± 2.54%; p < 0.01). The CD3+ T cells and CD3+CD4+ T cells did not change significantly after chemotherapy (p = 0.295 and p = 0.851, respectively).
Lymphocyte populations in the peripheral blood before and after administration of chemotherapy.

SD: standard deviation; CI: confidence interval.
Bold values represents the significant results.

Representative flow cytometric analysis of CD3+, CD3+CD4+, CD3+CD8+, and CD4+CD25+Foxp3+ T cells.
Relationship between T cell population and clinicopathologic characteristics
The relationship between T cell counts and patient clinicopathologic characteristics is shown in Table 3. T cell expression was defined as “low” and “high” by the median value of T cell counts shown in Table 2 pre-chemotherapy. As we can see, there was no significant relationship between T cells expression and clinicopathologic parameters except the tumor histological subtypes (p = 0.036). Moreover, we assessed the correlation between the clinical response to chemotherapy and changes in T cells with regard to RECIST. CD3+CD8+ and CD4+CD25+Foxp3+ significantly correlated with the chemotherapeutic response (p = 0.017 and p = 0.030), whereas neither CD3+ nor CD3+CD4+ showed significant correlations (p = 0.058 and p = 0.346).
Relationship between T cell counts and patient clinicopathologic characteristics.

CR: complete response; PR: partial response; SD: stable disease; PD: progressive disease.
The median value of T cell counts in Table 2 pre-chemotherapy was used as a cutoff point to separate the patient into high or low groups; significant results have been marked in bold.
Correlation between T cell population and OS
With a median follow-up of 15.0 months (range, 5–84 months), OS at 3 years was 31.7% for the entire cohort. In univariate analysis, patients with high CD3+CD8+ had a significantly superior OS (high CD3+CD8+ vs low CD3+CD8+: median survival 22 vs 13.5 months; p = 0.006). Similarly, low CD4+CD25+Foxp3+ correlated with better outcome (high CD4+CD25+Foxp3+ vs low CD4+CD25+Foxp3+: median survival 15 vs 22 months; p = 0.048) (Figure 2(c) and (d)). Meanwhile, neither CD3+ nor CD3+CD4+ was significantly associated with OS (Figure 2(a) and (b)).
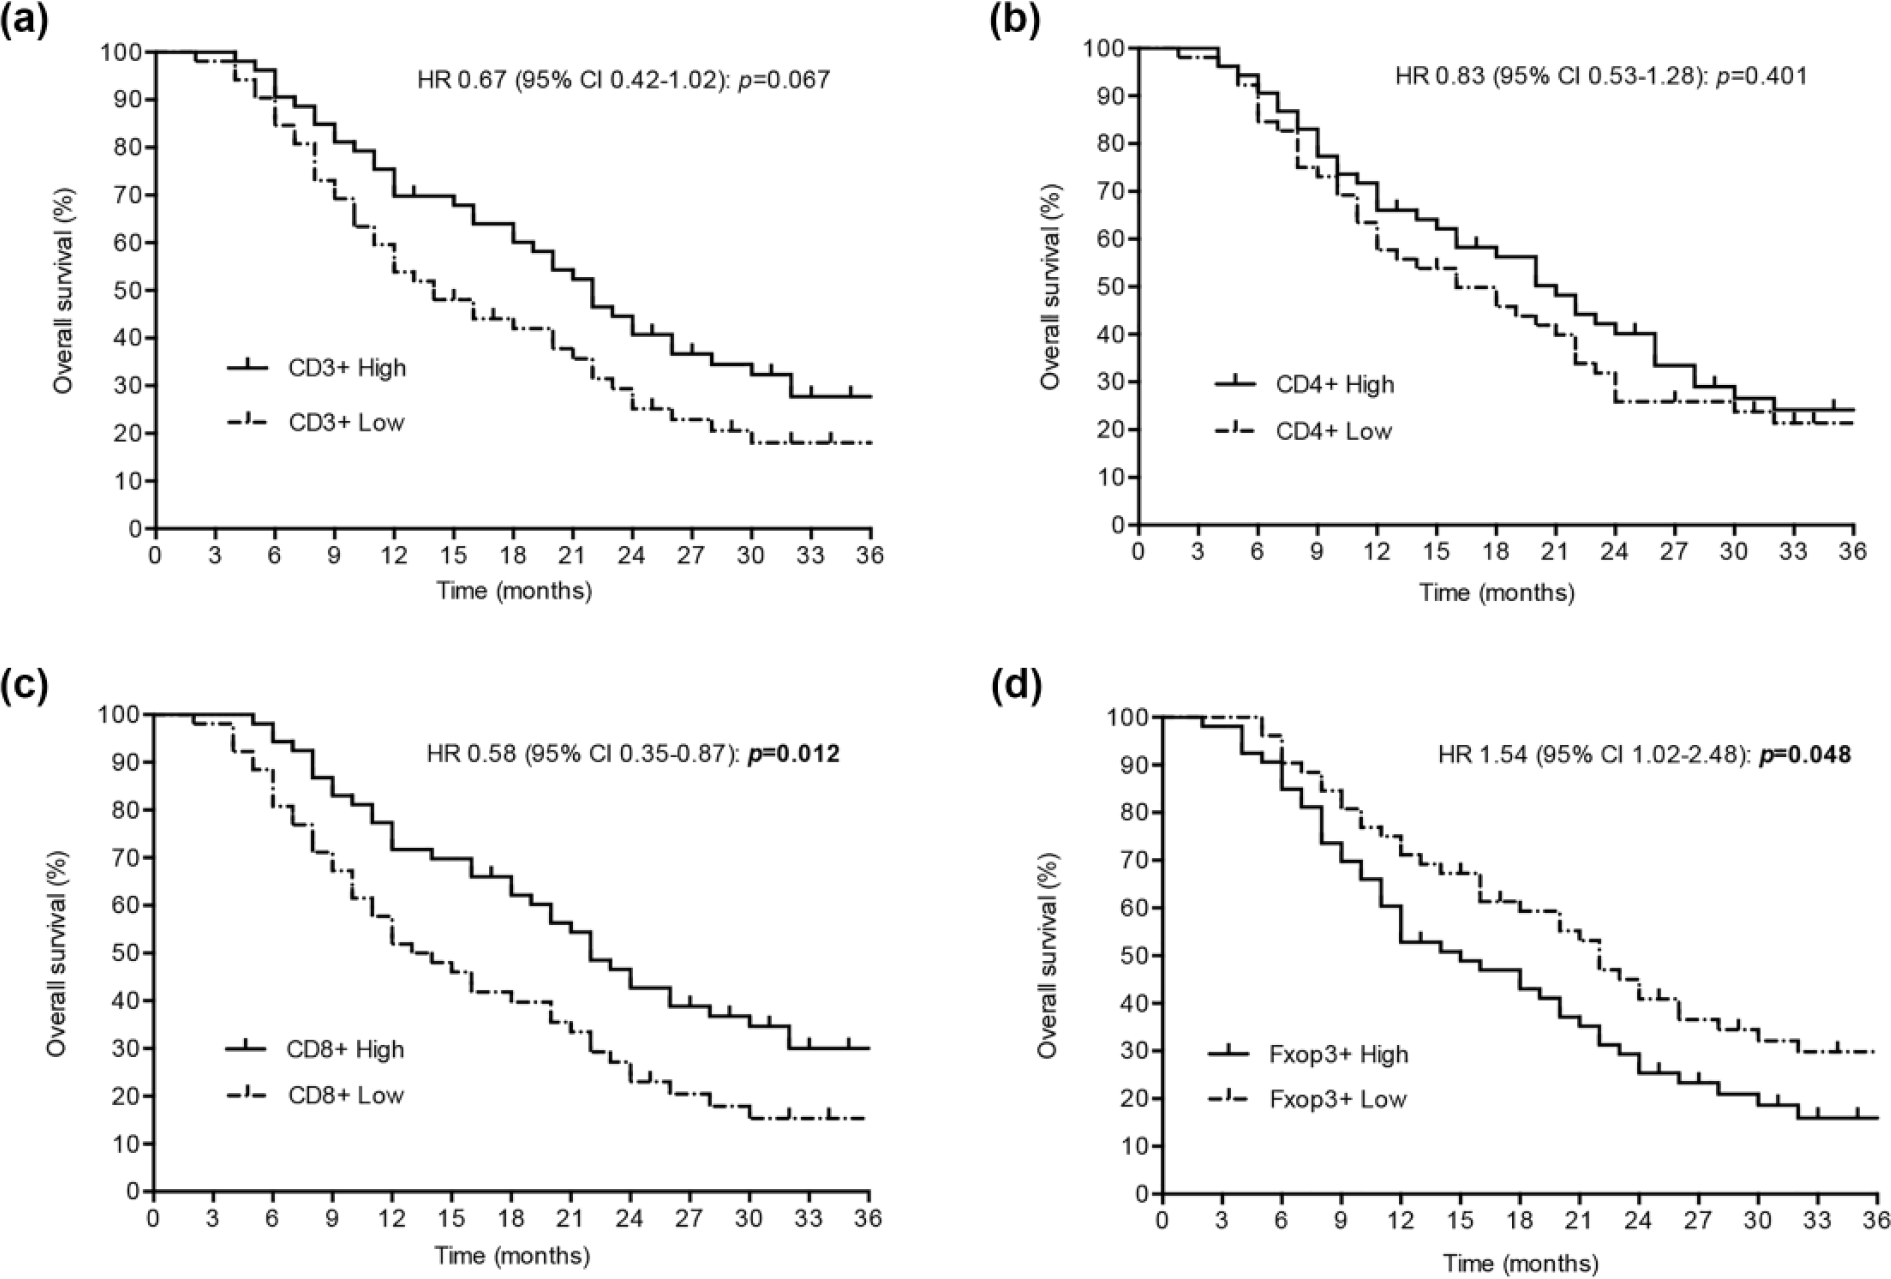
Prognostic role of (a) CD3+ T cells, (b) CD3+CD4+ T cells, (c) CD3+CD8+ T cells, and (d) CD4+CD25+Foxp3+ Tregs in the outcome (OS) of patients with advanced gastric cancer after neoadjuvant chemotherapy (the cutoff score was based on the median value).
Discussion
This study investigated the association between the status of the blood immune system in patients with advanced gastric cancer who received neoadjuvant chemotherapy and their clinical outcome. We showed that neoadjuvant chemotherapy influences the immune response, including stimulation of CD3+CD8+ lymphocytes and a decrease of CD4+CD25+Foxp3+ cells. We demonstrated the correlation between chemotherapeutic response according to RECIST and patients with high CD3+CD8+ cells or low Tregs. Meanwhile, OS was significantly improved in patients with high CD3+CD8+ lymphocytes and low Tregs. Therefore, the increase of OS in patients receiving neoadjuvant chemotherapy could partly be due to an improved immune response.
It is believed that cancer cells escape from anti-tumor immunity and impaired immunity is common in cancer patients, which has been considered to be induced by deletion of high-avidity tumor antigen–specific T cells, accumulation and expansion of myeloid-derived suppressor cells and Tregs, increased secretion of interleukin (IL)-10 and transforming growth factor beta (TGF-β), expression of a broad array of negative costimulatory molecules, loss of antigen-presenting ability, and so on.17–21 Indeed, a number of studies examining the immune status and prognosis of patients with cancers have reported that there is a reduction in the number of peripheral blood T lymphocytes, and T cell subsets have been reported as useful clinical indicators of immunosuppression.22,23 CD3+CD8+ cytotoxic T lymphocytes (CTLs) have a key role in immune defense, and a favorable outcome has been demonstrated in patients with breast, colorectal, ovarian, renal, and lung cancer, and high CD3+CD8+ cells, which is consistent with our observation. Previous studies reported that the absolute number and percentage of CD3+ and CD3+CD4+ T cells in peripheral blood from the advanced gastric cancer patients were significantly lower than those from normal healthy controls.24,25 CD3+CD4+ T cells generate effective anti-tumor immune responses by promoting proliferation of CD3+CD8+ CTLs; however, we failed to detect a significant association between either CD3+ or CD3+CD4+ T cell population and chemotherapeutic response or clinical outcome in this study. This suggests the pathway how chemotherapy can influence the immune response and then patient outcome may involve cytotoxic T cells and Tregs.
Effects of chemotherapy on lymphocyte subsets have been of considerable interest because of the possibility that chemotherapy-induced changes in the immune cells might interfere with anti-tumor activity. Cancer chemotherapy is historically regarded as detrimental to immunity because of its myelosuppressive effects. However, many researchers reported that some chemotherapy can actually enhance the host anti-tumor immunity.26,27 This study is a supplement to the limited data that are available for patients with advanced gastric cancer. In theory, chemotherapy-induced transient lymphopenia can stimulate the production of more tumor-specific T cells, thereby eradicating inhibiting regulatory T cells, which result in an increased CD3+CD8+ T cells tumor homeostasis and activity.28,29 Indeed, attention has focused on Tregs, a subset of CD3+CD4+ T cells responsible for mediating suppression of anti-tumor immune responses recently. The presence and accumulation of Tregs in the peripheral circulation and at tumor sites of cancer patients have been widely reported.30,31 Studies also indicate that the Tregs frequency tends to decrease after chemotherapy. 32 Our data support the hypothesis that response to chemotherapy is partially immune-mediated and inhibited by the presence of Tregs. This is the first clinical report that neoadjuvant chemotherapy reduces the percentage of Tregs in the peripheral blood of advanced gastric cancer patients, indicating a possibility that Tregs are more sensitive to chemotherapy than other CD3+CD4+ T cells. It may also be explained that chemotherapy inhibits the accumulation of myeloid-derived suppressor cells, which possess an ability to induce Tregs. 20
The development of chemotherapy stimulated the search for biomarkers in order to identify and characterize potential subgroups of gastric cancer patients particularly benefitting from the therapy. Recently, tumor-infiltrating immune cells (TILs) were assessed in Epstein–Barr virus (EBV)-associated gastric cancer and an association between a high percentage of TILs and longer disease-free survival was demonstrated. 33 Other authors reported that increased intratumoral tumor necrosis factor alpha (TNF-α) concentration, which may predict the activity of tumor-specific CTLs, is considered as a new prognostic biomarker. 34 The list goes on. Similarly, in this study, response to chemotherapy and the prognosis seem to be closely linked with CD3+CD8+ lymphocytes and Tregs in peripheral blood, which suggests CD8 and Foxp3 might be useful as predictive biomarkers for gastric cancers.
We acknowledge that the retrospective evaluation of the immune cell population is a limitation of our study, and potential calculation bias cannot be excluded. Our observations warrant validation in large, independent cohorts.
Conclusion
In summary, we show that high CD3+CD8+ T cells and low CD4+CD25+Foxp3+ Tregs in peripheral blood are associated with chemotherapeutic response and improved long-term outcome in advanced gastric cancer, which may be considered as new prognostic biomarkers.
Footnotes
Acknowledgements
This study is registered with the Chinese Clinical Trials Registry, ChiCTR-TRC-12002046. G.L. and C.F. contributed to the design and execution of the study. X.J., L.M., and Y.L. accrued patients and collected clinical data and specimens. Q.H. and X.W. carried out the experiments. Q.H. and C.F. provided the administrative support and analyzed the data and drafted the manuscript. All authors read and approved the final manuscript.
Declaration of conflicting interests
The author(s) declared no potential conflicts of interest with respect to the research, authorship, and/or publication of this article.
Ethical approval
All procedures followed were in accordance with the ethical standards of the responsible committee on human experimentation (institutional and national) and with the Declaration of Helsinki of 1964 and later versions. Informed consent or a substitute for it was obtained from all patients before they were included in the study.
Funding
The author(s) received no financial support for the research, authorship, and/or publication of this article.