
Abstract
With the advance of digital pathology, image analysis has begun to show its advantages in information analysis of hematoxylin and eosin histopathology images. Generally, histological features in hematoxylin and eosin images are measured to evaluate tumor grade and prognosis for breast cancer. This review summarized recent works in image analysis of hematoxylin and eosin histopathology images for breast cancer prognosis. First, prognostic factors for breast cancer based on hematoxylin and eosin histopathology images were summarized. Then, usual procedures of image analysis for breast cancer prognosis were systematically reviewed, including image acquisition, image preprocessing, image detection and segmentation, and feature extraction. Finally, the prognostic value of image features and image feature–based prognostic models was evaluated. Moreover, we discussed the issues of current analysis, and some directions for future research.
Keywords
Introduction
The advent of whole slide image (WSI) scanners is expected to drive a revolution over the traditional ways of pathological diagnosis. 1 The WSI scanner can acquire and store analog glass tissue slides in digital image form, and thus, it greatly promotes the implementation of image analysis in pathology. Image analysis that interprets pathology images via computerized techniques is becoming a powerful tool for exploring a wide variety of pathology problems.2,3 Studies have demonstrated that such tools have potential to tackle the inherent subjectivity in manual analysis and to largely reduce the workload of pathologists via high-throughput analysis.2,4,5
Hematoxylin and eosin (H&E) staining remains the most important and fundamental method for tumor histological examination in pathology. 6 Unfortunately, manual analysis of H&E images has remained an experience-based qualitative assessment for over 100 years. 4 Manual analysis always causes intra- or inter-observers variation even for experienced pathologists, 7 which ultimately results in an inaccurate evaluation. Thus, there is just an urgent demand for developing automated image analysis tools to help pathologists make faster and more accurate assessment. 1 Numerous image analysis software have been proposed to help pathologists quantify immunohistochemistry (IHC) images8,9 and fluorescent images. 10 As morphological features in H&E images are far more complex than those in IHC images, analysis for H&E images is more challenging and it is still in the exploratory stage in clinical pathology application.
Breast cancer (BC) is the most common female cancer worldwide. 11 Histological features in H&E images are measured to evaluate tumor grade and prognosis for BC. Recently, various image analysis approaches have been developed to help pathologists quantify morphological features, 12 detect malignant lesions,13,14 and predict prognosis15–18 for BC. In this article, we summarized recent works in image analysis of H&E histopathology images for BC prognosis.
The rest of this article is structured as follows. First, the significances and limitations of routine prognostic prediction based on H&E histopathology images for BC were briefly discussed. Second, usual procedures of image analysis for BC prognosis were systematically reviewed, including image acquisition, image preprocessing, image detection and segmentation, and feature extraction. Third, computer-aided prognosis for BC based on image features was evaluated. Finally, concluding remarks are presented.
Routine prognostic prediction based on H&E histopathology images for BC
BC is a highly heterogeneous disease with apparently distinct phenotypes and behaviors. 19 For better individual therapy, clinical management of BC largely depends on a variety of predictive and prognostic factors, 20 ranging from clinical data, histological features, to molecular biomarkers. 21 Over the past decade, molecular taxonomy has revealed molecular heterogeneity of BC and has been shown to provide more accurate prognostic information.22–24 But the actual role of molecular techniques in clinical practice is limited by their availability. 20 Thus, BC management relies largely on inexpensive and routine morphological assessment of H&E images coupled with biomarker semi-quantification of IHC images. 25
Histological features that are used to measure tissue architecture and cell morphology in H&E images are key to disease prognosis.26,27 For example, histological grade that evaluate differentiation degree has long been an independent prognostic factor for BC. 28 The Nottingham grading system (NGS) is recommended by the World Health Organization to obtain histological grade score. 29 The NGS is a combination of semi-quantitative assessment of tubule formation, nuclear pleomorphism, and mitotic counts. The process of grading is a time-consuming and subjective manual work, and it is easy to cause observer variations that result in inaccurate prognostic evaluation and suboptimal treatment, especially for the intermediate risk subgroup. 30 Thus, there is a growing demand for developing an efficient, objective, and quantitative grading system.
It has been increasingly realized that tumor microenvironment plays an important role in tumor biology behavior via the co-evolution between the tumor cells and the stromal components.31,32 Tumor microenvironment has sustainable impacts on tumor cell proliferation, invasion, and metastasis, and ultimately, it leads to morphological changes in histopathology images. 33 For example, immune cell infiltration within tumor stroma has distinct prognosis, 34 lymphovascular invasion is an adverse prognostic factor for BC, 35 and cancer-associated fibroblasts (CAFs) promote BC progress by inducing epithelial-to-mesenchymal transition. 36 Therefore, an improved comprehensive prognostic system should take account of the malignant epithelium features and the tumor microenvironment features.
General procedures of image analysis for BC prognosis
Image acquisition
Image acquisition is the prerequisite in image analysis. Traditional acquisition system is a microscope-mounted digital camera that captures individual field images. Currently, a WSI scanner can scan through an entire tissue slice to obtain a high-resolution WSI for pathology archiving, education, and image analysis. 1 Researches showed that WSIs and conventional microscopy images have similar precision, accuracy, and reproducibility for analyzing H&E slices of breast tissue.37,38 However, WSIs are not only very large in size but also contain huge information, such as different tissue architecture, a great number of cells, and different types of cells. 39 Processing or analyzing WSIs manually is labor-intensive and has difficulties in capturing biologically relevant features from mass information. 40 Thus, there are compelling reasons to find automated, efficient, and high-throughput ways to analyze digital pathological images. 41 Image analysis can quantify pathological features on H&E histopathology images after individual cell nuclei and tissue structures are detected and segmented.
Computerized image analysis
BC cell detection and segmentation were taken as examples to show major steps of computerized image analysis (Figure 1). It consists of preprocessing image to standardize the images from different sample sites, identifying regions of interest (ROIs) from WSIs, detecting and segmenting objects of interest from ROIs, and extracting features to describe objects and predict prognosis.

The flowchart of computerized image analysis for prognosis based on H&E histopathology images. The system (a) acquires a digitized image via microscope-mounted digital camera or whole slide image scanner, (b1) preprocesses the image via color normalized and automatically detects the region of interest (ROI), (b2) automatically detects and segments the objects, (b3) extracts pixel-level, object-level, and spatial-arrangement-level features based on the segmentation results, and (c) builds the computer-aided prognosis (CAP) system on top of these features.
Image preprocessing
Variations of image quality can significantly affect the subsequent image segmentation and feature extraction. These variations are caused by many factors, including the innate BC heterogeneity19,27 and inconsistent conditions during tissue slices preparation or images acquisition. Appropriate preprocessing methods could reduce variations to some degree, 42 such as color normalization to minimize staining variations, 43 spatial filtering to highlight major image structure, denoising to reduce image noise, and enhancement to optimize contrast between objects of interest and background. 5 Moreover, intensity centering and histogram equalization were presented particularly to normalize a diverse set of pathology images. Figure 2 presents the results of color normalization after applying Reinhard’s method. 44

The example of image preprocessing result with color standardization: (a)–(c) original images with notable difference in the staining appearance; (d)–(f) the respective three images after color standardization.
The detection of ROIs
Detecting ROIs in images is the first step toward the next objects segmentation and feature extraction.45,46 Generally, in a routine pathological workflow, pathologists first scan through histopathological atypia in tissue slice under low magnification to locate lesion areas (i.e. ROI). Then, the pathological features of objects are carefully read by focusing on high magnification to evaluate the extent of BC. By training sample images with pathologists’ annotation, image analysis algorithms learn to identify and detect ROIs automatically. Numerous algorithms have been proposed to detect and segment cells,47,48 mitosis,49,50 and tissue architecture51,52 in histopathology images.
Cells detection and segmentation
Automated detection and segmentation of cells from images are the crucial and fundamental steps for the measurement of cellular morphology that is crucial for BC diagnosis and prognosis.19,53 Cell detection and segmentation usually base on the nucleus features that are distinct among different types of cells. For example, cancer cells have significant pleomorphic nuclei with irregular chromatin distribution (Figuere 3(a)–(c)), immune cells have small dark round nuclei (Figure 3(d)–(f)), and CAFs have spindle or string-like nuclei embedded in collagen-rich extracellular matrix (Figure 3(e)). In addition, adipocytes have many lipids that appear as empty spaces, which is useful to detection and segmentation (Figure 3(f)).

Examples of different nuclei or cells in breast cancer H&E histopathology images: (a) nuclei have regular size and uniform nuclear chromatin; (b) large vesicular nuclei with visible nucleoli (red arrows); (c) nuclei are very large, and bizarre nuclei are present (red arrows); (d) immune cells (red circles); (e) tumor stromal regions (yellow wireframe), and cancer-associated fibroblasts (red arrows); (f) adipocytes, a lumen-like structure present among cancerous tissue (red arrows); (g) mitosis with hairy protrusions around the edge (red circle); (h) and (i) bipolar-like mitosis (red circles at top left), and irregular mitosis (green circles at lower right corner).
Recently, various nuclei detection and segmentation approaches have been put forward for H&E histopathology images of BC (Table 1). Nuclei detection algorithms consist of voting-based, 54 Laplacian of Gaussian (LoG)-filter based, 55 intensity-based, 56 mathematical morphology–based,57,58 H-minima transform–based, 59 watershed-based,60–62 gradient-based, 58 color-based, 63 region growth and Markov random field (MRF), 64 Gaussian mixture model, 65 and deep learning 41 approaches. Although those methods show efficiency in nuclei detection, finding proper seed points or deciding initial contours is still very challenging for H&E images. False or missing detection of nuclei regions will be propagated to the segmentation phase, which causes inaccurate segmentation results. In the segmentation phase, active contour model and level set were the most popular models employed.61,65–67 Other segmentation methods that have so far been proposed for H&E images include relatively simple methods like threshold 46 and clustering, 68 complex energy-based methods like graph cuts, 55 region- and contour-based methods like watershed (Figure 4),48,69 more complex theory-based methods like neural network, 70 and so on.
Nuclei detection and segmentation approaches for H&E histopathology images of breast cancer.

EM: expectation maximization; ACM: active contour model.
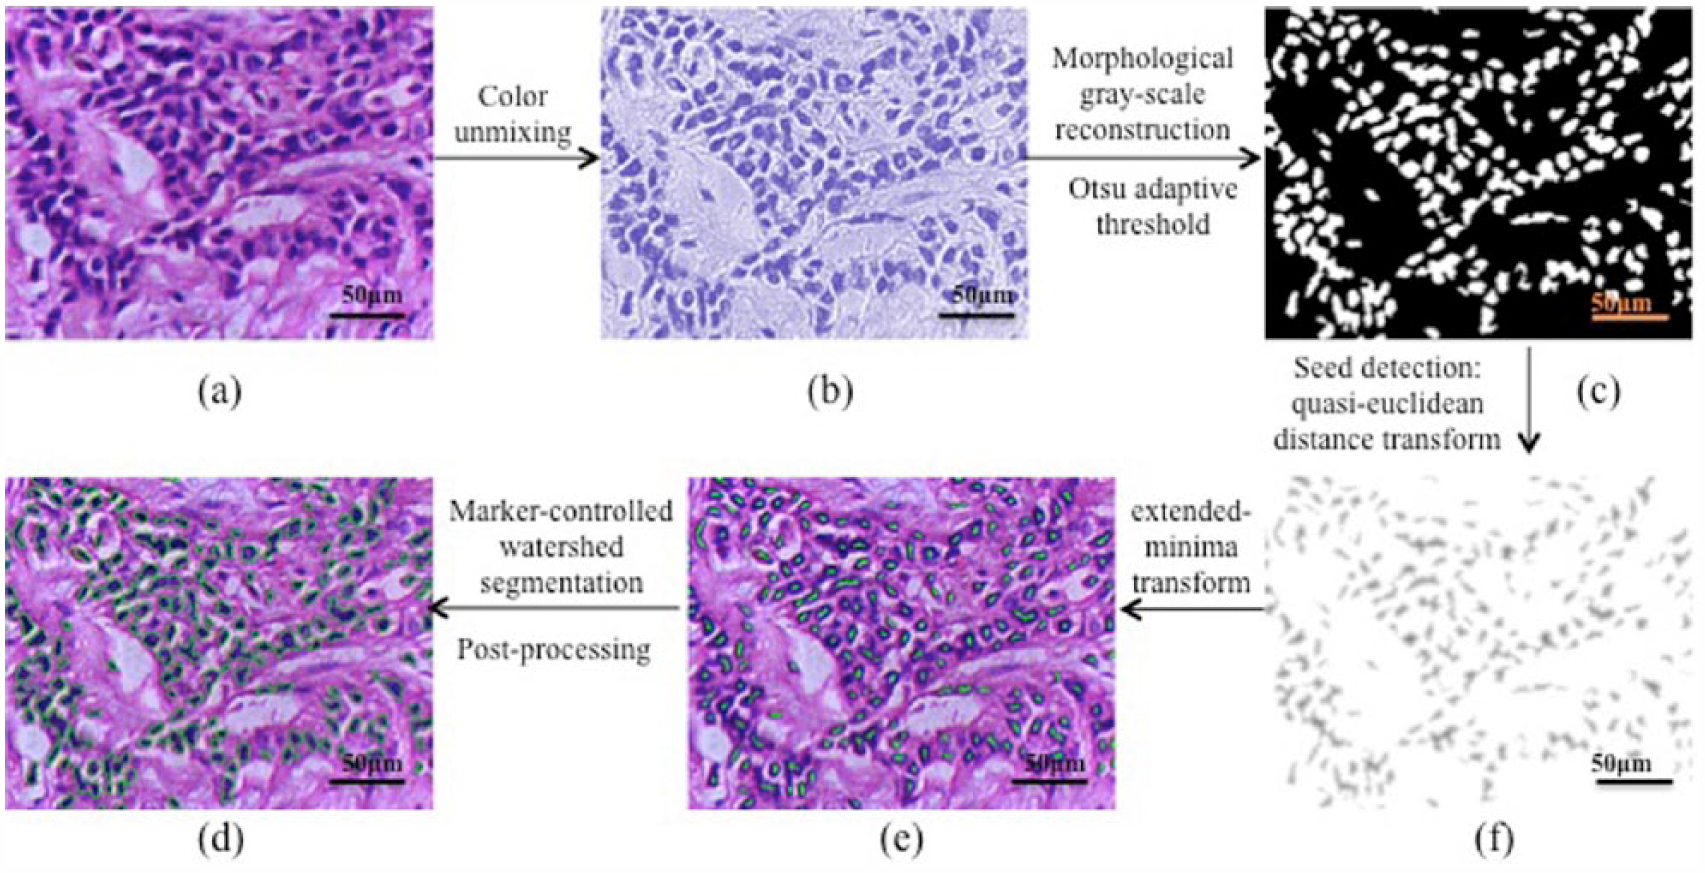
Nuclei segmentation based on a marker-controlled watershed algorithm: (a) original H&E image; (b) hematoxylin color component by applying color unmixing algorithm; (c) binarization result of the image; (d) quasi-Euclidean distance transform; (e) nuclei markers obtained by the extended-minima transform; and (f) final segment result.
Furthermore, different types of cells in H&E histopathology images of BC should be distinguished in the segmentation phase. For example, a minimum-model that bases on global contour search with local gradient information could distinguish normal nuclei from cancerous nuclei. 74 In addition, a number of approaches were proposed to distinguish lymphocyte nuclei from other cells, such as expectation-maximization-driven geodesic active contour, 65 region growing combined with MRF, 64 and support vector machine (SVM) classifier.75,76
Although those detection and segmentation algorithms obtained satisfactory results, separating overlapped nuclei remains challenging. 47 Methods like shape-based active contour model, 61 marked point process, 77 level set, 67 and unsupervised Bayesian classifier 78 have been adopted to separate overlapped nuclei. However, some methods like marker-controlled watershed may result in over-segmentation when dealt with overlap.
Mitosis detection
Detecting and counting mitosis is the most commonly used method to assess breast tumor proliferative activity in clinical pathology. 79 It is generally known that manual mitotic count (Figure 3(g)–(i)) is a notoriously subjective and tedious work. Automated mitosis detection may provide potential solutions to relieve pathologists’ workload. 49 Early detection methods are constrained because of lacking available image datasets. 80 Recently, two grand challenges on mitosis detection that were held during ICPR2012 and MICCAI2013 conferences achieved satisfactory results.49,50 In the latest challenge, 11 new methods were evaluated, 49 among which deep neural networks 72 showed the best performance. Studies 81 showed that the performance of deep neural networks could be comparable to that of manual detection by experienced pathologists.
Despite all this, automated mitosis detection is extremely difficult because mitoses have a similar appearance to many other kinds of nuclei, such as necrotic nuclei, apoptotic nuclei, and compressed nuclei. Moreover, performance of mitosis detection largely relies on image quality and pathologist annotation. However, digital images are obtained at single focal plane 82 rather than the fine focus of microscope which can provide more detailed examination to distinguish mitoses from other similar objects.
Glandular tubule segmentation
The carcinogenic process that disrupts the ability of epithelia to connect with one another results in disturbed tubule formation with irregular shape and size, which indicate the differentiation degree of BC. Apart from complex components of the tubule, there are other lumen-like structures, such as adipose tissue or cavity gap in tissue slice, which makes tubule segmentation extremely challenging. 83 Several algorithms have been proposed to segment tubules in BC H&E images. However, a morphological operation that proposed earlier time 84 showed false-positive results. Adipose tissue was also regarded as a tubule in that research, whereas Naik et al. 85 first identified lumen, epithelial cytoplasm, and nuclei using a Bayesian classifier. Then, false lumen regions were removed by using a level-set function that bases on area and gland boundaries. Moreover, Nguyen and Srinivas 86 detected tumor nuclei and true lumen via a random forest classifier and classified tubules via graph-cuts algorithm. In addition, the O’Callaghan neighborhoods adopted by Basavanhally et al. 51 can distinguish tubules from lumen-like structures with low errors.
Feature extraction
After image segmentation, feature extraction is subsequently performed to encode morphological parameters of the image into a set of features. Usually, pathologists adopt a multi-resolution approach to reading different tissue structures in images. Accordingly, three levels of features, including pixel level, object level, and spatial-arrangement level, are generated to optimally describe tissue morphology5,39 (Table 2).
Features used in image analysis for H&E histopathology image of breast cancer.
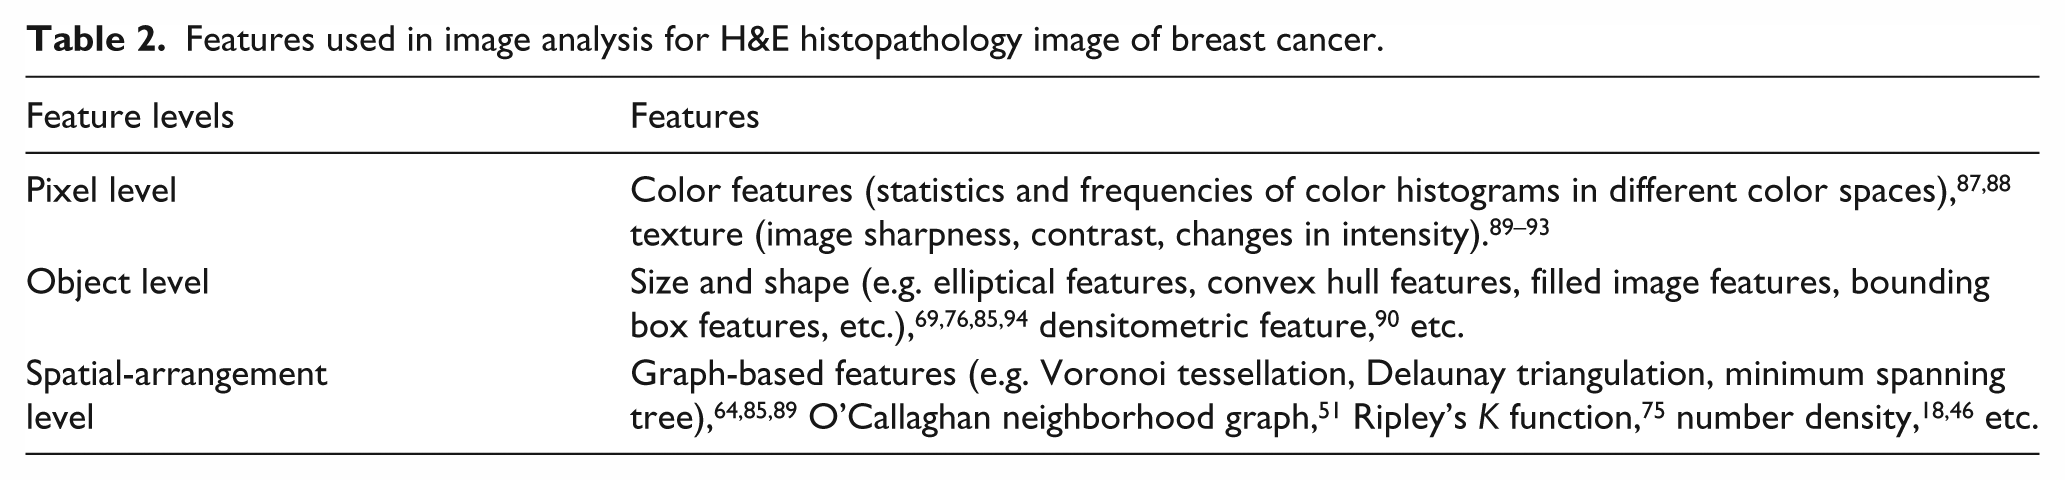
Pixel-level features that capture properties in pixel classification (Figure 5(b)), such as color features and texture features, are the least interpretable in terms of current pathological knowledge. Color features are widely used for mitosis segmentation because hyperchromicity is the remarkable characteristic of mitotic nuclei. 91 In higher resolution, object-level features can describe morphological characteristics of individual microstructure, and most of them have correlation with pathologic information. For instance, size and shape features (Figure 5(c)) can be utilized to quantify nuclei pleomorphism. 69 Spatial-arrangement-level features can describe biological domain-specific information between cells that are inextricably linked up with one another in histopathology images. For example, Voronoi diagram (Figure 5(d) and (g)), minimum spanning tree (Figure 5(e) and (h)), and Delaunay triangulation (Figure 5(f) and (i)) were used to grade the lymphocyte infiltration. 64

Examples of features extracted from breast cancer H&E histopathology images: (a) original images acquired at 200× magnification; (b) texture features (200×); (c) nuclei shape features (400×); (d), (g) Voronoi diagram; (e) and (h) minimum spanning tree; and (f) and (i) delaunay triangulation. (a) Second row shows the graphs over the yellow region of H&E images, and (d)–(f) third row details only the graphs.
To derive information from images as more as possible, a huge number of features need to be extracted. However, a mass of data would hamper feasible analysis, and thus, feature dimensionality reduction methods are usually used to identify the most valuable features.95,96
Computer-aided prognosis for BC
Features extracted above could not only quantify malignant epithelium morphologies but also excavate information from tumor microenvironment. Then the prognostic value of image features is evaluated, which is followed by building of prognostic models that consist of independent prognostic features.
Quantify epithelial features on prognosis
Epithelial features that extracted to describe BC cells and glandular tubules are important prognostic factors. There exist numerous studies demonstrating that cell nuclear features are capable of quantifying nuclei pleomorphism. For examples, shape features could measure deviation in nuclei appearance, 94 and the mean nuclear area was an independent prognostic factor for male BC. 69 Texture features could describe the variation in chromatin distribution, which is generally more heterogeneous in higher grade BC cells. 89 And nuclear densitometric features were significantly associated with nuclear grading. 90
In addition, the spatial arrangement of cell nuclei is important in distinguishing between differentiation degrees. Basavanhally et al. 89 presented a multi-field-of-view method to integrate nuclear texture feature and spatial-arrangement feature for grading. This method was able to discriminate low-, medium-, and high-grade estrogen receptor (ER)-positive BC. Moreover, nuclear features integrated with glandular tube features could provide a more accurate grading for BC. For example, Petushi et al. 46 integrated the number density of cells with dispersed chromatin in the nuclei with the number density of tubules to classify BC into three degrees. Naik et al. 85 used a SVM classifier that bases on nuclei spatial-arrangement features and tubule shape features to distinguish between high- and low-grade BC with high accuracy.
Further integrating all the three components of NGS could provide a quantitative grading system (Figure 6). Tutac et al. 97 first presented a knowledge-guided, semi-automatic grading system for BC. This grading system transformed tubule formation, nuclear pleomorphism, and mitosis count into computer vision concepts, namely, image features. Based on a multi-resolution method and Gaussian model functions, Dalle et al. 84 developed an automatic grading system that obtained tubule formation score from low-resolution images, nuclear pleomorphism and mitosis count from high-resolution images, and the results well matched those obtained via manual evaluation.

The illustration of a pathologic domain knowledge–guided workflow for computer-aided prognosis based on the Nottingham grading system. First, detect epithelial cell nuclei and mitosis in the high-resolution image and tubule in the low-resolution image. Second, segment objects and extract respective features to quantitatively describe these objects. Finally, nuclei features, mitosis count, and tubule features are integrated for breast cancer grading.
Quantify stromal features on prognosis
Stromal features could excavate prognostic information from tumor microenvironment. An SVM classifier that bases on Voronoi tessellation, Delaunay triangulation, and minimum spanning tree features was utilized to discriminate low and high lymphocytic infiltration (LI) for Her2-positive BC. 64 Yuan et al. 75 quantified LI in H&E histopathology images from ER-negative BC. Their results revealed that the image analysis–based LI score had consistent prognostic values comparable to the manual analysis–based LI score. Then, they subsequently combined image analysis and statistical modeling to quantify the intra-tumor lymphocyte ratio for triple negative breast cancer (TNBC), and image-based measurements had comparable performance to some gene expression signatures of LI. 76 Apart from LI, immune cells spatial heterogeneity also provides prognostic information. Nawaz et al. 98 adopted a spatial statistics approach to quantify spatial heterogeneity of lymphocytes in H&E histopathology images from ER-negative BC. Their results showed that the number of co-localized cancer cells and immune cells, rather than the number of either cancer cells or immune cells, related to a better prognosis.
What’s more, a computational pathologist system designed by Beck et al. 15 had extracted a vast number of morphological features from BC H&E images. To our surprise, their results showed that three stromal features were significantly associated with BC patient survival, and this association was even stronger than that of epithelial features. Stromal cell structure feature has also been proved to be an independent prognostic factor for invasive ductal carcinoma of the breast, which is the major type of BC. 18 Other stromal features like the spatial distribution of stromal cells quantified by Ripley’s K function have significant prognostic value for ER-negative BC. 75
Building new prognostic models
Generally, it is multiple factors, rather than a single factor, that provide adequate information for the pathologist to estimate BC prognosis. Thus, multivariable analyses are often used to design prognostic models so as to facilitate decision-making in clinical practice. 99 For example, an image features–based prognostic model built by Beck et al. 15 had a significant association with BC survival, and the association was independent of other clinicopathological factors.
Furthermore, morphometry could complement molecular tests because morphological characteristics are usually linked to underlying molecular mechanisms. For example, a multi-field-of-view framework that integrated image-based features from H&E images and IHC images could identify BC aggressiveness, and the image-based features could potentially replace the Oncotype DX risk score to predict the prognosis of ER-positive BC. 100 Similarly, BC cellular heterogeneity estimated directly from H&E images could correct copy number data derived from the molecular test. 75
In addition, it becomes generally accepted that new prognostic models should take into consideration histological features, molecular features, and clinical data of BC 16 (Figure 7). Yuan et al. 75 combined image features with gene expression information to build a prognostic model for ER-negative BC. This prognostic model had a better performance in comparison with image features or genomic information only. Wang et al. 17 developed a workflow in which morphological features and genomic data were integrated to identify biomarkers for TNBC. Their results demonstrated that 48 pairs of morphological features and gene cluster had a significant correlation, four of which were associated with survival.

The illustration of prognostic models that integrate image features and molecular features for computer-aided prognosis on breast cancer. On one hand, image analysis can quantify morphological features in H&E histopathology images to provide an objective image features–based prognostic model. On the other hand, image features combined with molecular features can provide a multiple data model to provide comprehensive information for breast cancer prognosis.
Conclusion
Image analysis has begun to show its effectiveness in digging out prognostic information from H&E histopathology images for BC in many retrospective studies. Although much progress has been made in recent years, there are still some challenges in computer-aided prognosis for BC.
First, there is a lack of representative public image datasets annotated by multiple pathologists with high quality. Annotations by multiple pathologists are necessary for training and validating algorithms in order to enhance the objectivity of algorithms for comparison. In addition, WSIs are very large in size, and thus, most studies focused on ROIs. However, manual selection of ROIs usually results in subjective outcomes. Second, most algorithms lack robustness when applied to an independent dataset for solving a particular problem, because algorithms proposed in researches so far were based on different magnification images from distinct types of BC. Therefore, an algorithm that deals with a particular pathology issue should be investigated with the corresponding type of image. Third, pathologists evaluate prognosis from images basing on specialized knowledge. Thus, there is a semantic gap between pathologic concepts and computer vision features. Analysis outcomes may improve if pathologists teach and correct systems in real time.
Although computer-aided prognosis is challenging, this high-throughput analysis may be superior to manual analysis, because it can not only reduce pathologists’ workload but also help extract comprehensive information from images. Thus, further prospective, multi-institutional studies in this field are needed to develop image analysis workflows that are suitable for clinical application.
Footnotes
Declaration of conflicting interests
The author(s) declared no potential conflicts of interest with respect to the research, authorship, and/or publication of this article.
Funding
This work was supported by the Key Project of the National Natural Science Foundation of China (81230031/H18); the Fundamental Research Funds for the Central Universities (2015303020201); the National Natural Science Foundation’s Program for New Century Excellent Talents in Universities of China (61272274) and Program for New Century Excellent Talents in Universities (NCET-10-0644); National Natural Science Foundation of China (No. 61273259); Six Major Talents Summit of Jiangsu Province (No. 2013-XXRJ-019); Natural Science Foundation of Jiangsu Province of China (No. BK20141482); and Jiangsu Innovation & Entrepreneurship Group Talents Plan (No. JS201526).