
Abstract
The objective of this study is to analyze magnetic resonance imaging shrinkage pattern of tumor regression after neoadjuvant chemotherapy and to evaluate its relationship with biological subtypes and pathological response.
We reviewed the magnetic resonance imaging studies of 51 patients with single mass-enhancing lesions (performed at time 0 and at the II and last cycles of neoadjuvant chemotherapy). Tumors were classified as Luminal A, Luminal B, HER2+, and Triple Negative based on biological and immunohistochemical analysis after core needle biopsy. We classified shrinkage pattern, based on tumor regression morphology on magnetic resonance imaging at the II cycle, as concentric, nodular, and mixed. We assigned a numeric score (0: none; 1: low; 2: medium; 3: high) to the enhancement intensity decrease. Pathological response on the surgical specimen was classified as complete (grade 5), partial (grades 4–3), and non-response (grades 1–2) according to Miller and Payne system. Fisher test was used to relate shrinkage pattern with biological subtypes and final pathological response.
Seventeen patients achieved complete response, 25 partial response, and 9 non-response. A total of 13 lesions showed nodular pattern, 20 concentric, and 18 mixed. We found an association between concentric pattern and HER2+ (p < 0.001) and mixed pattern and Luminal A lesions (p < 0.001). We observed a statistical significant correlation between concentric pattern and complete response (p < 0.001) and between mixed pattern and non-response (p = 0.005). Enhancement intensity decrease 3 was associated with complete response (p < 0.001).
Shrinkage pattern and enhancement intensity decrease may serve as early response indicators after neoadjuvant chemotherapy. Shrinkage pattern correlates with tumor biological subtypes.
Keywords
Introduction
NeoAdjuvant CHemoTherapy (NACHT) represents the standard treatment for patients with locally advanced breast cancer (LABC)1–3 in order to downstage inoperable tumors, and it is increasingly being used for operable cancers to obtain a better outcome in breast conservative surgery.4–5
The response rate after NACHT is an important overall survival indicator in LABC patients; particularly, the complete pathological response (pCR) induction is predictive to a successful long-term survival.6–7 Several studies validated the role of magnetic resonance imaging (MRI) over other diagnostic exams to assess the response rate after NACHT,8–10 and there is a great interest in evaluating whether tumor radiologic features provided by MRI (like signal intensity, tumor enhancement, and morphology) may serve as indicators of tumor response to NACHT. 11 However, few of them have been carried out to evaluate the tumor regression pattern as a possible early response predictor and, to the best of our knowledge, no study investigated its correlation with the different tumor biological subtypes.
After neoadjuvant treatment, some changes occur in the tumor bed including necrosis, fibrosis, and inflammatory reaction.12–14 These alterations have different characteristics depending on the tumor size and the cellularity degree, presenting with different tumor shrinkage patterns (SP) on MRI after treatment. 15 In addition, it is well known that breast tumors cellular and molecular heterogeneity and the large number of genes potentially involved in controlling cell growth, death, and differentiation have an influence on the response rate to NACHT and the overall final prognosis, but it is not yet clear how the different tumor biological subtypes may influence the MRI SP.16,17
The aim of this study is to analyze MRI tumor regression patterns after NACHT in a group of patients with LABC and to establish their possible correlation with the different biological tumor subtypes and their role as an early response predictor to therapy.
Materials and methods
This study was carried out reviewing our radiological database of 1100 breast MRI exams and extrapolating data of 51 patients with breast cancer who performed MRI staging between September 2013 and October 2015 at our Department of Radiological and Oncological Sciences.
Subjects were considered eligible for this study if they met the following inclusion criteria: (1) LABC at diagnosis, (2) MRI imaging with a single nodular mass-enhancing lesion, (3) at least three MRI exams (before treatment, at II cycle, and after treatment), (4) histological typing by tru-cut under ultrasound (US) guidance with the tumor biological profile (receptor status of estrogen, progesterone, HER2, and Ki67), (5) NACHT administration, (6) followed by surgery.
The study exclusion criteria were: multifocal or multicentric disease, non-mass like enhancing lesions on MRI; moreover, were ruled out patients who did not have pre- or post-treatment MRI exam, patients who did not undergo surgery on our Surgical Department, and lastly patients with an inadequate hormonal status reported by pathologic analysis.
MRI protocol
MRI has been performed using a 1.5 Tesla magnet (Magnetom Vision, Avanto Siemens Medical System, Erlangen, Germany, gradients: 25 mT/m2, slew rate: 800 T/m/s, rise time: 400 µs) with dual coil dedicated to the breast study. In premenopausal patients, we performed the examination between the seventh and the 14th menstrual cycle day.
The protocol used included pre-contrastographic sequences: T2-STIR weighted sequences in the axial plane (TR 5320/TE: 58 ms, field of view (FOV) read: 300, FOV phase: 100, slice thickness: 3.5 mm without gap) and 3D Flash NFS T1-weighted sequences in the axial plane (TR 7.73/TE: 4.76 ms, flip angle: 25, FOV read: 320, FOV phase: 100, thickness: 1 mm).
As post-contrastographic sequences, we used 3D Gradient Recalled Echo (GRE) Fat Saturation T1-weighted sequences in the axial and sagittal planes acquiring a single pre-contrast scan and other four consecutive scans after the contrast medium injection. The introduction of contrast medium was performed using an automatic injector with administration of gadobutrol at a dose of 0.1 mmol/kg of body weight with a rate of 2 ml/s together with 10 ml of saline bolus.
Imaging processing and interpretation
Two readers with, respectively, 15 and 5-years breast-imaging experience, blinded to the histological diagnosis, independently reviewed MRI exams.
Semi-quantitative analysis of the enhancing areas was performed obtaining the time-signal intensity curve (TIC) by manually placing a circular region of interest (ROI) over the more enhancing areas within the lesions during the first minutes of acquisition after contrast injection with care to exclude areas of hemorrhage and necrosis.
To assess enhancement intensity decrease (EID), we evaluated the percentage of peak enhancement (Epeak) on MRI performed both before treatment and after the II cycle after NACHT based on the analysis of TIC with a semiquantitative method by using the following equation:

where SIpeak represented the peak value of the contrast enhancement.
The EID of each lesion was classified based on Epeak reduction between the two MRI exams by using a numeric score ranging from 0 to 3 (particularly, EID 0: Epeak reduction of 0%–20%, EID 1: 20%–40%, EID 2: 40%–70%, and EID 3: 70%–100%).
Based on the response evaluation criteria in solid tumors (RECIST 1.1),18,19 we measured the longest diameters of each enhancing lesion on MRI images acquired at the beginning and at the end of NACHT and classified the response rate as complete response (CR; disappearance of all target lesions), stable disease (SD; neither sufficient shrinkage to qualify for partial response nor sufficient increase to qualify for progressive disease, taking as reference the smallest sum of tumor diameters), partial response (PR; at least a 30% decrease in the sum of target lesions diameters, taking as reference the baseline sum diameter), progressive disease (PD; at least a 20% increase in the sum of target lesions diameters, taking as reference the smallest sum on study).
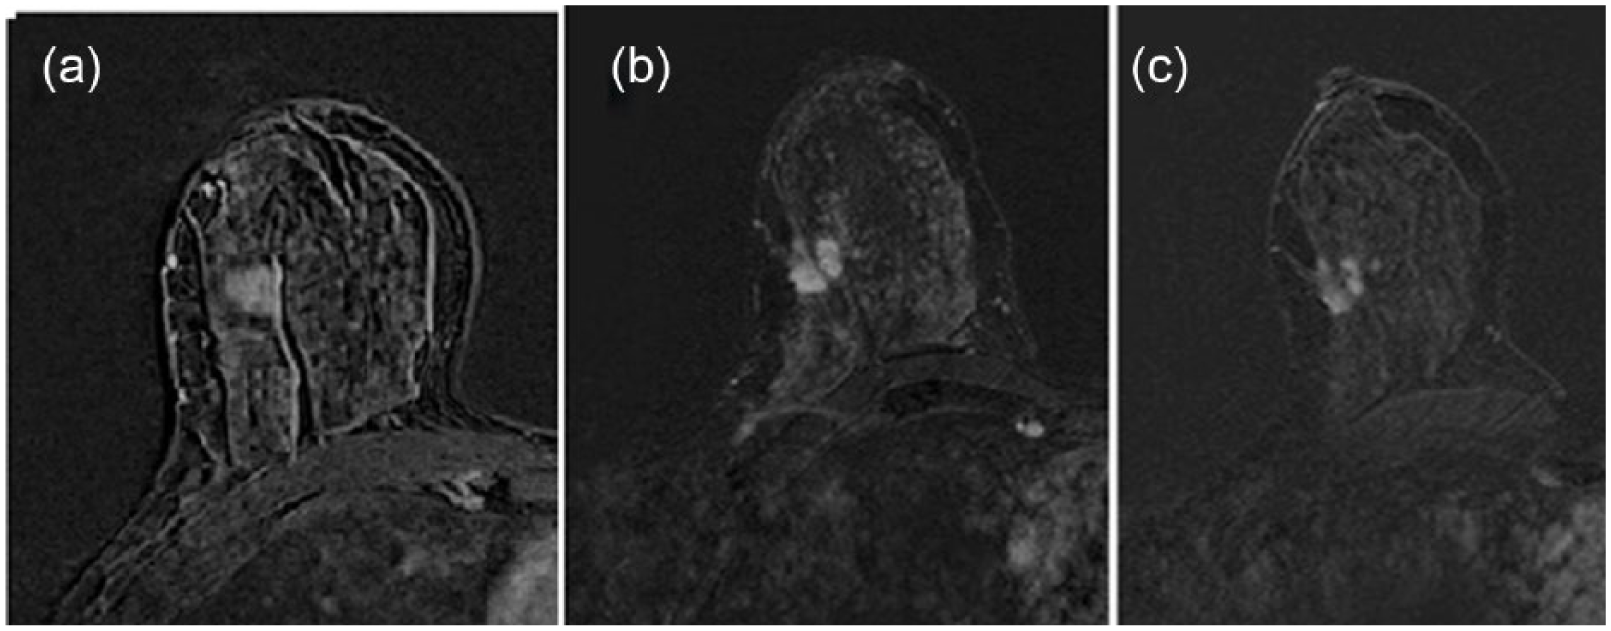
The SP has been assessed on the MRI images acquired at the II cycle of NACHT (particularly on T1-weighted subtracted sequences obtained at the first minute after contrast medium injection) and classified in three categories: (1) concentric shrinkage, (2) nodular shrinkage with residual multinodular lesions, (3) mixed shrinkage including the characteristics of (1) and (2), as shown in Figures 1 and 2.

Shrinkage patterns after NACHT: (a) concentric, (b) nodular, and (c) mixed.

T1-weighted images obtained after contrast medium administration showing the different patterns of tumor regression after therapy: (a) concentric, (b) nodular, and (c) mixed.
Histopathology
All patients performed core needle biopsy (CNB) procedure before starting NACHT. CNB has been performed under US guidance using a semi-automated biopsy gun (PRECISA Diameter 14G, length: 100 mm, Hospital Service, Aprilia, Italy) obtaining a minimum of three samples for each biopsy. Histological tumor type (ISDC: in situ ductal carcinoma, IDC: invasive ductal carcinoma, ILC: invasive lobular carcinoma) and grades (I: low, II: intermediate, III: high grade) were recorded.
Tumors were classified in four molecular subtypes using estrogen and/or progesterone receptor and HER2 status, as determined by immunohistochemistry (IHC) or fluorescence in situ hybridization (FISH) and KI67.
HER2 was classified as positive by either an IHC score of three and/or FISH amplification.
The biological subtypes included the following:
Luminal A
Luminal B
Triple negative (TN)
HER2+
The luminal subtypes are characterized by expressing hormonal (estrogen and/or progesterone) receptors; HER2+ subtype is characterized by the expression of the human epidermal growth factor receptor 2 and the absence of hormonal receptors. Finally, the TN subtype is characterized by the absence of hormonal receptors and HER2. Luminal subtypes are further classified as Luminal A (HER2− and Ki67 < 14%), Luminal B HER2− (HER2− and Ki67 > 14%), and Luminal B HER2+ (HER2+, regardless of Ki67) according to the Ki67 cell proliferation rate and the HER2 expression. 20
After chemotherapy, all patients underwent surgery. The largest diameter of identifiable tumor mass was measured, and the pathological response was assessed on the surgical specimen and classified by pathologists based on the Miller–Payne grading system 21 as CR (grade 5), PR (grades 4–3), and non-response (NR, grades 1–2).
Statistical analysis
Descriptive statistics were presented using frequencies, percentages, and frequency tables for qualitative variables.
We performed Fisher exact probability test for univariate analyses and, where possible, the χ 2 test with continuity correction.
Statistical analysis was performed using SPSS 19.0 for Windows®, and statistical significance was defined when p < 0.05.
Results
Most patients (35/51) received taxane-anthracycline–based chemotherapy. Usually chemotherapy schedule included a sequential dose regimen (every 2 weeks) of doxorubicin (four cycles), followed by paclitaxel (four cycles) and cyclophosphamide (four cycles). HER2-positive patients (16/51) were treated with a trastuzumab-based regimen.
The initial biopsy of the lesions revealed forty cases of IDC, seven cases of IDC mixed with foci of ISDC and four cases of ILC.
Considering tumor grade, 6 lesions were well differentiated (grade I), 33 moderately differentiated (grade II), and 12 poorly differentiated (grade III).
Based on tumor biological profiles, we observed 12 Luminal A, 11 Luminal B, 12 TN, and 16 HER2+ cancers.
All patients underwent surgery after NACHT (mastectomy n = 16; quadrantectomy n = 35); the median time between the preoperative MRI and surgery was 20 days.
The pathological response rate was assessed on the surgical specimen according to Miller and Payne criteria and classified as CR (G5 n = 17), PR (G4 n = 16, G3 n = 9) and NR (G2 n = 6, G1 n = 3)
Mean baseline tumor size determined by MRI was 3.79 cm (range: 1.30–0.7 cm).The mean residual tumor size determined by MRI after NACHT was 1.82 cm (range: 0–5.7 cm). The final pathologic tumor size was 1.46 cm (range: 0–5.1 cm).
Overall, the Pearson correlation between MRI after NACHT and histology was 0.72 (confidence interval = 0.56–0.95), with a highly significant correlation between radiographic response and pathologic response (p < 0.001).
MRI showed a slight tendency to overestimate the final response, especially in case of baseline lesions greater than 2.5 cm and with foci of ISDC (p = 0.003).
A total of 17 patients achieved a pCR, and 15 of them showed complete disappearance of enhanced regions on final MRI (classified as true negative cases), while the remaining two cases had residual enhanced areas of variable size (considered as false positive cases).
MRI correctly identified 31 cases of residual tumor presenting as residual enhanced areas (considered true positive cases), while underestimated residual disease in three cases (classified as false negatives) appearing as non-enhancing area on MRI but with an incomplete response on the surgical specimen.
Sensitivity (Se), specificity (Spe), positive predictive value (PPV) and negative predictive value (NPV) of MRI are shown in Table 1.
MRI sensitivity, specificity, positive predictive value (PPV), and negative predictive value (NPV).

MRI: magnetic resonance imaging; CI: confidence interval.
To establish the possible role of SP as early response predictor to NACHT, we classified SP based on its morphology and dynamic features on MRI images acquired at the end of the II cycle of NACHT and evaluated its correlation with the final pathological response.
We observed 20 concentric (CP), 18 mixed (MP), and 13 nodular pattern (NP).
Based on the tumor size, MP occurred more frequently in large baseline lesions (diameter: >2.5 cm, p < 0.005), while no significant association were found between SP and the tumor grade.
Considering the association between SP and the biological cancer subtypes, the univariate analysis (Table 2) showed a significant association between HER2+ tumors and CP (n = 11, p < 0.001), between Luminal A and MP (n = 10, p < 0.001) as shown in Figure 3 and between TN tumors and NP (n = 9, p < 0.001) while no significant association was found between Luminal B subtype and a specific SP.
Univariate analysis showing the relationships between SP and tumor biological subtypes.

SP: shrinkage pattern; CP: concentric pattern; MP: mixed pattern; NP: nodular pattern.
Values in bold are statistically significant.
Forty-nine-year-old patient presenting a single mass-enhancing lesion in the upper external quadrant of the right breast. (a) MRI T1-weighted post-contrast image acquired before therapy; (b) after the II cycle of NACHT, the MRI showed a mixed pattern of tumor regression with a concentric shrinkage of the mass surrounded by other nodular lesions; (c) at the end of therapy, the response rate was only of about 10%. Histology revealed a luminal invasive ductal cancer (IDC).
We also found a significant association between CP and the CR (n = 13, p < 0.001) as shown in Figure 4, while none of NR presented CP (n = 0, p = 0.008). In addition, we found a significant association between MP and NR (n = 6, p = 0.005). There wasn’t a significant association between PR and a specific SP, as shown in Table 3.

Sixty-five-year-old patient presenting a single mass-enhancing lesion in the inferior external quadrant of the left breast. (a) MRI T1-weighted post-contrast image acquired before therapy; (b) after the II cycle of NACHT, the MRI showed a concentric pattern of tumor regression; (c) while at the end of therapy, the patient achieved a complete response confirmed on the surgical specimen analysis. Biological tumor subtype was HER2+.
Univariate analysis showing the relationhip between SP and tumor response after chemotherapy.

SP: shrinkage pattern; CR: complete response; PR: partial response; NR: non-response; CP: concentric pattern; NP: nodular pattern; MP: mixed pattern.
Considering the dynamic features, we observed EID 0 in five cases, EID 1 in seven cases, EID 2 in 20 cases, and EID 3 in 19 cases.
We found a significant association between EID 0 and NR (p = 0.002), while EID 2 and EID 3 were often observed in responders patients. Particularly, EID 2 occurred frequently in PR (p = 0.004) and EID 3 in CR (p < 0.001) (showed in Table 4).
Univariate analysis showing the relationhip between tumor response after chemotherapy and the tumoral enhancement reduction in course of therapy.

EID: enhancement intensity decrease; CR: complete response; PR: partial response; NR: non-response.
No significant association has been found between EID and a specific molecular subtype.
Discussion
There is a great interest in the Literature to establish whether certain MRI tumor characteristics could predict the response rate to NACHT. 22
In this study, we investigated the potential role of SP as an early response rate predictor during therapy and its relationship with the different tumor biological subtypes which are among the most important factors determining the response to treatment.
We found a significant association between HER2+ tumors and CP, achieving frequently a good or CR rate after NACHT and between Luminal A cancers and MP, showing often limited or no response after therapy. These data are in agreement with the previous Literature, indeed different studies suggest that not all patients have an equal response to NACHT and that this response may vary depending on biological characteristics of the tumor and their IHC-based molecular subtype. The reported pCR rates are, respectively, 48%, 45%, and 6% for HER2+, TN, and Luminal A tumors. In addition, HER2 tumoral overexpression is considered a significant predictive factor of response23–25 with high rates of pCR after therapy.
Although previous studies have been conducted on SP, to the best of our knowledge, this is the first one evaluating simultaneously both its morphologic and dynamic aspects.
Considering the shrinkage morphology, we found a statistical association between complete responders and NP (p < 0.001), while non-responders often showed MP (p = 0.005). These findings are in agreement with previous results of Kim et al. 15 that analyzed the correlation between SP and pathological response grading. However, they analyzed the SP on the MRI images acquired after the last cycle of chemotherapy, whereas we classified the SP on the MRI images acquired at the II cycle of NACHT to evaluate its role in the early phases of treatment. In addition, they classified the SP in five categories: type I (concentric shrinkage without any surrounding lesions), type II (concentric shrinkage with surrounding lesions), type III (shrinkage with residual multinodular lesions), type IV (whole quadrant diffuse contrast enhancement), and non-visualization. In our study, instead, there were no cases of types IV and V, so we classified SP as nodular, concentric, and mixed.
SP morphology could be explained by the different changes induced in the tumor bed by chemotherapy. After NACHT, surgical specimens revealed different kinds of alterations into the nucleus (enlargement, necrosis, pyknosis) and cytoplasm (vacuolation, karyorrhexis, karyolysis). In addition, several reactions occur in the stroma-like fibrosis, elastosis, collagenization, and hyalinization.12,14,26 All these aspects are able to affect tumor shrinkage. We observed that lesions greater than 2.5 cm often presented mixed SP after NACHT (p < 0.005) and this is probably due to the intratumoral necrosis, that often occurs in the tumor bed of large lesions, leading to cellular dyscohesion.
We also evaluated the enhancement intensity during therapy within the tumor bed: indeed, tumor enhancement decrease is considered an additional prognostic factor in predicting response to NACHT. To assess the EID, we used a semiquantitative method, expressing in percentage the intensity enhancement decrease after the II cycle of NACHT.
We found that an early reduction of EID between 70% and 100% was often related with a complete pathological final response (p < 0.001) and these data are in agreement with a previous study of Rieber at al. 27 which showed that the absence of tumor contrast enhancement after four cycles of NACHT is able to predict the complete pathologic response to therapy. We also found a significant association between EID 0 and NR.
These results can be explained with the reduction in microvessel density within the tumor bed occurring after therapy.28,29 In addition, chemotherapy often causes hyalinization of the blood vessels thus resulting in the reduction of tumor signal enhancement on MRI images.
In our study, MRI showed a good diagnostic performance in detecting residual disease with a high sensitivity an acceptable specificity (respectively, 94% and 78%).These data are in agreement with the previous Literature; in fact, it is well known that the Se of breast MRI is extremely high, thanks to its ability to enhance tumor tissue thus exceeding all other breast-imaging diagnostic tools.30,31
Our study has some limitations, such as the small sample size and its retrospective design, so we cannot generalize our findings. Furthermore, our analysis is focused only on tumors presenting as mass lesions on MRI, so ruling out a great number of patients presenting with multifocal or multicentric disease and non-mass-like enhancement pattern on MRI, because in these groups, the evaluation of SP may be difficult.
Previous studies investigated how MRI morphological features prior to NACHT can contribute to determine the effects of the treatment. 32 Our work is a preliminary study, so other investigations should be performed to assess whether the non-nodular lesions have different patterns of SP.
Conclusion
In conclusion, our findings suggest that tumor SP provided by MRI, combined with biological features, may serve as early response indicators to NACHT.
In particular, we found that CP was more frequently observed in CR and in HER2+ tumors, while MP occurred in NR and in Luminal A cancers. In addition, an early strong reduction in enhancement intensity (EID 3) could be considered a good prognostic factor in predicting pCR.
Footnotes
Acknowledgements
All authors have contributed equally to the layout of the article. Each author has contributed substantially to the research, preparation, and production of the paper and approved of its submission to the journal.
Declaration of conflicting interests
The author(s) declared no potential conflicts of interest with respect to the research, authorship, and/or publication of this article.
Funding
The author(s) received no financial support for the research, authorship, and/or publication of this article.