
Abstract
Eph receptor A4 (EphA4), a member of the erythropoietin-producing hepatocellular (Eph) family, has been reported to upregulate in several tumors. However, the role of EphA4 in multiple myeloma has not been clarified yet. In this study, we found that EphA4 promoted proliferation of multiple myeloma cells via the regulation of cell cycle. Besides, EphA4 was closely related to cell adhesion of multiple myeloma cells and promoted cell adhesion–mediated drug resistance by enhancing the phosphorylation levels of Akt (p-AKT) expression in multiple myeloma. More interestingly, we discovered that EphA4 can interact with cyclin-dependent kinase 5 (CDK5) and regulate its expression in multiple myeloma. CDK5 has been reported to be overexpressed in multiple myeloma which mediated bortezomib resistance and also participated in AKT pathway. And we have also proved the fact. So, we supposed that EphA4 interacted with CDK5 and promoted its expression which in turn enhanced p-AKT expression and promoted cell adhesion–mediated drug resistance in multiple myeloma. Therefore, this study clarifies the molecular mechanism of cell adhesion–mediated drug resistance and may be useful in identifying potential target for treatment of multiple myeloma.
Keywords
Introduction
Multiple myeloma (MM) is the second most common hematological malignancy and remains incurable with a median survival time of 5–6 years.1–3 It is characterized by clonal proliferation of malignant plasma cells in the bone marrow (BM) and often resulted in bone lesions, hypercalcemia, infections, anemia, and proteinemia.4,5 Moreover, it has been recently reported that the incidence of MM was increasing over the last decade which makes MM a disease of considerable clinical, social, and economic impact. 6 Despite the introduction of some targeted therapeutic agents, patients eventually relapse and often show multiple drug resistance.7,8 Recent study showed that the development of MM owes not only to uncontrolled proliferation of malignant plasma cells but also closely to the BM microenvironment. 9 Here, the malignant plasma cells disseminate in the BM microenvironment through interactions of the adhesion molecules on the surface of MM cells and the BM extracellular matrix (ECM) components and receive multiple signals that maintain their long survival and exert protective effects against drug-induced apoptosis.10,11 The phenomenon was widely known as cell adhesion–mediated drug resistance (CAM-DR). Unfortunately, we know little about the molecular mechanisms underlying the CAM-DR which facilitates many people to explore further.
Eph receptor A4 (EphA4) is a member of the erythropoietin-producing hepatocellular (Eph) family, one of the largest groups of receptor tyrosine kinases.12,13 The Eph receptors are divided into two types according to their ligand-binding specificities: EphA (EphA1–EphA10) and EphB (EphB1–EphB6). In general, type-A receptors bind type-A ephrin ligands and type-B ephrin ligands stimulate type-B receptors. But the structure of EphA4 is varied which means that it can bind and respond to all ephrin ligands. Because of the characteristic, EphA4 is widely involved in the regulation of biological function.14,15 It has been reported that EphA4 is associated with many cancers such as pancreatic ductal adenocarcinoma, gastric cancer, and breast cancer. It can promote the growth of the cancer cells via the regulation of AKT pathway, so high expression of EphA4 is associated with poor prognosis for the cancers.16–18 Besides, some research suggested that EphA4-mediated forward signaling promotes monocyte adhesion by directly modulating the actin cytoskeleton. 19
Although it has been reported that EphA4 is associated with many cancers, the role of EphA4 in CAM-DR of MM remains poorly understood. In our study, we first showed that EphA4 regulated cell proliferation and CAM-DR via the AKT pathway in MM. More interestingly, we found that EphA4 is associated with cyclin-dependent kinase 5 (CDK5) by co-immunoprecipitation experiments. CDK5, a small serine/threonine kinase, is different from other members of the CDK family because it has been recognized as an important regulator of neuronal differentiation, rather than a cell cycle regulator. It controls synapse formation, neuronal migration, and so on.20,21 Recently, more and more research found that CDK5 was related to proliferation, migration, and motility of many cancers such as lung cancer, prostate cancer, and MM. The increased expression of CDK5 is associated with poorer prognosis in these cancers.22–24 Among these studies, we are most interested in the role of CDK5 in MM. Recently, CDK5 was identified as being a key modulator of bortezomib sensitivity in MM cell lines. 25 Silencing CDK5 can sensitize MM cells treated with bortezomib and improve survival of patients. 24 We have proved that EphA4 can interact with CDK5 and regulate its expression; maybe in the future, we can reduce the expression of CDK5 in MM through preventing the interaction or the target between EphA4 and CDK5 or directly silencing EphA4 expression to increase the sensitivity of MM cells to bortezomib. In conclusion, our study shed new light on the important role of EphA4 in cancer development.
Materials and methods
Cell culture and transient transfection
Human MM cell lines RPMI 8226 and NCI-H929 were obtained from Cell Library, Chinese Academy of Sciences (Beijing, China) and Bioleaf Biotech (Shanghai, China), respectively, and the cells were cultured in RPMI 1640 (Sigma-Aldrich, St. Louis, MO, USA) with 10% fetal bovine serum (Gibco-BRL, Grand Island, NY, USA). Human BM stromal cell line HS-5 was purchased from Cell Library, Chinese Academy of Sciences and cultured in Dulbecco’s modified Eagle medium (DMEM; Sigma-Aldrich) with 10% fetal bovine serum at 37°C in a 5% CO2 incubator. Three siRNA sequences targeting EphA4 were used: si-1: 5′-TCC GAA CCT ACC AAG TGT G-3′; si-2: 5′-TCA TGA AGC TGA ACA CCG A-3′; and si-3: 5′-GCA GCA CCA TCA TCC ATT G-3′. Three siRNA sequences targeting CDK5 were used: si-1: 5′-TGA AGT GTA ACC CTG TCC A-3′; si-2: 5′-TCC CGT CCG CTG TTA CTC A-3′; and si-3: 5′-TCA TTC CTC TTC CAG CTA C-3′. Transfections were performed with Lipofectamine 2000 (Invitrogen, Carlsbad, CA, USA) according to the manufacturer’s instructions.
Cell co-culture and detection of adhesion rate
First, the dishes were coated with HS-5 cells or 40 µg/mL fibronectin (FN; Sigma-Aldrich, Rehovot, Israel) in 1 mL phosphate-buffered saline (PBS) overnight at 37°C. Then, MM cells (105 cells/mL) were adhered to the dishes. Finally, after 2–4 h of adhesion, the non-adherent cells were removed by three washes in PBS and the adherent cells were collected for the next experiments.
To detect cell adhesion rate, the MM cells collected in the last step were stained with Calcein-AM (Santa Cruz Biotechnology) for 30 min according to the manufacturer’s instructions. Then, the cells were monitored with a fluorometer (CytoFluor; Applied Biosystems, Foster City, CA, USA) at 490 nm.
Western blot analysis and antibodies
The proteins were first subjected to sodium dodecyl sulfate (SDS) polyacrylamide gel electrophoresis (SDS-PAGE) and then transferred onto polyvinylidene difluoride (PVDF) filter membranes (Millipore, Bedford, MA, USA). After blocking with PBS containing 5% non-fat milk and 0.1% Tween-20 for 2 h, the membranes were then incubated with the primary antibodies overnight at 4°C or at room temperature for 6–8 h. Then, the membranes were washed three times with PBS with Tween 20 (PBST) for 5 min each time and incubated with horseradish peroxidase–conjugated secondary antibody for 2 h at room temperature. Finally, the membranes were scanned by the enhanced chemiluminescence (ECL) detection system. The band density was quantified using the ImageJ analysis system (Wayne Rasband, National Institutes of Health, Bethesda, MD, USA). The primary antibodies included the following: anti-EphA4 antibody (1:500), anti-CDK5 antibody (1:500), antibody anti-PCNA antibody (1:500), anti-GAPDH antibody (1:1000), anti-ERK1/2 antibody (1:1000), anti-p-ERK1/2 antibody (1:1000), anti-GSK-3β antibody (1:1000), and anti-p-GSK-3β antibody (1:1000). All antibodies used were purchased from Santa Cruz Biotechnology (Santa Cruz, CA, USA), except anti-ERK1/2, anti-p-ERK1/2, anti-GSK-3β, and anti-p-GSK-3β (Cell Signaling Technology, Inc., Danvers, MA, USA). The experiments were carried out on three separate occasions.
Flow cytometric analysis
In order to know the distribution of cell cycle, cells were fixed in 70% cold ethanol at −20°C for at least 24 h once collection. After washing twice with PBS, the cells were incubated with 1 mg/mL RNase A for 20 min at 37°C. Finally, the cells were stained with propidium iodide (PI, 50 µg/mL; Becton Dickinson, San Jose, CA, USA) for another 20 min at 4°C in dark. The data were analyzed using a Becton Dickinson flow cytometer BD FACScan.
For cell apoptosis analysis, the cells were first exposed to chemotherapy agents for 48 h; apoptotic cells were then detected with Annexin-V-FLUOS Staining Kit (Roche) in accordance with the manufacturer’s protocol.
Cell viability assay
MM cells were first inoculated into a 96-well plate (Corning Inc., Corning, NY, USA) in advance at the density of 105 cells per well in a volume of 90 µL, and then, the cells grew 48 h with or without chemotherapy drugs. Finally, 10 µL Cell Counting Kit-8 (CCK-8) reagents (Dojindo, Kumamoto, Japan) were added to each well and incubated for an additional 1 h at 37°C in dark. The absorbance was measured in a microplate reader (Bio-Rad, Hercules, CA, USA) at a test wavelength of 450 nm and a reference wavelength of 630 nm.
Soft agar colony assays
A volume of 1 × 10³ cells per well were inoculated into 24-well plates in advance with 0.5 mL of 0.35% agar solution containing RPMI 1640 and layered on top of a 0.8% agar layer. Then, the plates were maintained for at least 2 weeks at 37°C with 5% CO2 making sure that the plates would not dry. Cell colonies were stained with 0.5% crystal violet and observed by microscopy.
Co-immunoprecipitation assay
The cells were first harvested and lysed in buffer for 0.5–3 h at 4°C with rocking. The supernatants were then pre-cleared with 30 µL protein A/G (Sigma-Aldrich) at 4°C for 1 h with rocking. Then, 30 µL of supernatants was collected as input. After that, the rest of the supernatants were separated into two and incubated with the EphA4 antibody (Santa Cruz Biotechnology) and IgG at 4°C overnight. (Aliquots of the extracts were immunoprecipitated with 1 µg antibody, and the maximum can be added is 6 µg; too many antibodies will produce false positives). Then, the samples were incubated with 30 µL protein A/G at 4°C for 2 h. All the above steps must be carried out during rocking. Finally, the precipitates were collected, washed three times, and boiled for 10 min with SDS sample buffer followed by western blot.
Statistical analysis
Each experiment was repeated at least three times. All values are reported as mean ± standard error of the mean (SEM). The calculations were analyzed with the Statistical Package for the Social Science (SPSS) 19.0 software (SPSS Inc., An IBM Company, Chicago, IL, USA). The probability of 0.05 or less was considered statistically significant.
Results
EphA4 regulated the proliferation of MM cells via the regulation of cell cycle
It has been reported that EphA4 promoted the growth of the cancer cells in pancreatic ductal adenocarcinoma. 16 So, we conjectured that EphA4 was associated with cell proliferation in myeloma cells. In order to prove our hypothesis, RPMI 8226 and NCI-H929 cells were transfected with EphA4 siRNA and control siRNA. The transfection efficiency was then confirmed by western blot analysis. At the same time, the proliferative marker PCNA was also measured. As shown in Figure 1(a) and (b), the expression of EphA4 maximally decreased in siEphA4-3 in the cells among the three siRNA and control siRNA. So, siEphA4-3 was chosen for the following experiments. It also showed that the expression of PCNA was decreased upon EphA4 silencing. Colony formation assays showed that knockdown of EphA4 significantly inhibited the proliferation of RPMI 8226 and NCI-H929 cells (Figure 1(c)). Next, we performed CCK-8 assays to measure the viability of EphA4 knockdown cells which showed that the cell viability was inhibited upon loss of EphA4 (Figure 1(d)). To explore the mechanism underlying the decreased cell proliferation by EphA4 siRNA, cell cycle distributions were measured by FACS. It showed that knockdown of EphA4 increased percentages of cells in G0/G1 phase but reduced percentages of cells in S phase (Figure 1(e)). In summary, these data supported that EphA4 might promote the MM cell proliferation by regulating cell cycle progression.

EphA4 regulated the proliferation of MM cells via the regulation of cell cycle. (a) RPMI 8226 and (b) NCI-H929 cells were transfected with either EphA4 siRNA or control siRNA. Western blot analysis was carried out to detect the interference efficiencies of EphA4 siRNA and the expression of PCNA under this condition. GAPDH was used as a control for protein load and integrity. The bar chart demonstrated the ratio of EphA4 and PCNA protein to GAPDH after transfected with siNC or EphA4 siRNA. Data are presented as mean ± SEM of three independent measurements. (c) Soft agar colony assays were performed to estimate the effect of EphA4 on cell proliferation. Colony numbers were normalized to the number of colonies formed by cells expressing siNC. The colony formation images of Figure 1(c) was in the supplementary Figure 1(b). (d) Cell growth was measured by CCK-8 assay (*, #p < 0.05, compared with siNC). (e) RPMI 8226 cells and NCI-H929 cells were transfected with siEphA4-3 and siNC, and flow cytometry was then performed to detect cell cycle distribution of the MM cells.
The expression of EphA4 was related to cell adhesion of MM cells
It has been reported that EphA4 was related to cell adhesion. 19 So, we supposed that EphA4 might promote the cell adhesion in MM cells. Therefore, cell adhesion assay was performed to detect the expression of EphA4. Western blot analysis showed that expression of EphA4 was significantly increased in adherent cells compared with that cultured in suspension both in RPMI 8226 and NCI-H929 cells (Figure 2(a) and (b)). Besides, we also examined the relationship between EphA4 and cell adhesion by interference with the expression of EphA4. Cell adhesion assay revealed that knockdown of EphA4 resulted in a significant decrease in cell adhesion rate (Figure 2(c) and (d)). In conclusion, EphA4 was involved in the progress of cell adhesion.

The expression of EphA4 was related to cell adhesion of MM cells. (a) RPMI 8226 and (b) NCI-H929 cells were adhered to fibronectin (FN) or human bone marrow stromal cells HS-5 or cultured in suspension, and then, western blot analysis was performed to detect the expression of EphA4 in these conditions. The bar chart demonstrates the ratio of EphA4 protein to GAPDH by densitometry (*p < 0.05, compared with the suspension cells). Cell adhesion rate of (c) RPMI 8226 and (d) NCI-H929 cells transfected with siEphA4-3 or siRNC was detected as described above. The mean ± SEM of three independent experiments is shown (*p < 0.05, compared with siRNA).
EphA4 promoted cell proliferation and inhibited apoptosis by enhancing p-AKT expression
It has been reported that EphA4 promoted proliferation of medulloblastoma and pancreatic cancer via the regulation of p-AKT pathway.26,27 To explore whether EphA4 promoted the proliferation of MM cells by regulating p-AKT, RPMI 8226 and NCI-H929 cells were transfected with EphA4 siRNA and its respective control. Western blot assay showed that knockdown of EphA4 resulted in a significant decrease in the expression of p-AKT and p-GSK-3β (Figure 3(a)). To further clarify that EphA4 promotes the proliferation of MM via the regulation of p-AKT, AKT inhibitor (MK2206) was then used. As shown in Figure 3(b), MK2206 significantly reduced p-AKT and p-GSK-3β expression in RPMI 8226 and NCI-H929 cells. As we expected, cell proliferation promoted by EphA4 was reduced by MK2206 in both RPMI 8226 and NCI-H929 cells (Figure 3(c)). Flow cytometric assays were then used to investigate the effect of EphA4 on apoptosis. It showed that the proportion of apoptotic cells was increased upon loss of EphA4. Moreover, the apoptosis mediated by EphA4 silencing was increased when treated with MK2206 (Figure 3(d) and (e)). These data suggest that EphA4 promoted cell proliferation and inhibited apoptosis by enhancing p-AKT expression.

EphA4 promoted cell proliferation and inhibited apoptosis by enhancing p-AKT expression. (a) RPMI 8226 and NCI-H929 cells were transfected with siEphA4-3 or siNC, and western blot analysis was then performed to detect the expression of AKT, Gsk-3β, p-AKT, and p-Gsk-3β. (b) RPMI 8226 and NCI-H929 cells were treated with AKT inhibitor MK2206 or DMSO (control), and the expression of AKT, Gsk-3β, p-AKT, and p-Gsk-3β was then tested again by western blot analysis. (c) RPMI 8226 and NCI-H929 cells were transfected with either siEphA4-3 or siNC and then treated with MK2206 or DMSO; soft agar colony assays were then performed to detect cell proliferation. The colony formation images of Figure 3(c) was in the supplementary Figure 1(c). (d and e) The cells above were detected by flow cytometric analysis to analyze apoptosis. The bar chart demonstrates the number of Annexin V+ cells after treatment (*, #p < 0.05).
EphA4 promoted CAM-DR
In Figure 2, we have proved that E1phA4 was related to cell adhesion, but the role of EphA4 in CAM-DR was poorly understood. So, we treated MM cells with chemotherapy drugs after the expression of EphA4 was interfered by EphA4 siRNA in suspension and adherent cells. CCK-8 assays showed that adherent cells are less sensitive to chemotherapy drugs compared to those cultured in suspension. But, this effect was reversed by EphA4 siRNA (Figure 4(a)). Similarly, flow cytometry assay also showed that the cells adherent to FN have more apoptosis when the expression of EphA4 was decreased (Figure 4(b) and (c)). These data confirmed that EphA4 played an important role in CAM-DR. We have proved that EphA4 promoted the proliferation of MM via the regulation of p-AKT, and to determine whether EphA4 regulated CAM-DR by the same mechanism, RPMI 8226 and NCI-H929 cells were treated with MK2206 or DMSO. CCK-8 assays revealed that EphA4-mediated drug resistance was reversed upon treating with MK2206 (Figure 4(d) and (e)). All these data clarified that EphA4 promoted CAM-DR via the AKT pathway.
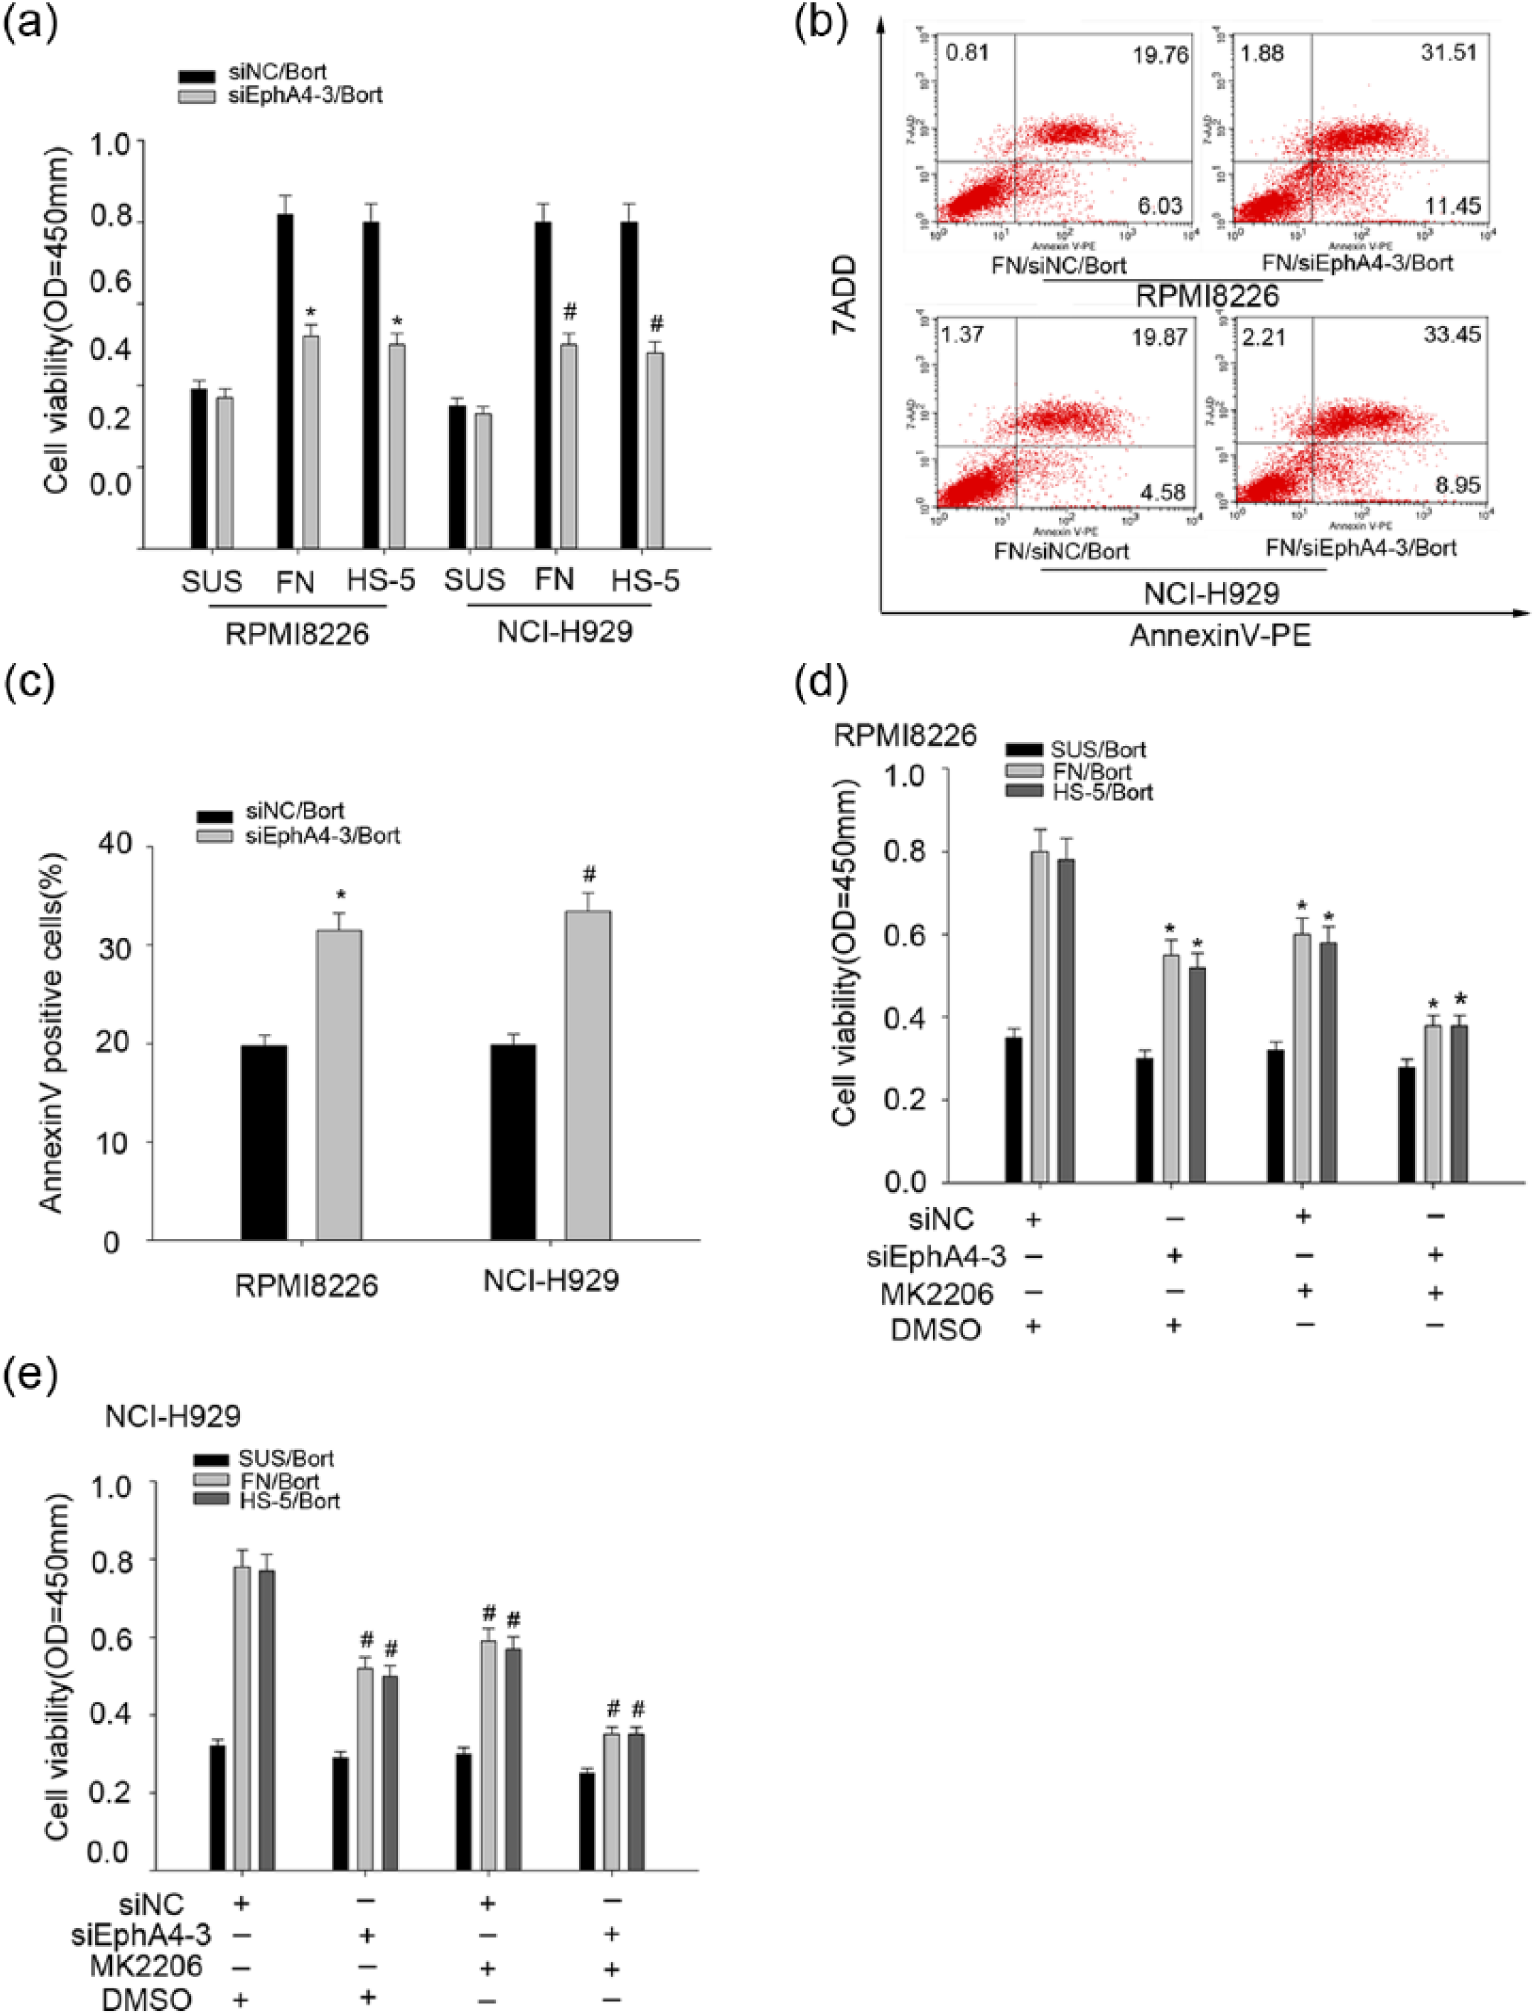
EphA4 promoted cell adhesion–mediated drug resistance. (a) RPMI 8226 and NCI-H929 cells transfected with siEphA4-3 or siNC were adhered to fibronectin (FN) or HS-5 or cultured in suspension with 10 µM bortezomib (Bort). CCK-8 assay was performed to evaluate cell viability. (b and c) Flow cytometric analysis was used to determine the apoptosis induced by Bort in FN-adherent cells transfected with siEphA4-3 or siNC. The bar chart demonstrates the number of Annexin V+ cells after drug treatment (*, #p < 0.05, compared with the siNC group). (d and e) RPMI 8226 and NCI-H929 cells were transfected with either siEphA4-3 or siNC and then treated with MK2206 or DMSO, and then cells were treated with 10 µM Bort after adhered to FN or HS-5 cells or cultured in suspension for 24 h. CCK-8 assays were then performed to evaluate effects of siEphA4-3 and MK2206 on CAM-DR in RPMI 8226 and NCI-H929 cells (*, #p < 0.05).
EphA4 can interact with CDK5 and regulate its expression which also promotes CAM-DR in MM
Previous studies suggested that EphA4 can interact with CDK5 in cortical neuron and HEK 293T human embryonic kidney cells. 28 And we also proved that EphA4 can associate with CDK5 in RPMI 8226 and NCI-H929 cells by co-immunoprecipitation experiments (Figure 5(a) and (b)). Besides, mounting evidences have shown that CDK5 was overexpressed in MM which mediated bortezomib resistance and indicated poor prognosis.24,25,29 So, we wondered that CDK5 may be associated with CAM-DR in MM. Western blot analysis showed that expression of CDK5 was significantly increased in adherent cells (Figure 5(c) and d). There is only a little difference in the expression of EphA4 upon knockdown of CDK5. The results are showed in supplementary Figure 1(a). We therefore considered that the expression of CDK5 may be affected by EphA4. So, we detected the expression of CDK5 when EphA4 expression was interfered by EphA4 siRNA. Western blot analysis showed that the expression of CDK5 diminished as EphA4 expresses (Figure 5(e)). More interestingly, some research suggested that CDK5 can participate in AKT pathway in prostate cancer. 23 We then detected the P-AKT expression when the expression of CDK5 was interfered by CDK5 siRNA in MM cells. The expression of CDK5 maximally decreased in siCDK5-2 in the cells among the three siRNA and control siRNA. So, siCDK5-2 was chosen for the following experiments (Figure 5(f)). Western blot analysis showed that the expression of p-AKT was decreased upon loss of CDK5 (Figure 5(g)). In order to investigate whether CDK5 involved in the process of CAM-DR, flow cytometry assay was used to detect the apoptosis of the adherent cells exposed to chemotherapy drugs. It showed that the cells are more sensitive to chemotherapy agents upon loss of CDK5 (Figure 5(h)). So, we suspected that EphA4 interacted with CDK5 and promoted its expression which in turn regulated the p-AKT pathway and promoted CAM-DR.

EphA4 can interact with CDK5 and regulate its expression which also promotes CAM-DR in MM. (a) and (b) Endogenous protein–protein interaction between EphA4 and CDK5 was determined by immunoprecipitation (IP) with EphA4 antibody followed by western blot analysis in RPMI 8226 and NCI-H929 cells. IgG was used as a negative control for immunoprecipitation. (c) and (d) RPMI 8226 and NCI-H929 cells were adhered to fibronectin (FN) or HS-5 or cultured in suspension, and then, western blot analysis was performed to detect the expression of CDK5 in the three conditions. The bar chart demonstrates the ratio of CDK5 protein to GAPDH by densitometry (*p < 0.05, compared with the suspension cells). (e) RPMI 8226 and NCI-H929 cells transfected with siEphA4-3 or siNC were lysated, and western blot analyzed the expression of EphA4 and CDK5. (f) RPMI 8226 and NCI-H929 cells were transfected with CDK5 siRNA or control siRNA. Western blot analysis was performed to detect the interference efficiencies of CDK5 siRNA. GAPDH was used as a control for protein load and integrity. The bar chart demonstrated the ratio of CDK5 protein to GAPDH after transfected with siNC or CDK5 siRNA. Data are presented as mean ± SEM of three independent measurements. (g) RPMI 8226 and NCI-H929 cells were transfected with siCDK5-2 or siNC, and western blot analysis was then performed to detect the expression of AKT, Gsk-3β, p-AKT, and p-Gsk-3β as before. (h) Flow cytometric analysis was used to determine the apoptosis induced by Bort in FN-adherent cells transfected with siCDK5-2 or siNC just like Figure 4(b).
Discussion
MM is the second most common adult hematologic malignancy characterized by large production of monoclonal immunoglobulin.4,30 Despite important advances in anti-myeloma treatment resulted in extended overall survival, the patients relapsed in the end and then show multiple drug resistances. 31 Mounting evidences have been demonstrated that adhesion to the BM stroma can reduce the sensitivity of myeloma cells to chemotherapeutic drugs which was called CAM-DR. 32 Unfortunately, we know little about the molecular mechanisms underlying the CAM-DR. Moreover, the incidence of MM was increasing gradually due to certain factors. 3 So, it urges us to research the phenomenon further in order to get a better treatment effect of MM.
EphA4, one of the receptor tyrosine kinases, has been reported to be associated with many cancers such as gastric and breast cancers.17,18 But the role of EphA4 in MM remains largely unknown. In our research, we found that EphA4 promotes the proliferation of myeloma cells according to the CCK-8 and soft agar colony assays which was consistent with the expression of PCNA. Besides, flow cytometry analysis showed that the cells in G1 phase were significantly increased upon loss of EphA4. Our findings also showed that EphA4 expression was increased in adherent cells and closely related to cell adhesion rate. Furthermore, we also found that EphA4 can enhance p-AKT expression which not only promoted cell proliferation but also inhibited apoptosis. Because we have proved that EphA4 expression was increased in adherent cells, we suspect that EphA4 was involved in CAM-DR. Flow cytometry analysis showed that the adherent cells were more sensitive to chemotherapy drugs, and CCK-8 assay revealed that cell viability was decreased upon EphA4 silencing. Previous studies suggested that EphA4 can interact with CDK5 in cortical neuron and HEK 293T human embryonic kidney cells, and we proved it in MM cells by co-immunoprecipitation experiments. We discovered that CDK5 expression was increased in adherent cells and EphA4 can regulate its expression. Besides, it has been reported that CDK5 was overexpressed in MM and mediated bortezomib resistance and participated in AKT pathway.23,24 So, we detected the p-AKT expression when the expression of CDK5 was interfered by siRNA in MM. We found that p-AKT expression was significantly reduced and the adherent cells were more sensitive to chemotherapy drugs due to EphA4 silencing. Based on these results, we conclude that EphA4 interacted with CDK5 and promoted its expression which in turn enhanced p-AKT expression and promoted CAM-DR in MM.
In conclusion, our study demonstrated that EphA4 plays an important role in cell proliferation and CAM-DR in MM via the regulation of CDK5 and p-AKT expression. The cells whose EphA4 expression was interfered are more sensitive to chemotherapy drugs. But the real mechanism of the interaction and the target between EphA4 and CDK5 has not been clearly understood yet. This requires further research and we are engaging in this area so that we can reduce the expression of CDK5 in MM through preventing the interaction or the target between EphA4 and CDK5. In short, we provided a theoretical basis to clarify the molecular mechanism of CAM-DR and may provide a new target for the treatment of MM.
Footnotes
Declaration of conflicting interests
The author(s) declared no potential conflicts of interest with respect to the research, authorship, and/or publication of this article.
Funding
This work was supported by the National Natural Science Foundation of China (grant no. 81070400), Medical Innovation Team and the Leading Talent Project of Jiangsu Province (LJ201136), and Social Science and Technology Innovation and Demonstration in Nantong-Clinical Medical Science and Technology (HS2013067).
References
Supplementary Material
Please find the following supplemental material available below.
For Open Access articles published under a Creative Commons License, all supplemental material carries the same license as the article it is associated with.
For non-Open Access articles published, all supplemental material carries a non-exclusive license, and permission requests for re-use of supplemental material or any part of supplemental material shall be sent directly to the copyright owner as specified in the copyright notice associated with the article.