
Abstract
It is well-established that the development of a disease, especially cancer, is a complex process that results from the joint effects of multiple genes involved in various molecular signaling pathways. In this article, we propose methods to discover genes and molecular pathways significantly associated with clinical outcomes in cancer samples. We exploit the natural hierarchal structure of genes related to a given pathway as a group of interacting genes to conduct selection of both pathways and genes. We posit the problem in a hierarchical structured variable selection (HSVS) framework to analyze the corresponding gene expression data. HSVS methods conduct simultaneous variable selection at the pathway (group level) and the gene (within-group) level. To adapt to the overlapping group structure present in the pathway-gene hierarchy of the data, we developed an overlap-HSVS method that introduces latent partial effect variables that partition the marginal effect of the covariates and corresponding weights for a proportional shrinkage of the partial effects. Combining gene expression data with prior pathway information from the KEGG databases, we identified several gene-pathway combinations that are significantly associated with clinical outcomes of multiple myeloma. Biological discoveries support this relationship for the pathways and the corresponding genes we identified.
Introduction
Multiple myeloma (MM) is a cancer of plasma cells, which is the second most common hematological malignancy in the United States. 1 It is characterized by malignant, neoplastic transformation of terminally differentiated B cells in the bone marrow known as plasma cells, the principal function of which is to produce antibodies, also known as immunoglobulins, which play an important role in immune surveillance. Immunoglobulins are normally composed of small molecules known as heavy chains and light chains. There are five types of heavy chains, immunoglobulin G (IgG), IgA, IgM, IgD, and IgE, and two types of light chains, kappa and lambda, each combination forming one type of immunoglobulin complex. When a single abnormal clone of plasma cells results in an excessive number of light chains, these do not attach to the heavy chains to form the normal immunoglobulin complex, but rather enter the bloodstream as unattached light chains (and thus are labeled as serum free light chains). Myeloma progression is often seen when one type of immunoglobulin is excessively produced, causing a monoclonal protein spike. 2 Correspondingly, there will often be a large amount of one type of light chain (kappa or lambda) produced as a consequence, leading to an abnormally increased or decreased value in the free light chain (kappa/lambda) ratio in the serum. Hence, this ratio is an important indicator for the diagnosis, monitoring, and prognosis of MM.2–4 The degree to which the ratio deviates from the normal range indicates the extent of monoclonal gammopathy, which relates to the severity of MM. Therefore, the identification of specific genomic markers with expression levels that are associated with the extent of monoclonal gammopathy could potentially elucidate the molecular mechanisms underlying the progression of MM.
Advances in microarray technologies have increased the availability of high-throughput gene expression datasets, allowing for genome-wide investigations of molecular activities underlying diseases, including MM. A common interest in such studies is the identification of relevant genetic markers, eg, genes, that are associated with the development or progression of diseases. Traditional studies have mainly relied on univariate analysis, in which each gene is modeled independently, as in the work of Dryja
5
and Golub et al.
6
among others. However, we assume that the development of a disease is a complex process that results from the joint effects of multiple genes. Thus, it is of great interest to model the joint effects of the expression levels of genes over the whole genome as measured by microarray assays, and select genes whose expression levels exhibit significant associations with the clinical outcomes of patients with a specific disease or condition, such as MM. This is essentially a problem of
Inferential challenges for variable selection based on gene expression datasets from microarray assays include not only high-dimensionality (relative to sample size), but also the presence of a structured hierarchy induced by biological mechanisms. Genes typically do not influence the disease state by themselves, but act through their involved pathway(s), which allows us to consider genes related to a given pathway as a natural group of interacting genes. Studies have indicated that although many genes may be related to a complex disease such as cancer, relatively few pathways play a role in cancer development. 7 In addition, therapeutic interventions based on the inhibition of targeted pathways have been approved by the U.S. Food and Drug Administration for a variety of cancer types. 8 Hence, it is of equal interest for us to identify significant pathways as well as individual genes that are associated with the clinical outcomes of cancers. The Kyoto Encyclopedia of Genes and Genomes (KEGG) database is a popular public database that provides information on discovered pathways and their involved genes. 9 The pathway information available from the KEGG database allows us to assign genes into groups based on the specific pathways in which they are involved, and conduct analyses at the pathway level. In this article, we aim to select both pathways and individual genes mapped to these pathways that are significantly associated with clinical outcomes of MM based on gene expression profiles obtained from microarray assays.
The problem of simultaneously selecting MM-associated pathways and genes within those pathways involves variable selection at two hierarchical levels: the group level (pathways) and the within-group level (genes within a pathway). Many variable selection methods have recently been developed to incorporate grouping structures in datasets and conduct variable selection at the group level. Yuan and Lin
10
proposed the group lasso method, in which a lasso penalty function is applied to the
In this paper, we generalize the HSVS method of Zhang et al. 16 and apply it to our gene expression datasets from MM cell samples to identify significant pathways as well as genes within those pathways that are associated with the free light chain kappa/lambda ratio in serum while controlling for the demographic/clinical covariates. We recognize that individual genes may play multiple roles in cellular functions and belong to more than one biological pathway, as illustrated in Figure 1, ie, two groups of variables may overlap. Thus, we generalize the HSVS method to a more flexible overlap-HSVS method to accommodate the overlapping group structures in our pathway-based data analysis. Similar to our process for employing the HSVS method, we employ a selection prior imposed on a latent binary indicator for each group for the group-level selection, combined with a robust shrinkage distribution, such as a Laplace prior, for each coefficient in a group to represent the within-group-level shrinkage. For an individual variable that is mapped to multiple pathways, we introduce latent variables to represent the parts of the regression of the variable on the response that contribute through different pathways, with the shrinkage strength on each partial effect proportional to the regularization parameter of the corresponding pathway. Although the latent variables representing the partial effects of the variable on the response through each pathway are unidentifiable, the marginal effect of the variable, which equals the sum of the latent variables, can be uniquely estimated, which provides coherent inference. In addition, the proportional shrinkage on each part leads to a relatively stable Bayesian estimation of the model. We used the overlap-HSVS method to analyze the MM dataset of 208 patients, and identified both pathways and genes within the pathways that are potentially associated with the progression of MM.
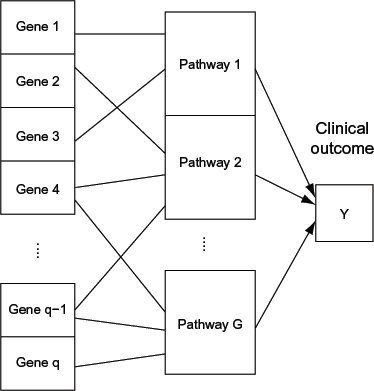
Schematic plot showing the overlapping group structures present in the gene expression data. Each gene in the left column can belong to one or multiple pathways, the activities of which are associated with the clinical outcome.
The rest of the paper is structured as follows. In Methods, we introduce the overlap-HSVS hierarchical model in detail and describe the algorithm for posterior inference. We present the data and the results of our application of the overlap-HSVS method to the MM genetic association study in detail in the subsequent sections.
Methods
Notations
Let 
where
Coding of pathway information
Let
Bayesian Hierarchical Model for Gene/Pathway Selection
We assume that the continuous responses relate to the covariates through the linear regression model
where 
where δ0 is a degenerate distribution that places all its mass at 0. Here γ
In the presence of overlapping groups where variable

where β
where 
Choice of Weights
One way to specify the weights in the prior of equation (3) is based on prior biological knowledge of the degree to which each gene contributes to the different pathways. When no such information is available, which is assumed for the application of this paper, we specify the weights as
where θ = 1/λ
Prior Specifications
We complete the prior specifications by assigning hyperpriors similar to those in the HSVS model. We use a diffuse Gaussian prior
Likelihood:

Priors:

Hyperpriors:

Posterior Inference and Summaries
We conduct the MCMC computation using a Gibbs sampling algorithm to generate posterior samples of all the parameters based on the full conditional posterior distributions, with block updating of
Pathway Selection
In particular, the MCMC computation generates posterior samples of the latent binary indicator variables γ

Gene selection
At the within-group (pathway) level, significant genes within a pathway can be selected based on the 95% credible intervals of the regression coefficients obtained from their posterior samples. Another method for evaluating the significance of the genes is based on the posterior probabilities of gene-specific effects. Suppose ɸ > 0 denotes an effect size such that a gene 
Given these posterior probabilities of pathway inclusion or gene effect obtained above, we could identify significant pathways or genes using a false-discovery-rate-based thresholding method. That is, we could flag a pathway or gene as significant if the corresponding posterior probability is greater than some significant threshold, which is determined to control the overall false discovery rate at a desired level.18,19
Analysis of Gene Expression Datasets from MM Cancer Cells
Dataset and Pre-Processing
The MM data are from the Multiple Myeloma Research Consortium Reference Collection, containing a total of 304 MM patient samples, the gene expression profiles of whom were measured using Affymetrix U133 Plus 2.0 microarrays. We used Robust Multichip Average for quantification of the data. Excluding samples without appropriate clinical information, we obtained a dataset including 208 patients with MM for further genetic association analysis. Since our interest lies in simultaneous selection of pathways and genes that are associated with MM, we only considered those genes, the pathway information of which is available, and excluded those not belonging to any pathway. Hence, the resulting dataset consists of the results of microarray assays of gene expression levels for 6,323 genes from the 208 patients with MM. In addition to the gene expression profiles, non-genetic clinical information is also contained in the database, including the patient's age, gender, and measurements of clinical outcomes such as the serum free light chain ratio. We took the absolute values of the logarithm of the serum free light chain ratios as continuous responses, which measure the deviation of the ratios away from 1. They give the discrepancy between the amounts of the two types of free light chains (kappa and lambda) in logarithmic scale. Plots of data show that controlling for the numbers of kappa-type and lambda-type MM patients present in the data, the distribution of the log ratios is approximately symmetric about 0. Since the amounts of the two types of free light chains are extremely unbalanced in MM, this works as an indicator of the severity of MM. We use age and gender as the demographic covariates in our model.
Considering that the dimension of the gene expression dataset is too high compared to the sample size, we conducted a pre-screening of the gene variables for the purpose of dimension reduction. We first selected 198 individual genes by using the univariate
Finally, we conducted gene and pathway analysis of the MM dataset using the overlap-HSVS method, which included the 21 candidate pathways as explanatory covariate groups and two demographic covariates, age and gender. We collected 5,000 posterior samples after a burn-in of 3,000 MCMC iterations. The total computational time was 1 hour and 10 minutes using a computer with a single core 3.4 GHz CPU and 4 GB of memory.
Results
Figure 2 depicts the posterior probabilities of pathway selection via our overlap-HSVS method based on the MCMC samples of the binary group indicators γ

Posterior probability of including each pathway in the model for the MM data.
Significant KEGG pathways selected for the MM data.

Figure 3 shows the 95% credible interval estimates of the individual coefficients for the genes lying in the three significant pathways, with panel (a) corresponding to the gene set in the galactose metabolism pathway, panel (b) to that in the cell cycle pathway, and panel (c) to that in the Wnt signaling pathway. We considered a gene to be significant if the 95% credible interval of its coefficient did not include zero. Based on the posterior samples of the coefficients, we flagged 28 genes as significant; we list them in Table 2. Note that the gene PFKM (phosphofructokinase) that was flagged as a member of the galactose metabolism pathway is also involved in glucose metabolism. Hence, further examination of the two metabolism pathways is potentially needed to reveal the oxidative energy metabolism in MM cells. In addition, we calculated the posterior probabilities of gene-specific effects as described in Section 2.3, with the effect size chosen as ɸ = 0.69, which corresponds to the log ratio of a two-fold change in the response when the predictor increases or decreases by a unit. Figure 4 plots 30 genes with the highest posterior probabilities of gene effects, most of which were flagged as significant by the 95% credible intervals, as expected.
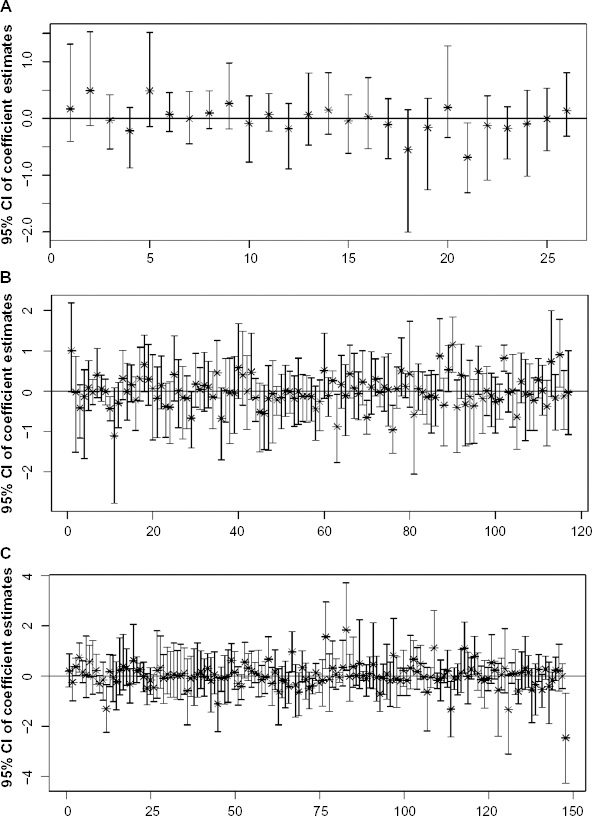
The 95% posterior credible intervals of the coefficients for the gene variables in the selected pathways: (A) galactose metabolism pathway; (B) cell cycle pathway; (C) Wnt signaling pathway.
Significant genes selected for the MM data.


The 30 genes with highest posterior probabilities of regression coefficients being greater than ɸ = 0.5 in the absolute value. The line patterns correspond to the pathways to which the genes belong: dotted lines for genes in the galactose metabolism pathway; solid lines for genes in the cell cycle pathway; dashed lines for genes in the Wnt signaling pathway; dot-dash lines for genes in both the cell cycle and Wnt signaling pathways.
Biological Interpretations
Among the selected genes,
We analyzed these 28 genes identified as significant through the use of Ingenuity Pathway Analysis (IPA) software (Ingenuity® Systems, www.ingenuity.com) in order to gain insight into the cellular functions associated with this set of genes. Our analysis found this set of genes to be related to three gene regulatory networks, as shown in Figure 5. These networks involve ERK1/2, Rb, TP53, NFKB, ER, and AKT as their main downstream targets or upstream regulators. These genes are known to play important roles in various cancers of different organs. One of the networks also involves the production of immunoglobulins, validating their association with the response variable. In addition, the IPA identified multiple canonical pathways that are significant to this set of genes, the top five of which include the cell cycle pathway, the Wnt signaling pathway, and two pathways that are related to rheumatoid arthritis. This agrees with the biological discovery that occurrence of MM may be increased in patients with rheumatoid arthritis. 30 These biological discoveries partially support our inferential results of the MM data analysis based on the overlap-HSVS method. The agreement between our inference and the biological discoveries also validates the serum free light chain ratio as a strong indicator for diagnosing and monitoring MM.

Three regulatory networks that involve the 28 flagged genes as identified by IPA. The nodes with filled color correspond to the flagged significant genes.
We also compared the inferential results to those of a popular variable selection method, the lasso, which carries out a selection process at only the individual gene level. The lasso method identified 39 genes that were considered to be related to the response. Without considering the group structure in variable selection, the lasso method identified 19 KEGG pathways in which the genes are involved to be relevant to the response out of the 21 total pathways under consideration. In summary, the overlap-HSVS method results in a more parsimonious model than the lasso method, with a smaller pool of significant genes and pathways selected for further biological investigation via future functional validations.
Real Data Based Simulation
We conducted a simulation study based on the inferential results to examine the performance of our method in the analysis of the MM data. We considered a data matrix of 1,387 predictors that have the same grouping structure as that in the MM dataset. The posterior median estimates of the parameters obtained by the overlap-HSVS method for the MM dataset were taken as the true values of the coefficients β and the error variance σ
2
. Hence, the coefficient vector includes 28 nonzero individual coefficients from three significant groups. Each column of the data matrix,
We generated 20 simulated datasets and applied the overlap-HSVS method as well the lasso method, as a comparison, to each dataset for simultaneous selection of pathways and genes. At the group level, the overlap-HSVS method has an average true positive rate (TPR) of 0.82 (≈2.45 pathways correctly selected) and an average false positive rate (FPR) of 0.03 (≈0.60 pathways falsely selected), with the respective standard errors being 0.20 and 0.04. In contrast, the lasso method always includes all groups in the model for all simulated datasets, with TPRs and FPRs both being 1.00. At the within-group level, the overlap-HSVS method has an average TPR of 0.60 (≈16.75 genes correctly selected) and an average FPR of 0.02 (≈30.80 genes falsely selected), with the respective standard errors being 0.34 and 0.02. In contrast, the lasso method has an average TPR of 0.94 (≈26.3 genes correctly selected) and an average FPR of 0.08 (≈103.75 genes falsely selected), with the respective standard errors being 0.03 and 0.01. The results show that our overlap-HSVS method can identify most groups as well as within-group individual variables while having significantly lower FPRs at both levels compared to the lasso method. The simulation results are consistent with the results of a detailed simulation study on the HSVS methods in Zhang et al. 16 suggesting that the overlap-HSVS/HSVS method is a strong variable selector at both the group and within-group levels.
Conclusion
In this paper, we developed the overlap-HSVS method for simultaneous selection of groups and variables within the groups when group overlap exists in the data structure. We applied the method to a MM dataset to select significant pathways and genes that are associated with clinical outcomes of MM. The method can be applied to a variety of structured data such as RNA-Seq data or data from patients of other cancer types, in which overlapping group structure exists among the predictor variables and group selection is of interest. We extended the HSVS method by introducing latent partial effect variables and corresponding weights to proportionally shrink the partial effects toward zero. The key idea underlying the model specification is that if the group of variables has an overall significant impact on the response, with less shrinkage, then the variables that are shared with other groups have more influence on the response through the contribution of this significant group. One weakness of the method brought about from this setup is that if the members of a group predominantly overlap with those of other groups, it may lead to instability in MCMC computations.
In coordination with the performance of the HSVS method, the overlap-HSVS method as an extension for analyzing overlapping group structures is a strong variable selection method, at both the group and within-group levels. Applied to the MM dataset, the method identified three significant pathways, including 28 significant genes, which were considered to be associated with the outcome measurements (the differences in the measurements of the two serum free light chain types in log ratio). Some of the genes and pathways we identified have been determined in biological investigations to be important biomarkers of MM. Our results support the hypothesis that the serum free light chain ratio can be an indicative measurement of the severity of MM, and is useful in diagnosing and monitoring this disease. We applied the method to the MM dataset for pathway and gene selection. The method can also be applied to a variety of structured data, in which overlapping group structure exists among the predictor variables and group selection is of interest. Examples include RNA-Seq data or gene expression data from patients of other cancer types, which we leave as potential future projects.
Although the overlap-HSVS method is able to deal with the overlapping group structures in the pathway-based analysis of MM gene expression data, the model treats the genes within a pathway as independent, assigning an independent normal-exponential prior to each coefficient. However, in reality, genes work in an interactive fashion. With developments in biological study, we have increased knowledge of the regulatory networks between genes within a pathway. In this situation, we seek to incorporate such prior biological information of the regulatory relationships between genes into the HSVS/overlap-HSVS methods. This will allow us to borrow strength in inference, not only from samples, but also from interactive genes. In addition, the incorporation of prior biological information of gene regulatory networks can take the high correlations among variables into consideration and thus result in more robust model selection and estimation. We leave this topic for our future studies.
Author Contributions
Conceived and designed the experiments: LZ, VB. Analyzed the data: LZ. Wrote the first draft of the manuscript: LZ, VB. Contributed to the writing of the manuscript: JM, JZ, RO, VB. Agree with manuscript results and conclusions: LZ, JM, JZ, RO, VB. Jointly developed the structure and arguments for the paper: LZ, VB. Made critical revisions and approved final version: LZ, JM, JZ, VB. All authors reviewed and approved of the final manuscript.