
Abstract
This study aimed to investigate the effect of EBI3 on radiation-induced immunosuppression of cervical cancer HeLa cells by regulating Treg cells through PD-1/PD-L1 signaling pathway. A total of 43 adult female Wistar rats were selected and injected with HeLa cells in the caudal vein to construct a rat model of cervical cancer. All model rats were randomly divided into the radiotherapy group (n = 31) and the control group (n = 12). The immunophenotype of Treg cells was detected by the flow cytometry. The protein expressions of EBI3, PD-1, and PD-L1 in cervical cancer tissues were tested by the streptavidin–peroxidase method. HeLa cells in the logarithmic growth phase were divided into four groups: the blank, the negative control group, the EBI3 mimics group, and the EBI3 inhibitors group. Western blotting was used to detect PD-1 and PD-L1 protein expressions. MTT assay was performed to measure the proliferation of Treg cells. Flow cytometry was used to detect cell cycle and apoptosis, and CD4+/CD8+ T cell ratio in each group. Compared with before and 1 week after radiotherapy, the percentages of CD4+T cells and CD8+T cells were significantly decreased in the radiotherapy group at 1 month after radiotherapy. Furthermore, down-regulation of EBI3 and up-regulation of PD-1 and PD-L1 were observed in cervical cancer tissues at 1 month after radiotherapy. In comparison to the blank and negative control groups, increased expression of EBI3 and decreased expressions of PD-1 and PD-L1 were found in the EBI3 mimics group. However, the EBI3 inhibitors group had a lower expression of EBI3 and higher expressions of PD-1 and PD-L1 than those in the blank and negative control groups. The EBI3 mimics group showed an increase in the optical density value (0.43 ± 0.05), while a decrease in the optical density value (0.31 ± 0.02) was found in the EBI3 inhibitors group. Moreover, compared with the blank and negative control groups, the apoptosis rates of Treg/CD4+T/CD8+T cells were decreased in the EBI3 mimics group, but the EBI3 inhibitors group exhibited an increase in apoptosis rate. In conclusion, over-expression of EBI3 could reduce the apoptosis of Treg/CD4+T/CD8+T cells and prevent radiation-induced immunosuppression of cervical cancer HeLa cells by inhibiting the activation of PD-1/PD-L1 signaling pathway.
Introduction
Globally, cervical cancer is considered to be one of the most frequently occurring cancers in female. 1 Recently, cervical cancer turns to be a ponderous burden on China and shows significant disparities within different regions. 2 Cervical cancer is proved to be caused by a persistent infection with high-risk human papillomavirus (HPV) types, and therefore, as an immunogenic disease, it requires a highly immunosuppressive microenvironment in order to progress and metastasize. 3 Previous study also confirms that immunological impairment can be found in cervical cancer patients. 4 In the recent researches of treatment strategies for cervical cancer, several optional objects have been found, such as macromolecules or nucleic acid–based therapeutics, monoclonal antibodies, and small-molecule inhibitors. 5 In the present, surgery, standard radiotherapy, and chemotherapy are the choices for most patients, but the clinical outcomes show significant variability. 6 There is a discovery that immunological path is associated with cervical cancer carcinogenesis, and exploring of new treatment modalities referring to immune system of cervical cancer may be an innovative strategy. 7 Therefore, finding new factors involving immunosuppression for the treatment of cervical cancer is of great importance.
Epstein–Barr virus–induced gene-3 (EBI3), encoding a 34-kDa secretory glycoprotein, has a similar structure of the p40 subunit of interleukin-12 (IL-12) and come into being IL-27 and IL-35 cytokines by binding subunits IL-27P28 or IL-12P35. 8 EBI3 has been considered to regulate T cell cytokine production and differentiation in the progression of inflammation and infection. 9 The T cell is recognized to be an important factor of autoimmune diseases as well as retaining immunological tolerance, and it is also indicated that over-expression of the EBI3 leads to an increase in Treg cells, which will cause reduction of systemic immunological response. 10 Another research on colitis shows that EBI3 can regulate innate immune cells, including macrophages and granulocytes, and EBI3 is recognized to play a vital role in the modulation of intestinal immune responses. 11 Researches also show that EBI3 expression plays an important prognostic role in disease outcome, including Burkitt lymphoma, lung cancer, especially cervical cancer.12–14 Consequently, EBI3 is speculated to be a potential regulator of T cell in cervical cancer immunosuppression. However, the specific mechanisms of how EBI3 works in cervical cancer immunosuppression have not been explored. Thus, this study will focus on the mechanisms, to verify that EBI3 may regulate the phenotype and function of Treg cells via programmed cell death 1(PD-1)/PD-L1 pathways, and providing theoretical basis for future clinical treatment of cervical cancer.
Materials and methods
Ethic statement
All the following operations were approved by the Animal Ethical Committee of the First Affiliated Hospital of Xinjiang Medical University.
Cell culture
The cervical cancer HeLa cell line was purchased from the Cell Bank of Shanghai Institute of Cell Biology of the Chinese Academy of Sciences (Shanghai, China). After thawing, the HeLa cells were cultured in Dulbecco’s minimum essential medium (DMEM) with 10% fetal bovine serum and then incubated in a 5% CO2 incubator (Heraeus Holding, Germany) at 37°C. The HeLa cells in the logarithmic growth phase were digested by 0.25% pancreatin, and DMEM was used to terminate the digestion. Cells were centrifuged at 1200 r/min for 5 min, followed by the supernatants removal, suspension, and sediment.
Animal model establishment and grouping
A total of 43 adult male Wistar rats with a mean weight of 286.5 g were selected. The experimental rats were obtained from the Animal Laboratory of Clinical Research Institute of the First Affiliated Hospital of Xinjiang Medical University. The rats were treated with immunosuppression: 200 mg/kg cytarabine was injected subcutaneously, and dexamethasone (2.5 mg per one) was done intraperitoneally the next day for successive 3 days. After the injection, the rats were placed in a clean environment with water (containing 1 g/L erythromycin tablets) and food for 3 days, after which they were injected with 2.5 × 10⁸/L suspension of HeLa cells in the caudal vein to construct a rat model of cervical cancer. The tumor growth in rats was observed once every other day. Once the nodule of the tumor grew to 0.5 mm in diameter, the size of the tumor was measured. The rats were randomly divided into the radiotherapy group (n = 31) and the control group (n = 12).
Detection of the phenotype of Treg cells by the flow cytometry
About 2-mL blood was sampled from tail veins of the rats in the radiotherapy and control groups before radiotherapy, 1 week after radiotherapy, and 1 month after radiotherapy. The sampled blood was treated with the anticoagulant of ethylenediaminetetraacetic acid (EDTA) and inspected immediately. The peripheral blood mono-nuclear cells (PBMCs) were isolated by Ficoll density gradient centrifugation; 1 × 10⁶ cells were put into each Pitot tube with serum sealed. Mouse anti-human antibodies CD4-FITC and CD8-FITC were labeled. The sampled blood was fully mixed and incubated without light at room temperature for 30 min, and then added with 1 mL of low osmotic solution of broken red blood cell for full mixing, centrifuged after remained for 5 min, and washed twice with phosphate-buffered saline (PBS) solution containing 0.09% NaN3, and re-suspended with PBS solution containing 0.09% NaN3. The percentages of CD4+ and CD8+T cells were measured by flow cytometry.
Streptavidin–peroxidase immunohistochemical staining
The tissues collected before radiotherapy, 1 week after radiotherapy, and 1 month after radiotherapy were sliced into paraffin sections. The protein expressions of EBI3, PD-1, and PD-L1 were detected by the streptavidin–peroxidase (SP) method. The paraffin sections were placed in a 37°C incubator overnight and dehydrated. Sodium citrate (pH 6.0; 0.01 M) was used for antigen retrieval. The paraffin sections were incubated in 3% hydrogen peroxide for 10 s to inactivate endogenous enzyme and sealed in serum sealant at room temperature for 10 min, with mouse anti-human antibody EBI3 (1:100), PD-1 (1:100), and PD-L1 (1:100) added (all were obtained from Bioss Antibodies, Beijing, China). PBS was used to replace primary antibody for control. They were incubated overnight at 4°C and rewarmed at 37°C for 1 h, and then added with biotinylation goat anti-mouse IgG (ab6785; Abcam, Cambridge, MA, USA) for 30 min of incubation at 37°C, after which streptomyces antibiotics enzyme (from Maixin Biological Technology Development, Fuzhou, China) was added for the incubation at 37°C for 30 min. They were stained by diaminobenzidine (DAB) at room temperature for 3–5 min, and the cell nuclear was counter-stained by hematoxylin and mounted by neutral resins. In the end, they were observed under microscopes and the images were collected. Two experienced doctors determined the results with the reference of Fromowitz et al. 15 Staining intensity: colorless, scoring 0; light yellow, scoring 1; brownish yellow, scoring 2; and chocolate brown, scoring 3. Percentage of positive cells: <5%, scoring 0; 5%–25%, scoring 1; 26%–50%, scoring 2; 51%–75%, scoring 3; and >75%, scoring 4. The sum of two results: <2 scores, negative (−); 2–3 scores, weak positive (+); 4–5 scores, medium positive (++); and >6 scores, strong positive (+++).
Cell transfection and grouping of HeLa cells
The full-length human EBI3 gene was acquired from GenBank, and primers of EBI3 were designed (forward, 5′-CGGGACACCTGTTGGAG-3′; reverse, 5′-CGGGACACCTGTTGGAG-3′), which were then sent to Shanghai GenePharma Co, Ltd, for gene synthesis. And EBI3 small interfering RNA (siRNA; sc-39410; Santa Cruz Biotechnology Co, Ltd) was bought. The pcDNA3.1-EBI3-FLAG over-expressed plasmid vector and pRNA-Lenti-EBI3-EGFP siRNA plasmid vector were constructed to transfect Escherichia coli DH5a, which was identified by polymerase chain reaction (PCR), double digestion, and sequencing. HeLa cells in the logarithmic growth phase were divided into four groups: the blank group (transected with 4-µg empty plasmid), the negative control (NC) group (treated with 0.1-mol/L PBS), the EBI3 mimics group (transected with 4-µg pcDNA3.1-EBI3-FLAG plasmid), and the EBI3 inhibitors group (transected with 4-µg pRNA-Lenti-EBI3-EGFP plasmid).
Western blotting
Western blotting was used to detect PD-1 and PD-L1 protein expressions in HeLa cells. The collected cells were washed with PBS for 2–3 times and then added with sodium dodecyl sulfate polyacrylamide gel electrophoresis (SDS-PAGE) sample loading buffer at the ratio of 1 × 10⁷/mL. After 10-min boiling, they were examined by SDS-PAGE electrophoresis to separate proteins with different molecular weights. Gel was transferred onto nitrocellulose membrane and sealed by 5% skim milk for 1 h, after which they were incubated at 37°C for 1 h with mouse anti-human antibody PD-1 (1:200, ab52587; Abcam) and PD-L1 (1:200, ab210931; Abcam) correspondingly. Tris-buffered saline/Tween 20 (TBST) buffer (10-Mm Tris-HCl, pH 7.5, 100-Mm NaCl, 1 g/L Tween 20) was used to wash the cells up. Goat anti-mouse IgG (ab6785; Abcam, Cambridge, MA, USA) secondary antibody labeled with horseradish peroxidase was added for a 2-h-long reaction, and then, they were washed by TBST buffer for four times. Electrochemiluminescence (ECL) was used for exposure and photoresist development and gel imaging system (Bio-Rad, Hercules, CA, USA) for photo taking to analyze band recovery value.
MTT proliferation assay
Treg cells were isolated and then treated with density gradient centrifugation through nylon wool column and then inoculated in 24-well plates. Polyhydroxyalkanoates (PHAs) were added to stimulate T cells for 24 h to activate them. They were incubated together with the cells in the EBI3 mimics group, EBI3 inhibitors group, NC group, and blank control group for 72 h with 5% CO2 and at 37°C. Treg cells in each group were collected and counted. Cell density was adjusted to 1 × 10⁶/mL, and they were inoculated in 96-well plates with 200 µL per well. In each group, three parallel wells were made, and Treg cells were centrifuged at 2000 r/min for 10 min with supernatants removed. In each well, 20-µL MTT (5 mg/mL) and 180-µL serum-free DMEM were added, and then, cells were incubated in 5% CO2 for 4 h. The 96-well plates were taken out and centrifuged at 1000 r/min for 10 min, and then the supernatants removed. Totally 100-µL dimethyl sulfoxide (DMSO) was added and mixed completely. Finally, absorbance at 490 nm was measured by enzyme-labeling measuring instrument (Sigma–Aldrich, St. Louis, MO, USA).
Detection of cell cycle and apoptosis, and CD4+/CD8+ T cell ratio by flow cytometry
Co-culture of fusion protein PD-L1 and T cells was detected by flow cytometry. T cells were fixed by 75% precooling alcohol. After distribution, they were put into a freezer of 4°C overnight. RNA enzyme and propidium iodide (PI) were added to stain the cells for 45 min. The T cell cycle was detected by flow cytometry. Annexin V-PE/7-AAD, mouse anti-human CD4-FITC antibody and CD8-FITC antibody, and anti-human CD3-PE antibody (eBioscience, San Diego, CA, USA) were added. Then, they were stained without light for 15 min and washed with PBS for three times. Cell apoptosis, necrosis rate, and the ratio of CD8+T cells and CD4+T cells as well as the proportion of CD4+T cells and CD8+T cells accounting for CD3+T cells were detected by flow cytometry.
Statistical analysis
SPSS 19.0 software (SPSS Inc, Chicago, IL, USA) was employed for data analysis, in which measurement data were shown by mean ± SD. The comparison among groups was tested by analysis of variance (ANOVA), and that between groups was tested by least-significant difference t (LSD-t). The correlations between EBI3, PD-1, and PD-L1 expressions with the phenotype of Treg cells were analyzed by Spearman rank correlation analysis. p < 0.05 was significantly different.
Results
The percentages of CD4+T cells and CD8+T cells in rats before and after radiotherapy
As shown in Table 1, the results showed that the percentages of CD4+T cells and CD8+T cells had no significant difference before and after radiotherapy in the control group (all p > 0.05). There were also no differences in the percentages of CD4+T cells and CD8+T cells in the radiotherapy group before and 1 week after radiotherapy (all p > 0.05). However, compared with before and 1 week after radiotherapy, the percentages of CD4+T cells and CD8+T cells were significantly decreased in the radiotherapy group at 1 month after radiotherapy (all p < 0.05). Furthermore, the percentages of CD4+T cells and CD8+T cells in the radiotherapy group were obviously lower than those in the control group at 1 month after radiotherapy (all p < 0.05).
The percentages of CD4+T cells and CD8+T cells in rats before and after radiotherapy.

p < 0.05 compared with the control group; #p < 0.05 compared with before radiotherapy; Δp < 0.05 compared with 1 week after radiotherapy.
Expressions of EBI3, PD-1, and PD-L1 in rats before and after radiotherapy
The results of immunohistochemistry indicate that the expressions of EBI3, PD-1, and PD-L1 before radiotherapy had no differences with those at 1 week after radiotherapy (all p > 0.05). Comparing with before radiotherapy and 1 week after radiotherapy, the expression of EBI3 decreased significantly while the expressions of PD-1 and PD-L1 increased significantly at 1 month after radiotherapy (all p < 0.05; Figure 1). The correlation analysis of EBI3, PD-1, and PD-L1 expressions with the phenotype of Treg cells indicated that the expression of EBI3 was positively correlated with the percentages of CD4+T cells and CD8+T cells (r = 0.723, p < 0.001; r = 0.413, p = 0.021). In contrast, the expressions of PD-1 and PD-L1 exhibited negative correlations with the percentages of CD4+T cells and CD8+T cells (all p < 0.05).

The expressions of PD-L1, PD-1, and EBI3 in rats before and after radiotherapy (×200).
Expressions of EBI3, PD-1, and PD-L1 in HeLa cells after transfection models
Compared with the blank and NC groups, the expression of EBI3 was significantly up-regulated, and the expressions of PD-1 and PD-L1 were significantly down-regulated in the EBI3 mimics group, while opposite expressions of EBI3, PD-1, and PD-L1 were found in the EBI3 inhibitors group (all p < 0.05; Figure 2). In addition, there was no obvious difference in the expressions of PD-1 and PD-L1 between the blank and NC groups (all p > 0.05).

The expressions of EBI3, PD-1, and PD-L1 in HeLa cells detected by Western blotting: (a) the blank group, (b) the negative control group, (c) the EBI3 mimics group, and (d) the EBI3 inhibitors group.
The proliferation of Treg cells in each group
In comparison with the blank and NC groups, EBI3 mimics group showed an increase in the optical density (OD) value (0.43 ± 0.05), while a decrease in the OD value (0.31 ± 0.02) was found in the EBI3 inhibitors group (all p < 0.05; Figure 3). The OD values in the blank and NC groups had no significant difference (p > 0.05).

The proliferation of Treg cells after co-culturing for 72 h detected by MTT assay: (a) the blank group, (b) the negative control group, (c) the EBI3 mimics group, and (d) the EBI3 inhibitors group.
Cell cycle and apoptosis, and CD4+/CD8+ T cell ratio in each group
There was no significant difference in cell cycle among the four groups (all p > 0.05). Comparing with the blank and NC groups, the apoptosis rates of Treg cells, CD4+T cells, and CD8+T cells dropped in the EBI3 mimics group, while the apoptosis rates of these cells rose in the EBI3 inhibitors group (both p < 0.05). Among the four groups, the apoptosis rate of CD4+T cells was significantly lower than that of CD8+T cells, while the proportion of CD4+T cells in CD3+T cells was obviously higher than that of CD8+T cells (both p < 0.05), while the proportions of CD4+T and CD8+T cells accounting for CD3+T cells had no clear difference (both p > 0.05). Also, there was no significant difference in cell cycle and apoptosis, and CD4+/CD8+ T cell ratio between the blank and NC groups (all p > 0.05; Figures 4–7).

Flow cytometry of T cells cycle after cell transfection: (a) the blank group, (b) the negative control group, (c) the EBI3 mimics group, and (d) the EBI3 inhibitors group.
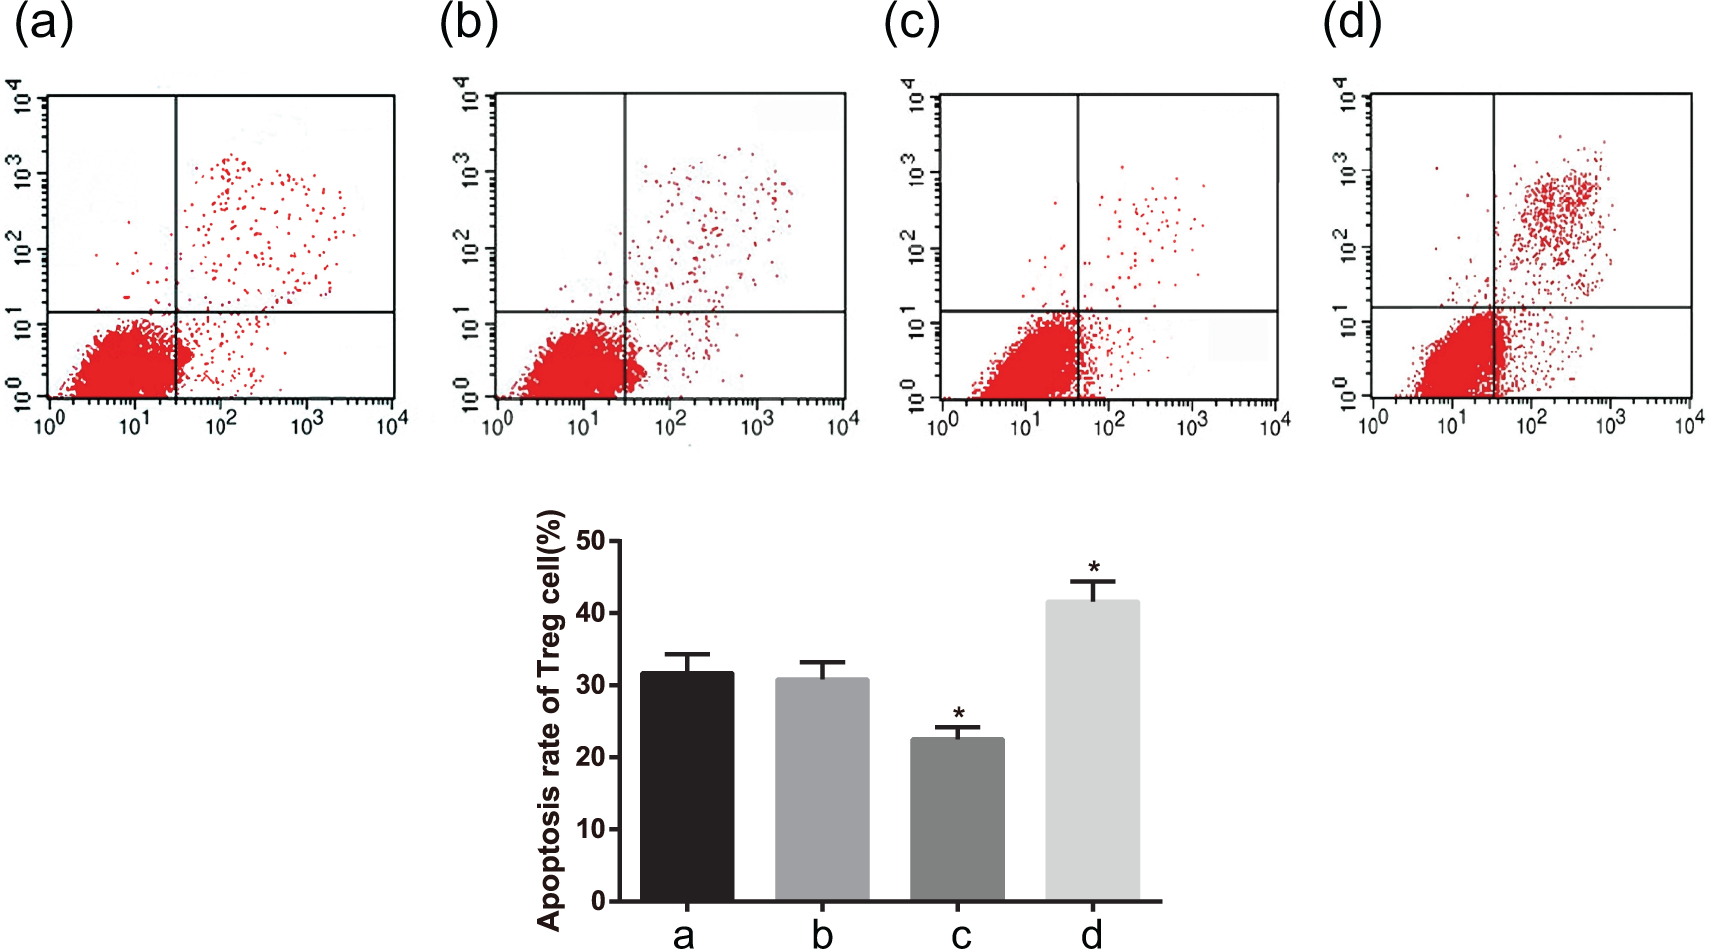
The apoptosis rate of Treg cells after cell transfection detected by flow cytometry: (a) the blank group, (b) the negative control group, (c) the EBI3 mimics group, and (d) the EBI3 inhibitors group.

The apoptosis rates of CD4+T cells and CD8+T cells after cell transfection detected by flow cytometry: (a) the blank group, (b) the negative control group, (c) the EBI3 mimics group, and (d) the EBI3 inhibitors group.

The proportions of CD4+T cells and CD8+T cells accounting for CD3+T cells after cell transfection detected by flow cytometry: (a) the blank group, (b) the negative control group, (c) the EBI3 mimics group, and (d) the EBI3 inhibitors group.
Discussion
Worldwide, almost half a million new cervical cancer cases are diagnosed per year, about half of which are fatal. 16 It has threatened women’s lives for years. Thus, to figure out the relevant signaling pathway could be significant to find out a new molecular target for more effective treatment against cervical cancer.
In this study, at 1 month after the radiotherapy, the expressions of Treg and EBI3 were down-regulated, while those of PD-1 and PD-L1 were up-regulated. Besides, the phenotype of Treg was positively correlated with the expression of EBI3 and showed negative correlations with the expressions of PD-1 and PD-L1. Treg is a subset of CD4+Th cells, which are essential regulators of immune responses and inflammatory diseases. 17 Treg is a key factor to dampen effector T cell responses and therefore represents one of the main obstacles to effective antitumor responses, 18 and increased Treg has been observed in many cancer tissues’ microenvironment and peripheral blood. 19 Radiotherapy suppresses tumor growth via up-regulation of miR-545 expression, which could effectively inhibit CCL-22 recruiting Treg. 20 IL-35 is an anti-inflammatory cytokine, which appears to be mainly from Treg in tumor microenvironment and contributes to Treg suppression, and EBI3 is a subunit of it together with p. 35. 21 Therefore, as Treg was down-regulated by radiotherapy, the expression of EBI3 also decreased accordingly.
Besides, the result showed that the expressions of PD-1 and PD-L1 were significantly up-regulated after the radiotherapy. PD-1 is an inhibitor receptor expressed by T cells on activation that plays a critical role in the maintenance of peripheral tolerance, and two PD-1 ligands have been identified: PD-L1 and PD-L2. 22 Up-regulation of PD-L1 is common in tumors and has been correlated with poor prognosis and tumor progression.23–25 Several studies have shown that the PD-1/PD-L1 axis plays critical roles in compromised tumor immunity.26–28 Radiotherapy can lead to dendritic cell (DC) recruitment, tumor cell deoxyadenosine monophosphate (DAMP) release, and type I interferon (IFN)-dependent cross-priming of tumor-specific CD8+T cell responses, and lead to increased tumor cell expression of PD-L1 through CD8+T cell production of IFN-γ. 29 PD-1 interacts with PD-L1 for transmitting a co-inhibitory signal so as to downstream molecular events and further limits the activated T cell proliferation, contributing to tissue protection against severe injury with a vigorous immune response. 30 Besides, Tregs overexpress the heterotrimeric IL-2R, consisting of the α, β, and common γ chains. These chains induce different signaling pathways exampled by the resulting phosphorylation of STAT-5, which then translocates to the nucleus to activate gene transcription and supports cellular survival and proliferation. 31 Nevertheless, PD-1 could limit STAT-5 phosphorylation by the capture (via the highly expressed IL-2R) of high amounts of paracrine IL-2 produced by CD25+Teffs, thus negatively regulating Treg.32–34 It justifies the study showing a negative correlation of Treg with the PD-1/PD-L1 axis.
In addition, the study showed that the expressions of PD-1 and PD-L1 were significantly down-regulated in the EBI3 mimics group; thus, apoptosis rates of T cells, CD4+T cells, and CD8+T cells decreased. As mentioned before, Treg is in negative correlation with PD-1/PD-L1, and EBI3 is a subunit of IL-35, which is mainly from Treg in tumor microenvironment; therefore, over-expression of EBI3 means decrease in PD-1and PD-L1. Being a co-inhibitor of T cells, PD-L1 could recruit tyrosine phosphatase SHP-2 with joint effect of PD-1, leading to the dephosphorylation of the key molecule of T cell receptor (TCR) pathway, including phosphatidylinositol 3-kinase (PI3K), which further restricts apoptosis-inhibiting gene Bcl-xl and causes apoptosis of T, CD4+T, and CD8+T cells.35,36 This result has been confirmed by an existed study that decreased PD-1 expression can cause apoptosis of T, CD4+T, and CD8+T cells. 37 In addition, the result showed that there was a less apoptosis on CD4+T than on CD8+T cell with CD4+T cell having more percentage of CD3+T cell. Fractionated radiotherapy can prime antitumor CD8+T cell responses, but these are attenuated by the PD-1/PD-L1 signaling pathway and early inhibition of the pathway may be critical for the generation of durable effective antitumor responses; therefore, the expression of PD-1 should be consistently higher on CD8+T versus CD4+T cells. 29
In summary, the study demonstrated that the over-expression of EBI3 could reduce the apoptosis of Treg/CD4+T/CD8+T cells and prevent radiation-induced immunosuppression of cervical cancer HeLa cells by inhibiting the activation of PD-1/PD-L1 signaling pathway. All these suggest that the combination of radiotherapy and immunotherapy may be a promising approach for the treatment against cervical cancer.
Footnotes
Acknowledgements
S.A.Z. and H.E.X.D.N are regarded as the first co-authors.
Declaration of conflicting interests
The author(s) declared no potential conflicts of interest with respect to the research, authorship, and/or publication of this article.
Funding
The study was supported by the Key Laboratory of Infection and Cancer running by Urumqi Science and Technology Bureau (H111313001).