
Abstract
This study assessed RNA-binding motif 10 expression in lung adenocarcinoma tissues and examined the role and mechanism of RNA-binding motif 10 in the regulation of lung adenocarcinoma malignancy. Lung adenocarcinoma and corresponding adjacent non-tumor lung tissues from 41 patients were subjected to reverse transcription-polymerase chain reaction and Western blot assessment to detect RNA-binding motif 10 expression. Recombinant lentivirus carrying RNA-binding motif 10 complementary DNA was used to infect lung adenocarcinoma cell lines, A549 and H1299 cells. Complementary DNA microarray was used to profile RNA-binding motif 10–regulated genes. Levels of RNA-binding motif 10 messenger RNA and protein were significantly lower in lung adenocarcinoma tissues than those in paired non-tumor tissues (p < 0.001). Reduced RNA-binding motif 10 expression was found to be associated with an advanced tumor stage. RNA-binding motif 10 overexpression inhibited viability and colony formation capacity of lung adenocarcinoma cell lines and induced cell-cycle arrest at G0/G1 phase in A549 cells and at S phase in H1299 cells. Complementary DNA microarray analysis identified 304 upregulated and 386 downregulated genes induced by RNA-binding motif 10 overexpression, which may be involved in cancer, focal adhesion, peroxisome proliferator-activated receptor–regulated gene pathway, cytokine–cytokine receptor interaction, mitogen-activated protein kinase signaling, complement and coagulation cascades, platelet amyloid precursor protein pathway, extracellular matrix-receptor interaction, and small cell lung cancer–related genes. Expression of FGF2, EGFR, WNT5A, NF-κB, and RAP1A was downregulated, whereas expression of AKT2, BIRC3, and JUN was upregulated. RNA-binding motif 10 messenger RNA and protein were reduced in lung adenocarcinoma tissues, and RNA-binding motif 10 overexpression inhibited lung adenocarcinoma cancer cell malignant behavior in vitro. Molecularly, RNA-binding motif 10 regulates many gene pathways involving in the tumor development or progression.
Introduction
Lung cancer is the leading cause of cancer-related mortality worldwide, accounting for more than 1.3 million deaths annually.1–3 Histologically, lung cancer is divided into small cell lung cancer (SCLC) and non–small cell lung cancer (NSCLC), which is further subdivided into squamous cell carcinoma, adenocarcinoma, and large cell carcinoma. NSCLC contributes up to 85% of all lung cancer cases. 2 To date, most NSCLC patients are still diagnosed at advanced stage, and clinical significance of the surgery is often challenging due to the poor 5-year survival rate. Adenocarcinoma is one of the major pathological lung cancer subtypes, accounting for 41%–40% of all lung cancer cases, 2 which has yet an overall 5-year survival rate of only 18.2%. 1 Thus, there is an urgent need to identify and evaluate novel biomarkers for early detection of lung cancer, as well as predicting prognosis and treatment response of NSCLC patients.
RNA-binding motif 10 (RBM10), also called S1-1, was first identified and cloned by Nagase et al. in 1995 and mapped to X chromosome p11.23. RBM10 is a member of the RNA-binding motif (RBM) gene family, known to be involved in pre-mRNA (messenger RNA) splicing and post-transcriptional regulation. 4 RBM10 can be alternatively spliced to produce RBM10 RNA variant 1 and variant 2, which encode nuclear RNA-binding proteins containing zinc finger motifs, a G-patch, and two RNA Recognition Motif (RRMs) to regulate gene transcription, mRNA alternative splicing, and stabilization of various genes, including apoptosis-related Fas and Bcl-x genes. 5 RBM10 is widely expressed in a variety of cells and tissues,6,7 and altered RBM10 expression has been reported in TARP syndrome (talipes equinovarus, atrial septal defect, Robin sequence, and persistent left superior vena cava syndrome), X-linked disorder,8,9 and various human cancers, such as breast cancer,10–12 pancreatic cancer, 13 and metastatic melanoma. 14 In lung cancer, a comprehensive molecular profiling study of lung adenocarcinoma demonstrated that mutations of epidermal growth factor receptor (EGFR) were more frequent in females, whereas mutations in RBM10 were more common in male patients. 15 Moreover, RBM10 may function as a tumor suppressor gene in various human cancers. 16 In this study, we first assessed RBM10 expression in lung adenocarcinoma tissues and then explored the role of RBM10 in the regulation of lung adenocarcinoma malignancy and the underlying molecular mechanism in vitro.
Materials and methods
Tissue specimens
In this study, 41 lung adenocarcinoma patients who underwent surgery in the Second Affiliated Hospital of Jilin University (Changchun, China) between March 2014 and April 2015 were included. All patients were diagnosed with a primary lung adenocarcinoma according to World Health Organization lung cancer criteria and staged according to lung cancer TNM (T - the size of original tumor, N - nearly lymph nodes, M - distant metastasis) system. 17 Patients did not receive any chemo- or radiotherapy before surgery. This study was approved by the Institutional Review Board of the Second Affiliated Hospital of Jilin University (Changchun, China), and all participants provided written informed consent. Lung adenocarcinoma and corresponding adjacent non-tumor lung tissues were collected during the surgery and snap-frozen in liquid nitrogen and then stored at −80°C until use. During this study, all cases were re-reviewed by pathologists to confirm pathological diagnosis of healthy and cancerous tissues.
Cells culture
Human adenocarcinoma cell lines, A549 and H1299, were obtained from the Chinese Academy of Medical Sciences (Beijing, China) and cultured in RPMI-1640 (Invitrogen, Carlsbad, CA, USA) supplemented with 10% fetal bovine serum and 100 U/mL penicillin and 0.1 mg/mL streptomycin (Invitrogen) at 37°C in a humidified atmosphere containing 5% CO2.
Reverse transcription-polymerase chain reaction
Total RNA was isolated from tissue specimens or cells using a Trizol reagent (Invitrogen) according to the manufacturer’s instructions. After spectrophotometric quantification, RNA samples were reverse transcribed into complementary DNA (cDNA) using a TaKaRa RNA PCR Kit (TaKaRa, Shiga, Japan) according to the manufacturer’s protocol. Semiquantitative polymerase chain reaction (PCR) amplification was then performed using the Platinum Taq Polymerase (Invitrogen) in the iCycler thermal cycler (Bio-Rad, Hercules, CA, USA) at 95°C for 5 min, followed by 40 cycles of 95°C for 40 s, 64°C for 40 s, and 72°C for 1 min and a final extension at 72°C for 10 min. GAPDH mRNA was amplified for 41 cycles with annealing temperature at 55°C. Primers used were RBM10, 5′-TGGCTGGGAAGTGAAACGGA-3′ and 5′-GGATGTTGAGGGAGTGCTGA-3′ according to a previous study 12 or GAPDH, 5′-AGAAGGCTGGGGCTCATTTG-3′ and 5′-AGGGGCCATCCACAGTCTTC-3′. PCR products were then separated by electrophoresis in 1% agarose gels containing ethidium bromide and visualized by a GIS Gelatum imaging system (Tanon, Shanghai, China). Absolute gene transcription was compared to that of GAPDH. Experiments were carried out in triplicate and repeated at least three times with similar results.
Protein extraction and Western blot
Total cellular protein was extracted from lung tissues or cell lines according to a previous study. 12 Protein concentrations in the supernatants were quantified using the DC Protein Assay (Bio-Rad), and aliquots of each protein sample (50 µg) were added to sample buffer (10% glycerol, 0.7 M beta-mercaptoethanol (b-ME), 3% sodium dodecyl sulfate (SDS), 62-mM Tris-HCl, pH 6.8), boiled for 10 min and separated in 12% sodium dodecyl sulfate-polyacrylamide gel electrophoresis (SDS-PAGE), and then transferred onto polyvinylidene fluoride (PVDF) membranes (Millipore, Billerica, MA, USA). For Western blotting, membranes were incubated in 50 g/L skimmed non-fat milk/Tris-buffered saline and Tween-20 solution (TBST) at room temperature for 1 h and then incubated overnight at 4°C with a primary antibody. Primary antibodies used in this study were as follows: rabbit anti-human RBM10 antibody (Cat #ab26046, 1:500; Abcam, Cambridge, MA, USA), a mouse monoclonal anti-β-actin antibody (1:2000; Proteintech Group, Chicago, IL, USA), a mouse monoclonal anti-FLAG antibody (Cat# F1804, 1:3000; Sigma, St. Louis, MO, USA), an anti-EGFR antibody (Cat #ab52894, 1:1000; Abcam), an anti-cIAP2 (BIRC3) antibody (Cat #ab32059, 1:1000; Abcam), an anti-IKB-alpha (NFKBIA) antibody (Cat #ab7217, 1:1000; Abcam), an anti-c-Jun antibody (Cat #ab32137, 1:200; Abcam), an anti-FGF2 antibody (Cat #ab106245, 1:500; Abcam), an anti-Wnt5a antibody (Cat #2392, 1:500; Cell Signaling Technology, Danvers, MA, USA), an anti-RAP1A antibody (Cat #ab55741, 1:2000; Abcam), and an anti-AKT2 antibody (Cat #ab175354, 1:1000; Abcam). On the next day, membranes were washed with TBST three times for 10 min each and then further incubated with a corresponding horseradish peroxidase–conjugated secondary antibody from Proteintech Group or from Santa Cruz Biotechnology (Cat #sc-2004 and #sc-2005; Santa Cruz, CA, USA) at a dilution of 1:2000 to 5000 for 1 h at the room temperature. After washing three times for 10 min each with TBST, protein bands were detected using an Amersham ECL Plus Western Blotting Detection Reagents (GE Healthcare, Fairfield, CT, USA) and quantified using Quantity One software (Bio-Rad). The cutoff value for high versus low RBM10 expression was 1.6 in tumor tissues compared to adjacent normal tissues. The reproducibility of the experiments was repeated at least three times.
Construction of lentiviral vectors and production of lentivirus
Lentiviral vector carrying the green fluorescence protein (GFP) pGC-LV-GV358-GFP was used as the backbone and a control to monitor infection efficiency in A549 cells and H1299 cells. Recombined pGC-LV-GV358-GFP vector carrying V-RBM10 (14297-1) (NM LVKL14297-1) cDNA and pGC-LV-GV358-GFP with a scrambled control sequence CON238 (NM KL8781-1) were constructed by Genechem Company (Shanghai, China). These vectors were transfected into human fetal kidney (293H) cells using Lipofectamine 2000 (Invitrogen) according to manufacturer’s instructions. Cell culture medium containing lentivirus particles was harvested 48 h post transfection, passed through a 0.45-µm filter (Millipore), and the resulting lentivirus particles were stored at −80°C until use.
Lentivirus infection of lung cancer cells
We first assessed the multiplicity of infection (MOI) in cells. We found that the efficiency of lentiviral infection (averaged proportion of GFP-expressing cells versus total cell count) was approximately 80% at an MOI of 20 (Figure 2); thus, we chose an MOI of 20 for our in vitro experiments. Briefly, 5 × 10⁴ A549 or H1299 cells were seeded into six-well plates containing an antibiotic-free medium and incubated overnight. The following day, lentivirus particles with an MOI of 20 were incubated with 95-µL RPMI-1640 containing 10% FBS and added into each well. Cells were then cultured for 96 h and then converted to serum-free RPMI-1640 to select stable cell clones according to a previous study. 18 Following this, reverse transcription-polymerase chain reaction and Western blot were performed to confirm stable expression of RBM10 in these stable cells, which were used for the following experiments.
Cell viability MTT assay
To assess the effects of RBM10 expression on regulation of cell viability, we performed the MTT assay. Briefly, 4-day lentivirus-infected lung cancer cell lines were seeded into 96-well plates at a density of 2000 cells per well and grown up to 5 days. At the end of each time point, 20 µL of 4,5-dimethylthiazol-2-yl-2,5-di-phenyltetrazolium bromide (MTT; 5 mg/mL) was added into each well and cells were incubated for an additional 4 h at 37°C. Later, culture medium was replaced by 150 µL of dimethyl sulfoxide (DMSO; Sigma) and incubated for 30 min. Absorbance was measured using a plate reader (Bio-Rad) at 570 nm of wavelength. Experiments were in triplicate and repeated at least twice. The data were summarized as percentage of control cells.
Colony formation assay
A549 and H1299 cells were seeded into a six-well plate at a density of 800 cells/well and grown overnight and then infected with LV-RBM10 (LVKL14297-1) or CON238 (KL8781-1). Cells were allowed to form colonies at the fourth day and then fixed with 4% paraformaldehyde for 10 min, stained with Giemsa for 10 min, and then washed three times with ddH2O. Cells were photographed with a digital camera, and cell numbers of over 50 cells/colony were counted. The assay was performed in triplicate and repeated at least twice.
Flow cytometry cell cycle assay
Cells infected with LV-RBM10 (LVKL14297-1) or CON238 (KL8781-1) for 5 days were sub-cultured in six-well plates. At the indicated time points, cells were harvested by trypsinization, fixed with 70% ice-cold ethanol, and stained with 1 mL of propidium iodide (Cat #P4170; 12 mg/mL stock solution; Sigma) in phosphate-buffered saline and 10-µL ribonuclease (Cat #EN0531; 10 mg/mL; Fermentas, Waltham, MA, USA) on ice. Cells were then analyzed on a flow cytometer (FACSCalibur; BD Biosciences, San Jose, CA, USA). The assay was performed in triplicate and repeated at least for two times.
cDNA microarray assay
To profile expression of RBM10-regulated genes, we first stably infected lentivirus carrying RBM10 cDNA or control into A549 cells. The cells were subjected to RNA isolation, as above, and quantified using NanoDrop 2000 (Thermo, Waltham, MA, USA) and quality-checked with Agilent Bioanalyzer 2100 (Agilent Technologies, Santa Clara, CA, USA). After, qualified RNA samples were labeled with the GeneChip 3′ IVT express kit (Affymetrix, Santa Clara, CA, USA) and then hybridized to Affymetrix GeneChip Primeview Human cDNA microarray according to the manufacturer’s protocols. Experiments were conducted by Genkai Gene (Shanghai, China). Following this, data were analyzed using GeneChip Scanner 3000 (Affymetrix). Gene alterations after RBM10 expression were set at 1.5-fold and p < 0.05 versus control cells.
The gene ontology and KEGG pathway analysis
RBM10-regulated genes were then subjected to gene ontology (GO) and Kyoto Encyclopedia of Genes and Genomes (KEGG) pathway and network analysis according to instructions provided by the following two websites: http://geneontology.org/page/go-enrichment-analysis and http://www.genome.jp/kegg/pathway.html.
Statistical analysis
A paired-samples Wilcoxon signed-rank test was performed to compare the level of RBM10 protein between lung adenocarcinoma and adjacent normal tissues. Pearson’s chi-square test was utilized to determine the association of clinicopathological data with RBM10 protein level. The in vitro data were summarized as the mean ± standard deviation (SD) and analyzed using Student’s t test. All statistical analyses were performed using SPSS software, version 17.0 (SPSS, Chicago, IL, USA). A p value equal to or less than 0.05 was considered statistically significant.
Results
RBM10 expression was reduced in lung adenocarcinoma tissues
Expression of RBM10 mRNA and protein in 41 paired lung adenocarcinoma and adjacent normal tissue specimens was detected. RBM10 mRNA was expressed in 36 paired non-tumor tissue samples but undetectable in tumor tissues (Figure 1(a)). RBM10 protein was expressed in all 41 non-tumor tissues, while it was reduced in 27 of 41 tumor tissue samples (Figure 1(b) and (c)). Then the association between RBM10 expression and clinicopathological data from patients was analyzed. The results showed that reduced RBM10 protein levels were associated with advanced tumor stages (p < 0.05) but not with gender, age, tobacco smoking, or tumor lymph node metastasis (Table 1).

Reduced expression of RBM10 mRNA and protein in human lung adenocarcinoma tissues. (a) RT-PCR. Level of RBM10 mRNA was assessed using RT-PCR in lung adenocarcinoma (T) and paired non-tumor (N) tissues. PCR detected two variants of RBM10 mRNAs. M, molecular weight marker. (b) Western blot. RBM10 protein was analyzed in T and N using Western blot and quantified using Quantity One software in the graph (p = 0.024 using the Wilcoxon signed-rank test).
Association of RBM10 with clinicopathological characteristics from 41 lung adenocarcinoma patients.
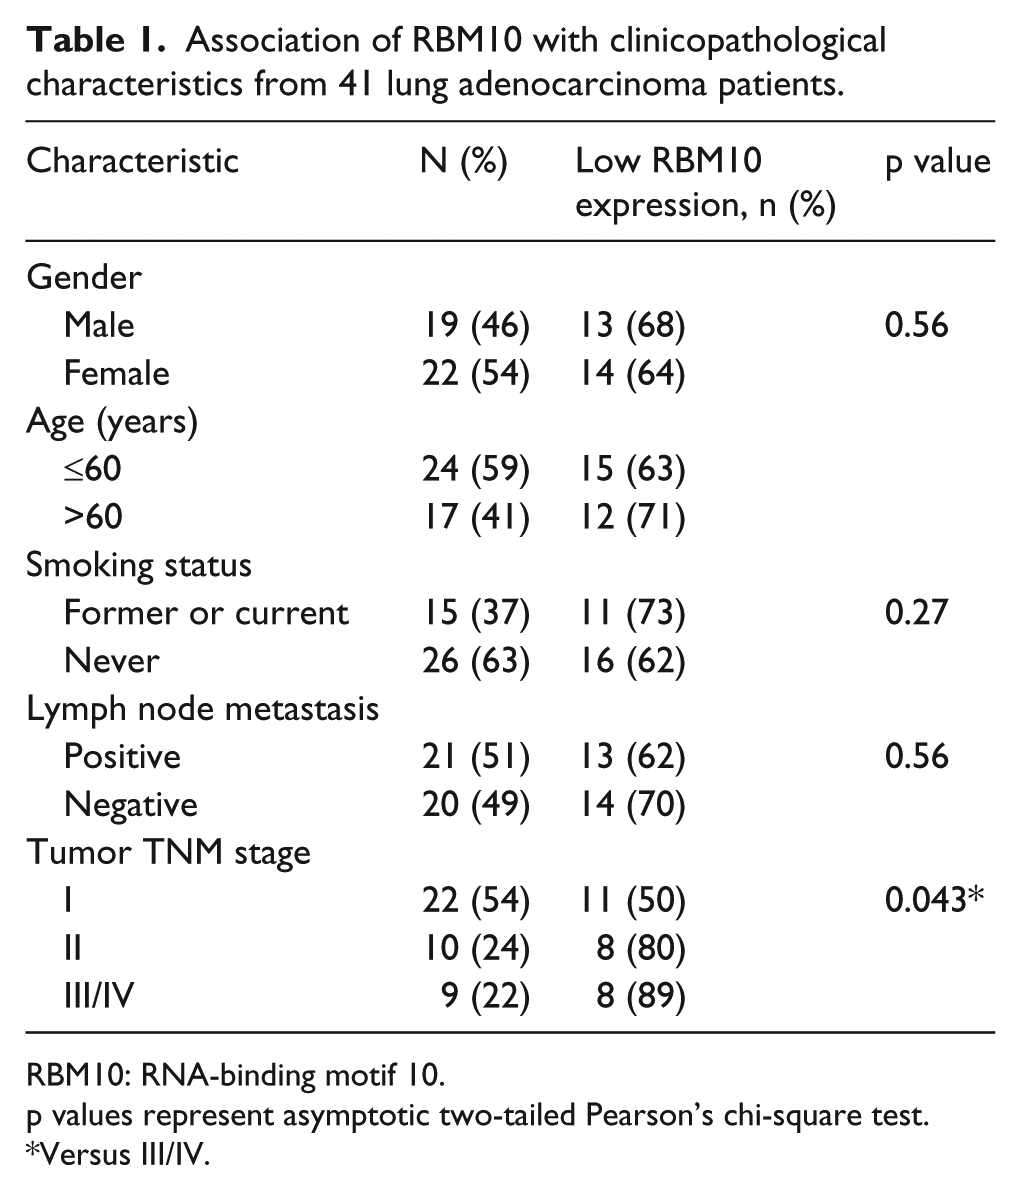
RBM10: RNA-binding motif 10.
p values represent asymptotic two-tailed Pearson’s chi-square test.
Versus III/IV.
RBM10 overexpression inhibits lung cancer cell viability and colony formation
Next, RBM10 expression was restored in lung adenocarcinoma cell lines to assess the role of RBM10 in lung cancer cells in vitro. Stable cell lines overexpressing RBM10 were established (Figure 2), and it was found that GFP expression was detectable 72 h after lentiviral infection under a fluorescence microscope. The infection efficiency, measured as the average proportion of GFP-expressing cells versus total cell count, was approximately 80% at an MOI of 20 (Figure 3).

Overexpression of 3FLAG-RBM10 fusion protein in A549 and H1299 cells by lentivirus-mediated gene expression system. Both A549 and H1299 cells were transfected with lentivirus vector carrying RBM10 and empty lentivirus control vector, respectively. Expression of 3FLAG-RBM10 fusion protein was analyzed using Western blot: (a) A549 and (b) H1299.

Infection efficiency of LV-RBM10 (LVKL14297-1) in A549 and H1299 cells detected by GFP level (100×). Lentivirus carrying RBM10 cDNA was infected into lung adenocarcinoma cells and visualized under a fluorescence microscope 3 days after infection: (a) bright field and (b) fluorescent field. MOI = 20.
Following this, the changes in cell viability in stably infected cells were assessed, and it was found that viability of A549 and H1299 cells was markedly reduced in RBM10-expressed cells compared to corresponding negative controls (NCs; Figure 4(a)). Moreover, RBM10 expression also inhibited the clonal formation of A549 and H1299 cells (p < 0.05; Figure 4(b)). These data indicated that RBM10 overexpression inhibited viability and colony formation of A549 and H1299 cells in vitro.
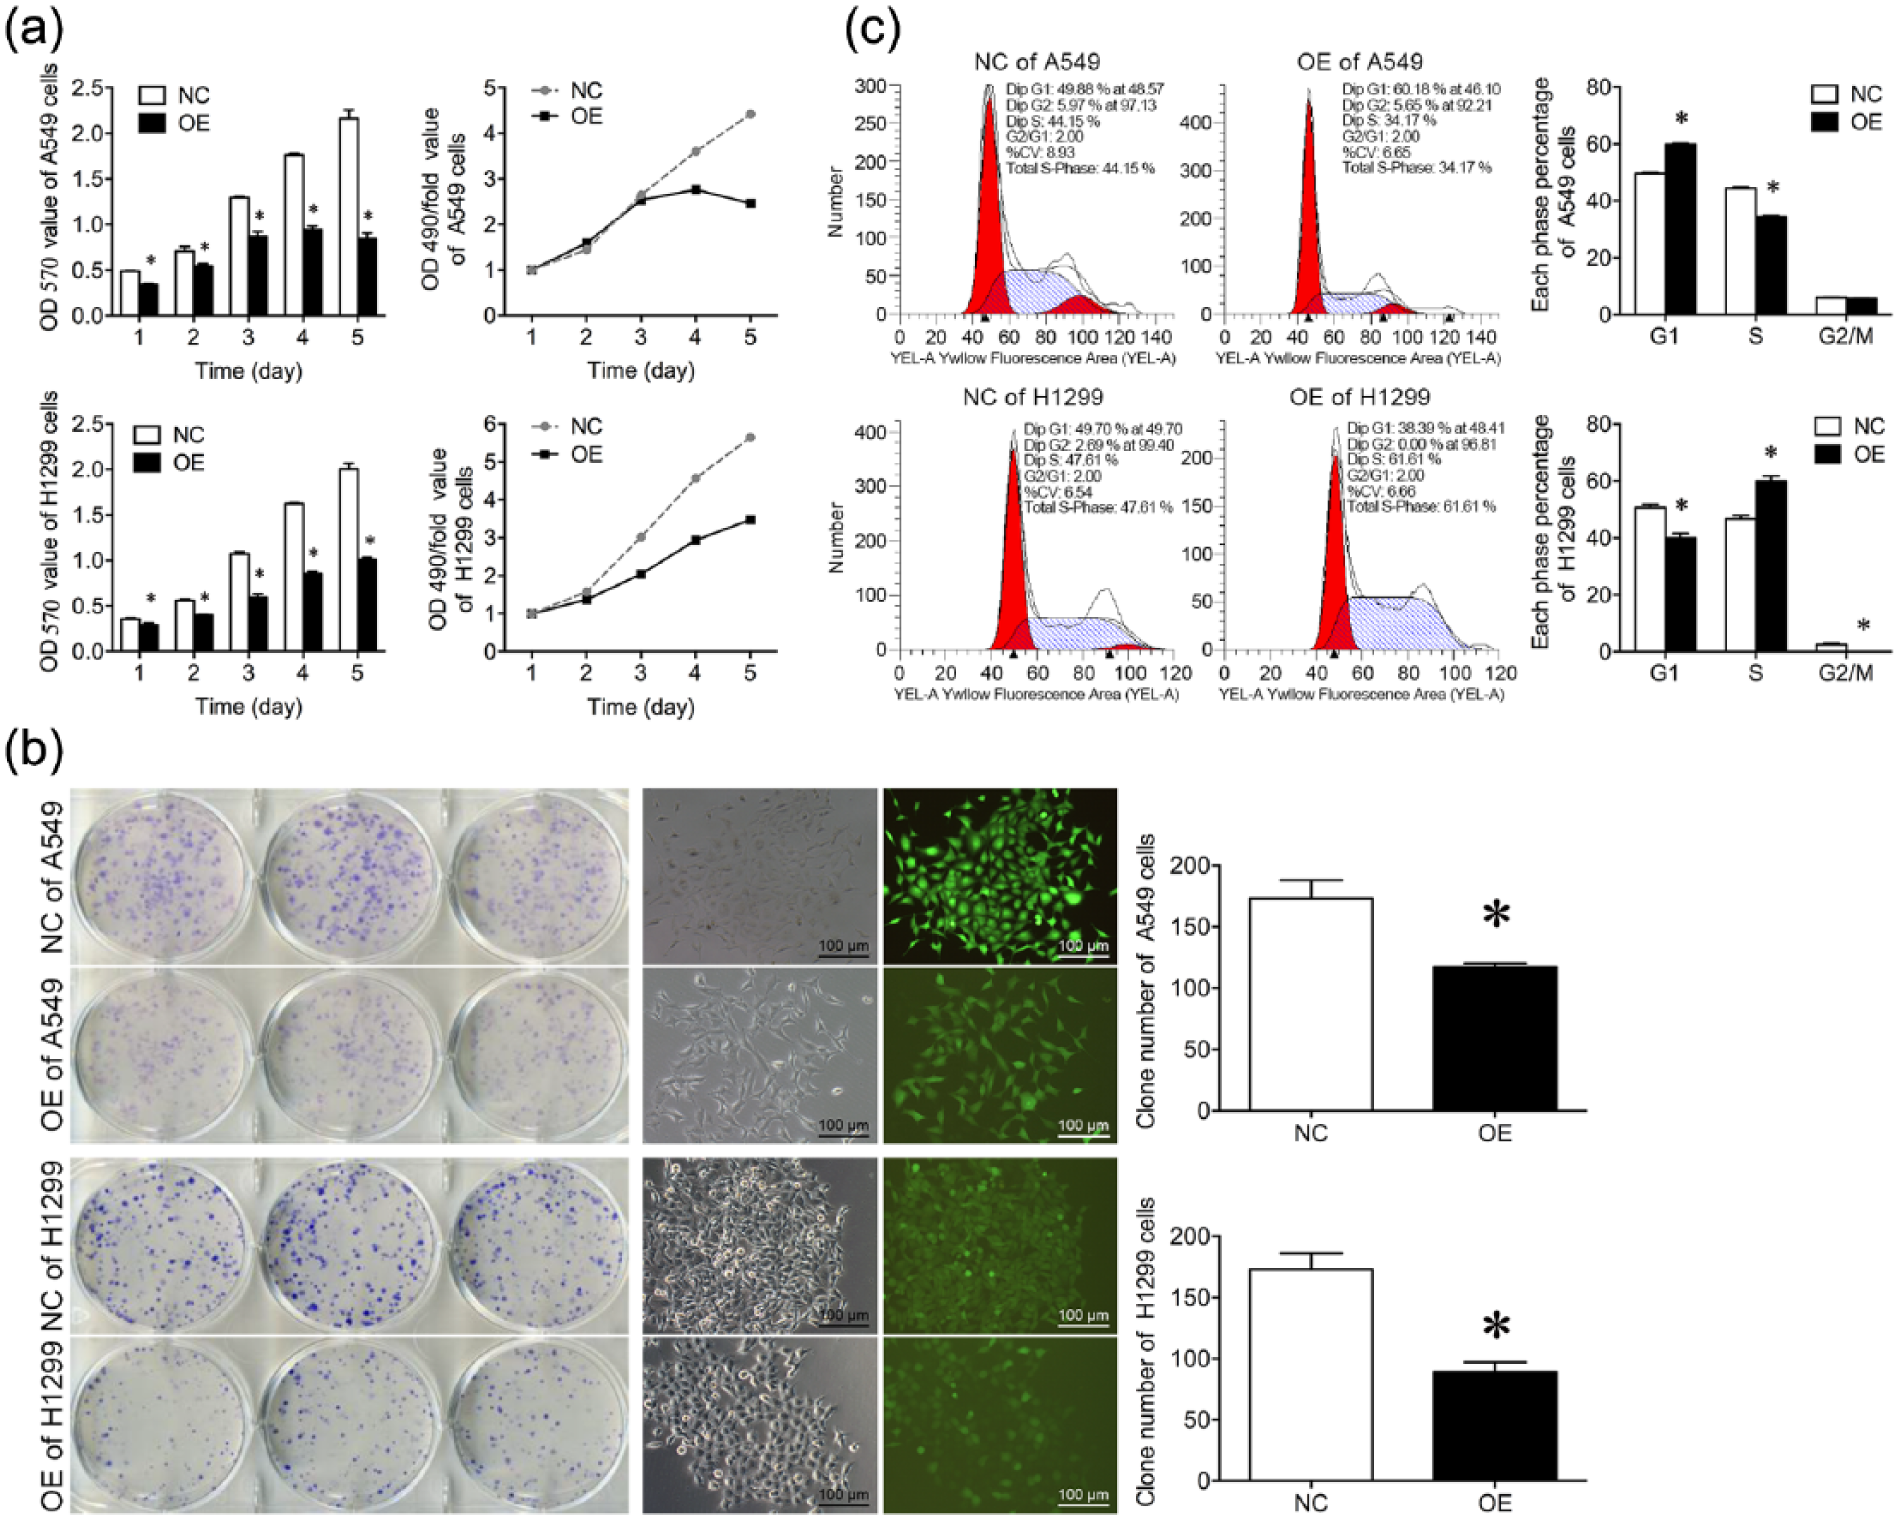
Effect of RBM10 overexpression on regulation of viability, colony formation, and cell cycle distribution of A549 and H1299 cells. (a) Cell viability MTT assay. A549 and H1299 cells were infected with lentivirus carrying RBM10 cDNA or negative control for 5 days and cell viability was assessed using the MTT assay. The data showed the OD value of RBM10 overexpression (left) and OD/fold (the value multiples; right) in A549 and H1299 cells. (b) Colony formation assay. The duplicated A549 and H1299 cells were subjected to colony formation assay, and the cell colony number was quantitatively analyzed. The representative images (magnification: ×100) are shown, and the data are expressed as the mean ± SD of each group of cells from three independent experiments. (c) Flow cytometric cell cycle assay. The data represent the mean ± SD of three replicated experiments. Representative images of two separate experiments are shown.
RBM10 overexpression inhibits cell cycle progression
Cell cycle distribution was then assessed after RBM10 overexpression, and it was found that RBM10 induced cell-cycle arrest at G0/G1 phase in A549 cells and at S phase in H1299 cells (Figure 4(c)). In brief, fluorescence-activated cell sorting (FACS) analysis showed an increase of A549 cells in G1 phase and a corresponding decrease in S and G2-M phases (p < 0.05, suggesting that RBM10 overexpression induced cell cycle arrest at G0/G1 phase in A549 cells, whereas it has also showed the number of S-phase cells was significantly increased while the G2/M phase population was significantly reduced in RBM10-overexpressed H1299 cells (OE) compared to the NC; p < 0.05).
Profiling of RBM10-regulated gene expression and gene pathway analysis
An Affymetrix GeneChip Primeview Human cDNA microarray analysis was performed to profile differential expression of RBM10-regulated genes in A549 cells. A total of 690 genes that were regulated by RBM10 expression in A549 cells were identified, in which 304 were upregulated genes and 386 were downregulated (Figure 5). The genes of greater regulation degree by RBM10 were shown in Table 2.

Profiling of RBM10-regulated gene expression and gene pathway analysis. Total RNA was isolated and was labeled with the GeneChip 3′ IVT express kit and then hybridized to Affymetrix GeneChip Primeview Human cDNA microarray. The data were analyzed using GeneChip Scanner 3000. Upregulated and downregulated gene expression is indicated by red and green colors, respectively. Functional pathway analysis of the differentially expressed genes was conducted using the IPA commercially available software.
Genes regulated by RBM10 in lung adenocarcinoma A549 cells.

Gene Ontology (GO), KEGG, and BIOCARTA analyses were then performed. The results showed that RBM10 regulated different gene pathways. Most significant pathways were involved in cancer, focal adhesion, peroxisome proliferator-activated receptor α–regulated gene pathway, cytokine–cytokine receptor interaction, mitogen-activated protein kinase (MAPK) signaling, complement and coagulation cascades, platelet amyloid precursor protein pathway, extracellular matrix (ECM)-receptor interaction, and SCLC-related gene pathways (Table 3).
KEGG analysis of RBM-regulated gene pathways.

KEGG: Kyoto Encyclopedia of Genes and Genomes; RBM: RNA-binding motif; NOD: nucleotide binding oligomerization domain; PPAR-α: peroxisome proliferator-activated receptor alpha; MAPK: mitogen-activated protein kinase; ECM: extracellular matrix.
To confirm the proteins involving in cancer, Western blot analysis was performed, and it was found that RAP1A expression was reduced by 63.5%, whereas AKT2, BIRC3, and JUN proteins were all upregulated (Figure 6). Our validation data confirmed that FGF2, EGFR, WNT5A, NF-κB, and RAP1A were the most downregulated genes by RBM10 expression, whereas AKT2, BIRC3, and JUN were the most upregulated genes (Table 2; Figure 7).

Validation of cDNA microarray data on RBM10-regulated gene expression. A549 cells were stably infected with lentivirus carrying RBM10 cDNA or control vector. The cells were subjected to protein extraction, and Western blot analysis of various protein expressions was performed to validate the most up or down RBM10-regualted genes from the cDNA microarray assay. The primary antibodies used in this study were anti-EGFR, anti-cIAP2 (BIRC3), anti-IKB-alpha (NFKBIA), anti-c-Jun, anti-FGF2 antibody, anti-Wnt5a, anti-RAP1A, and anti-AKT2.
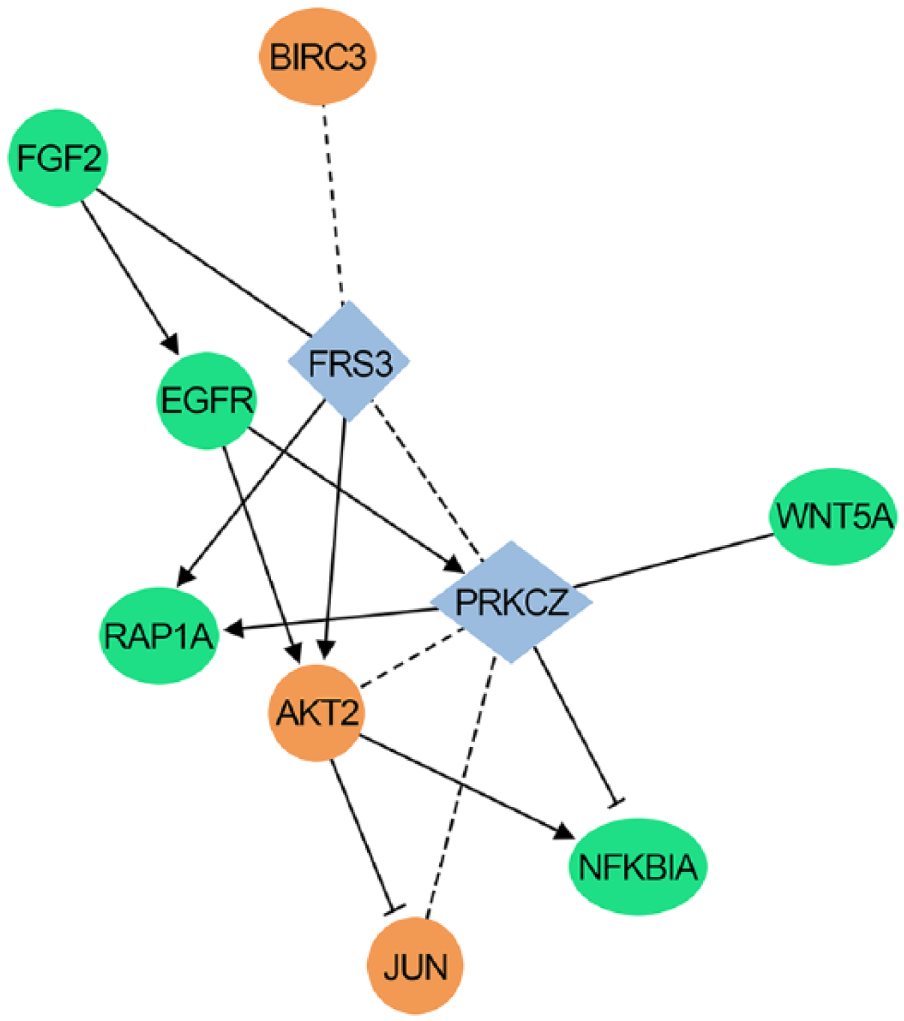
RBM10-regulated gene network. The GO and KEGG pathway analysis showed that RBM10 could target expression of different genes that form the RBM10-regulated gene network. The green-colored genes are downregulated ones, whereas the red-colored genes are upregulated ones. The solid line is explicit regulatory relationship, whereas the dashed line is predicted regulatory relationship.
Discussion
Increasing evidence suggests that RBM10 mutations or reduced RBM10 expression is associated with the development of various human cancers.12–14 In this study, expression of RBM10 mRNA and protein in lung adenocarcinoma and paired non-tumor tissue specimens was analyzed, and our results showed RBM10 mRNA and protein were reduced in tumor tissues, which is consistent with previous studies in lung cancer16,19 and breast cancer tissues. 6 We also found that in the majority of tumor tissues, RBM10 mRNA was not detectable, while protein was detected in certain cases. The reason for this discrepancy may be related to fast degradation of mRNA compared to protein. 20 Previous studies have demonstrated that RBM10 was mutated in lung adenocarcinoma tissues15,16,21 and that mutated RBM10 could regulate NUMB alternative splicing of the exon 9. 19 However, another recent study in pancreatic cancer showed that RBM10 mutations were associated with better survival of patients, regardless of histological features of aggressiveness. 13 Thus, further studies are needed to assess the spectrum of RBM10 mutations in lung adenocarcinoma, the association between RBM10 mutations and the RBM10 protein functions, and the mutated RBM10 protein in regulation of gene splicing and expression in lung adenocarcinoma. Furthermore, reduced RBM10 protein levels were associated with advanced tumor stages, but not other clinicopathological data, such as gender or age. A previous study showed that RBM10 was frequently mutated in lung adenocarcinoma of male patients, 15 which was not found in tissue samples of patients included in our study. Further studies with larger sample sizes are needed to validate such findings.
Moreover, our results in vitro showed that RBM10 overexpression inhibited lung adenocarcinoma malignant behaviors, such as cell viability, colony formation, and cell cycle progression. These findings are similar to previous studies in lung cancer and breast cancer.16,19 A previous study has found the association between the expression of X-chromosome RBM genes (RBMX, RBM3, and RBM10) and pro-apoptotic Bax gene in breast cancer tissues, 11 while another study showed that RBM10 was able to modulate apoptosis by influencing TNF-alpha expression in breast cancer cells. 22 All of these findings may support our current results showing that RBM10 overexpression arrested lung cancer cells at the G0/G1 or S phase of the cell cycle. However, the mechanism by which RBM10 arrested A549 cells at G0/G1 phase and H1299 cells at S phase of cell cycle is still unknown. Previous evidence suggests that various agents arrested tumor cells at either G0/G1 or S phase of cell cycle for induction of apoptosis.23–25 Indeed, cell cycle control involves a complex cascade of events and, in different cancer cells, such as A549 cells and H1299 cells, expression of cell cycle regulatory proteins or modulation of their expression and functions may be different. This may lead to the differences in cell cycle checkpoint arrest by RBM10 expression.26–28 In addition, cell cycle arrest at G0/G1 phase in A549 cells or at S phase in H1299 cells suggested that RBM10 overexpression could, to a certain extent, affect DNA synthesis through regulation of cell cycle–related proteins. Cell cycle arrest has been considered to be related to the inhibition on the proliferation of tumor cells.29,30 Therefore, our results are consistent with these hypotheses and may lead to novel therapeutic strategies being developed to treat lung adenocarcinoma by targeting RBM10.
In addition, this study profiled a large number of genes that were regulated by RBM10 expression in lung adenocarcinoma cells. DNA microarray analysis identified 304 upregulated and 386 downregulated genes, which are basicallly involved in the above cancer-related pathways. However, this study has only confirmed the involvement of some genes in cancer; others were left to be further studied. To date, there are a small number of studies reporting RBM10-regulated genes, such as Bax, 12 VEGF, 10 EGFR, 15 FAX, 31 TNF, 22 NUMB, 19 or Fas and Bcl-x genes. 5
Nevertheless, this study does have some limitations. The number of tissue specimens is relatively small. Our in vitro data are initial proof-of-principle findings, and future studies are needed to focus on the expression and function of RBM10-regulated genes in lung adenocarcinoma. Further studies are also needed to investigate the molecular mechanisms responsible for absent RBM10 expression in lung adenocarcinoma and the role of RBM10 in lung adenocarcinoma development. In conclusion, this study demonstrated that expression of RBM10 mRNA and protein was downregulated in lung adenocarcinoma tissues, which was associated with advanced stage of disease. Moreover, overexpression of RBM10 could inhibit lung adenocarcinoma cell malignant behaviors in vitro. RBM10 could also regulate a number of genes and gene pathways in lung adenocarcinoma cells. Furthermore, RBM10 might be a novel and potential strategy to treat lung cancer.
Footnotes
Acknowledgements
G.G. and R.L. both are the first authors of this article.
Declaration of conflicting interests
The author(s) declared no potential conflicts of interest with respect to the research, authorship, and/or publication of this article.
Funding
This study was supported by grants from Norman Bethune Program of Jilin University (#2012220), Natural Science Foundation of Jilin Province (#20150101151JC), and Special funds for industrial innovation in Jilin Province (#2016C043-3) to K.W.