
Abstract
Gastrointestinal stromal tumors originate from interstitial cells of Cajal, the pacemaker cells of the gut. Ca2+ regulates the pacemaker activity of interstitial cells of Cajal. Store-operated Ca2+ entry mediates the majority of Ca2+ entry in most cancer cells and may be a factor in regulating intracellular Ca2+ in interstitial cells of Cajal and gastrointestinal stromal tumors. Therefore, a blockade of this mechanism may affect the progression of gastrointestinal stromal tumors. Orai1 is the pore subunit of store-operated Ca2+ channels. Here, we reported that Orai1 was overexpressed in gastrointestinal stromal tumor tissues and was positively correlated with a high-risk grade in gastrointestinal stromal tumor patients. Furthermore, upon Orai1 silencing, the functional store-operated Ca2+ entry in gastrointestinal stromal tumor cells was decreased, indicating that the function of store-operated Ca2+ entry was mediated by Orai1. Inhibition of Orai1-mediated store-operated Ca2+ entry by Orai1 silencing or store-operated Ca2+ entry blockers (SKF-96365 and 2-aminoethyl diphenylborate) induced obvious cell proliferation suppression, cell-cycle distribution, and apoptosis stimulation in GIST-T1 cells. Conversely, Orai1 overexpression increased store-operated Ca2+ entry and cell proliferation in GIST882 cells. In addition, we found that activation of c-KIT and the extracellular signal–regulated kinase pathway participated in the oncogenic functions of Orai1-mediated store-operated Ca2+ entry in gastrointestinal stromal tumor cells. These results revealed that Orai1-mediated store-operated Ca2+ entry is critical for gastrointestinal stromal tumor cell proliferation via c-KIT and ERK signaling pathway activation. Orai1-mediated store-operated Ca2+ entry plays an oncogenic role and may be a novel prognostic factor and therapeutic target for patients with gastrointestinal stromal tumors.
Introduction
Gastrointestinal stromal tumors (GISTs) are the most common gastrointestinal mesenchymal tumors. GISTs exhibit significant variability in malignant behavior.1,2 Most GISTs stain positively for c-KIT and show activating mutations in c-KIT.3–6 Although more than 60% of GIST patients can be cured by surgical resection,7,8 the prognosis of advanced GIST patients after surgery is poor. Imatinib mesylate can be used as a first-line therapy, improving relapse-free survival in some cases.9–12 However, most GIST patients develop resistance to imatinib.10–13
GISTs arise from interstitial cells of Cajal (ICC),1,3,14–16 the pacemaker cells of the gut.16–18 Slow wave currents and pacemaker activity of ICC are regulated by cytoplasmic Ca2+.18–21 Therefore, regulating the intracellular Ca2+ concentration may affect the proliferation of ICC and GISTs. Store-operated Ca2+ entry (SOCE) is the principal Ca2+ entry approach in most cancer cells. Depletion of endoplasmic reticulum (ER) Ca2+ triggers translocation of STIM1 proteins to plasma membranes. Afterwards, STIM1 proteins bind and activate Orai1, the pore subunit of Ca2+ release-activated Ca2+ channels. The opening of Ca2+ release-activated Ca2+ channels induces refilling of ER stores. 22 SOCE is not only necessary to sustain intracellular calcium concentration but also important for activating downstream signaling cascades.23–25 Orai1-mediated SOCE is implicated in cancer cell growth.26–33 However, the role of Orai1-mediated SOCE in ICC and GISTs remains unclear.
Because SOCE may be a factor in sustaining intracellular calcium concentration in ICC and GISTs originating from ICC, we hypothesized that inhibition of SOCE could affect the capacity of GISTs to proliferate. To test our hypothesis, we first investigated the clinical role of Orai1 in GIST progression and found that the Orai1 expression level was higher in GIST tissues than in corresponding non-tumor tissues. A high Orai1 expression level was positively correlated with high-risk grade in GIST patients. Second, inhibition of Orai1-mediated SOCE by pharmacologic agents (2-aminoethyl diphenylborate (2-APB) and SKF-96365) or knockdown of Orai1 decreased GIST-T1 cell proliferation and stimulated apoptosis. Orai1 overexpression in GIST882 cells increased SOCE and promoted cell proliferation. Finally, a blockade of Orai1-mediated SOCE decreased c-KIT and the extracellular signal–regulated kinase (ERK) signaling pathway. Our findings suggested that inhibition of Orai1-mediated SOCE decreases GIST proliferation by downregulating c-KIT expression and inhibiting the ERK signaling pathway and that 2-APB and SKF-96365 could be used to block GIST progression.
Materials and methods
Patients, tissue specimens, and cell lines
The Ethics Committee of Xinhua Hospital approved this study (approval no. XHEC-D-2016-010), and all patients signed informed consent for tissue studies. Fresh GIST tissues and matched non-tumor tissues were collected from 40 pathologically confirmed GIST patients. None of these patients received imatinib treatment before radical surgery. These tissue samples were quickly frozen in liquid nitrogen for western blotting and quantitative real-time polymerase chain reaction (qPCR). All patients were classified into very low-, low-, intermediate-, and high-risk categories according to the modified National Institutes of Health (NIH) consensus.34,35 The human GIST cell lines GIST-T1 and GIST882 were obtained from the Shanghai Cancer Institute. GIST-T1 cells were grown in Dulbecco’s modified Eagle’s medium (DMEM) (Gibco, Gaithersburg, MD, USA) containing 10% fetal bovine serum (FBS) (Gibco) and 1% penicillin/streptomycin (Gibco), and GIST882 cells were cultured in Roswell Park Memorial Institute (RPMI) 1640 (Gibco) containing 15% FBS and 1% penicillin/streptomycin. Cells were cultured at 37°C in 5% CO2 and 95% relative humidity.
Drugs
The drugs 2-aminoethyl diphenylborate (2-APB) and SKF-96365 were purchased from Sigma-Aldrich (St. Louis, MO, USA). Both drugs were dissolved and stored in dimethyl sulfoxide (DMSO). Before the two drugs were added to cell supernatants, DMEM was used to dilute the stock solution.
qPCR
Total RNA from tissue samples or cultured cells was isolated using TRIzol reagent (Takara, Shiga, Japan). A FastQuant RT Kit (with gDNase) (TIANGEN Biotech Co., Ltd., Beijing, China) was used to synthesize complementary DNA (cDNA) from 1 µg of total RNA according to the manufacturer’s instructions. cDNA was amplified using the SYBR Green method (Takara), and Orai1 expression levels were measured using the following Orai1 primers: forward primer 5′-GCT CTG CTG GGT CAA GTT CT-3′ and reverse primer 5′-ACG GCG AAG ACG ATA AAG AT-3′; glyceraldehyde 3-phosphate dehydrogenase (GAPDH): forward primer 5′-AGA AGG CTG GGG CTC ATT TG-3′ and reverse primer 5′-AGG GGC CAT CCA CAG TCT TC-3′. Orai1 expression levels were calculated according to 2−ΔCT (ΔCT =
RNA interference
Non-target short hairpin RNA (shNC) and short hairpin RNA (shRNA) targeting Orai1 (shOrai1) encoded in pFH1UGW lentivirus vectors containing a green fluorescent protein (GFP) reporter gene were synthesized by Genomeditech Co. (Shanghai, China). The sequences of shOrai1 and shNC were 5′-GGC CUG AUC UUU AUC GUC U-3′ and 5′-TTC TCC GAA CGT GTC ACG T-3′, respectively. GIST-T1 cells were infected at a multiplicity of infection (MOI) of 40 in complete culture medium. The medium containing the lentiviruses was removed after 24 h. Western blotting was used to analyze Orai1 expression levels after 5 days. Transient knockdown of Orai1 in GIST-T1 cells with short-interfering RNA (siRNA) was performed for calcium imaging. Cells were transfected in six-well plates at a density of 6 × 10⁵ cells/well by cotransfection of siRNA and Lipofectamine 2000 (Invitrogen, Carlsbad, CA, USA). Orai1 expression in the infected GIST-T1 cells was measured by western blotting. The siRNAs for Orai1 (Si-Orai1) and for the negative control (Si-NC) were purchased from Biotend (Shanghai, China). The sequences were 5′-GGC CUG AUC UUU AUC GUC U-3′ for Si-Orai1 and 5′-TTC TCC GAA CGT GTC ACG T-3′ for Si-NC.
Construction of plasmids and transfection
The full-length Orai1 cDNA sequence was cloned into a pCMVPuro01 expression vector (Longqian Biotech, Shanghai, China). The plasmid was then transfected into GIST882 cells using ViaFect (Promega, Madison, WI, USA). GIST882 cells transfected with empty vectors (mock) were used as a negative control. The forward and reverse primer sequences for vector construction were 5′-CTA GTC TAG AAT GCA TCC GGA GCC CGC CC 3′ and 5′-TCC TTC GAA CTA GGC ATA GTG GCT GCC GG 3′, respectively.
Calcium imaging
GIST-T1 and GIST882 cells were cultured in glass bottom culture dishes 12 h before being incubated with 4 µM Fluo-4-AM (Invitrogen). Cells were then resuspended with Hanks’ balanced salt solution (HBSS) (with Ca2+, Mg2+, without phenol red, pH 7.4; Yeasen, Shanghai, China) to remove extracellular Fluo-4-AM. SOCE in Fluo-4-AM-loaded GIST-T1 cells was detected using a calcium imaging system 200 s after stimulation with 2 µM thapsigargin (TG). Fluo-4-Ca2+ fluorescence was measured using a Zeiss LSM 710 (Zeiss, Jena, Germany) at 488 nm emission.
In vitro cell proliferation assay
A Cell Counting Kit-8 (CCK-8; Yeasen) cell proliferation assay was used to evaluate cell proliferation. GIST-T1 cells were transfected with Lv-shOrai1 or cultured with 2-APB (0, 50, 100, and 150 µM) or SKF-96365 (0, 0.5, 1, and 1.5 µM) for 48 h. GIST882 cells were transfected with Orai1 expression vectors for 48 h. These pretreated cells were seeded in 96-well plates at a density of 1000 cells/well. Absorbance at 450 nm was measured over the next 5 days. Cell proliferation was also evaluated in a colony formation assay. Cells were planted in 6-cm dishes (500 cells/dish) and were allowed to proliferate for 9 days. Then, the adherent cells were fixed with 4% paraformaldehyde for 20 min and washed with phosphate-buffered saline (PBS). Thereafter, cells were stained with 0.5% crystal violet (Yeasen) for 20 min and washed with PBS. A microscope was used to count the number of colonies (>50 cells/colony).
Cell-cycle analysis
Following the pretreatments, GIST-T1 cells were fixed with 70% ethanol overnight at 4°C. Then, the cells were washed and stained with 1 mg/mL propidium iodide (PI) (Sigma-Aldrich). Flow cytometry (BD Biosciences, San Diego, CA, USA) was performed to analyze the DNA content of the GIST-T1 cells.
Flow cytometry analysis of cell apoptosis
Following the pretreatments, we collected GIST-T1 cells and washed them with cold PBS. Next, 100 µL of annexin-V binding buffer (1×), 5 µL of 50 µg/mL PI, and 5 µL of fluorescein isothiocyanate (FITC; BD Biosciences) were added to the cell suspensions. These cells were incubated at room temperature in the dark for 15 min. Thereafter, another 100 µL of annexin-V binding buffer (1×) was mixed with the cell suspension. Flow cytometry (BD Biosciences) was performed to analyze the samples.
Western blotting
Cellular proteins were extracted from the GIST tissues and cells with radioimmunoprecipitation assay (RIPA) buffer (Cell Signaling Technology, Danvers, MA, USA) containing 1% phenylmethanesulfonyl fluoride (PMSF). A volume of 28 µg of protein was separated by sodium dodecyl sulfate polyacrylamide gel electrophoresis (SDS-PAGE) and transferred onto polyvinylidene difluoride membranes (Millipore, Bedford, MA, USA). Next, the membranes were treated with 5% fat-free milk for 1.5 h at room temperature. After being incubated with primary antibodies, the membranes were washed with tris-buffered saline with Tween 20 (TBST) and incubated with secondary antibodies. Target proteins were measured by enhanced chemiluminescence (Millipore, Billerica, MA, USA). GADPH was used as the loading control. A rabbit anti-Orai1 antibody was obtained from Zen BioScience (Chengdu, China). A rabbit anti-Kit antibody was purchased from Proteintech (Wuhan, China). Antibodies against MEK, phospho-MEK, ERK, and phospho-ERK were obtained from Cell Signaling Technology.
Statistical analysis
IBM SPSS Statistics 19.0 (SPSS Inc., Chicago, IL, USA) was used for statistical analyses. Each experimental value was expressed as the mean ± standard deviation (SD). Paired Student’s t-tests were performed to compare Orai1 messenger RNA (mRNA) levels in tumor and non-tumor tissues. The means of two groups were compared using independent Student’s t-tests. Significant differences between groups were considered for p < 0.05. All of the results are representative of three independent experiments.
Results
Orai1 overexpression is positively correlated with high-risk grade in GIST patients
qPCR was performed to investigate the Orai1 mRNA expression level in 40 GIST tissues and the corresponding non-tumor tissues. The Orai1 mRNA expression level was statistically higher in GIST tissue samples than in the corresponding non-tumor tissue samples (p = 0.008) (Figure 1(a) and (b)). Moreover, the Orai1 mRNA expression level in the high-risk group was higher than those in the low- and intermediate-risk groups (Figure 1(c)), while there was no statistically significant difference between the latter two groups.

Orai1 overexpression is associated with high-risk grade in GIST patients. (a) Scatter plots of relative Orai1 expression at the transcription level in GIST tissues and corresponding non-tumor counterparts. Orai1 expression was calculated and is expressed as the Orai1/GADPH expression ratio (2−ΔCT). (b) Orai1 expression levels were compared between GIST tissues and matched non-tumor tissues. (c) Scatter plots of relative Orai1 mRNA expression in low-, intermediate-, and high-risk groups. (d) The relative Orai1 protein expression levels were compared between GIST tissues and matched non-tumor tissues.
Western blotting was then performed to analyze Orai1 protein expression levels in GIST tissues and their corresponding non-tumor tissues. Our results showed that the Orai1 expression level was higher in GIST tissue samples than in corresponding non-tumor tissue samples (Figure 1(d)). We also found that Orai1 expression was significantly higher in the high-risk group than in the low- and intermediate-risk groups (Supplementary Figure 1).
Orai1 expression in GIST cell lines
We then tested Orai1 expression in GIST-T1 and GIST882 cells by qPCR and western blotting. Orai1 expression was higher in GIST-T1 cells than in GIST882 cells (Figure 2(a) and (b)). Therefore, we evaluated the effects of Orai1 knockdown on GIST-T1 cell proliferation and tested the effects of ectopic Orai1 overexpression on GIST882 cell proliferation.

Orai1 expression in GIST cell lines. (a and b) Orai1 mRNA and protein expression levels in GIST-T1 and GIST882 cell lines. (c) The lentiviral transduction efficiency was examined by observing GFP expression when GIST-T1 cells were transduced with Lv-shNC and Lv-shOrai1 after 72 h. (d) The knockdown efficiency in GIST-T1 cells was examined by western blotting. GAPDH was used as the loading control. (e) Orai1 knockdown via transfection with Si-Orai1 decreased TG (2 µM)-induced SOCE in GIST-T1 cells. (f) Quantification of TG-induced SOCE peak value in (e). *p < 0.05 compared with the Si-NC group. (g) The overexpression efficiency in GIST882 cells was verified by western blotting. (h) Orai1 overexpression increased TG (2 µM)-induced SOCE in GIST882 cells. (i) Quantification of TG-induced SOCE peak value in (h). *p < 0.05 compared with the mock group. The above results are representative of three independent experiments.
A lentivirus shRNA-based system (Lv-shOrai1 and Lv-shNC) was used to knock down Orai1 expression in GIST-T1 cells. First, we detected the expression of GFP to evaluate the lentiviral transduction efficiency in GIST-T1 cells. More than 90% of GIST-T1 cells were successfully transduced with Lv-shOrai1 or Lv-shNC (Figure 2(c)). Next, we used western blotting to analyze Orai1 protein expression in GIST-T1 cells. Orai1 protein expression was obviously repressed in the Lv-shOrai1 group (Figure 2(d)). Transient knockdown of Orai1 in GIST-T1 cells using siRNA was validated by western blotting (Supplementary Figure 2). Because Orai1 is the pore subunit of SOCE, we investigated the effect of Orai1 knockdown on SOCE. The reduction of functional SOCE was verified by Fluo-4-based intracellular Ca2+ measurements (Figure 2(e)). The TG-induced SOCE peak value was also significantly reduced in the Si-Orai1 cells compared to that in the Si-NC cells (p = 0.013) (Figure 2(f)).
Orai1 overexpression vectors were transfected into GIST882 cells, and Orai1 protein expression was significantly improved in the Orai1-transfected cells (Figure 2(g)). Functional SOCE and SOCE peak values were also increased in Orai1-transfected cells compared with empty vector-transfected cells (Figure 2(h) and (i)).
Effects of Orai1 downregulation and overexpression on GIST cell proliferation
CCK-8 cell proliferation and colony formation assays were used to investigate the influence of Orai1 knockdown and overexpression on GIST cell growth. Downregulation of Orai1 expression markedly decreased the viability of GIST-T1 cells in a time-dependent manner (***p < 0.001, Figure 3(a)). The result of the colony formation assay showed that fewer and smaller colonies were observed in the Lv-shOrai1 group (Figure 3(b), ***p < 0.001). Conversely, the viability of Orai1-transfected cells was significantly higher than that of empty vector-transfected cells (Supplementary Figure 3(a)). More and larger colonies were observed in the Orai1-transfected cells (Supplementary Figure 3(b)). These results suggested that Orai1 plays a critical role in GIST cell proliferation.

The roles of Orai1 knockdown in GIST cell proliferation, the cell cycle, and apoptosis. (a) A CCK-8 assay was performed to evaluate the influence of Orai1 knockdown on GIST-T1 cell proliferation. ***p < 0.001 compared with the Lv-shNC group. (b) Pretreated GIST-T1 cells were seeded at 500 cells/dish (6 cm) and were allowed to form colonies in DMEM containing 10% FBS for 9 days. Representative photographs of the colonies are shown on the left, and the numbers of colonies are shown on the right (means ± SD). ***p < 0.001 compared with the Lv-shNC group. (c) Orai1 knockdown induced S-phase arrest in GIST-T1 cells. The percentage of GIST-T1 cells in G0/G1, S, and G2/M phases is shown (means ± SD). **p < 0.01 compared with the Lv-shNC group. (d) Orai1 knockdown induced apoptosis in GIST-T1 cells. Cells stained with FITC were considered apoptotic. The percentages of apoptotic GIST-T1 cells are shown (mean ± SD). **p < 0.01 compared with the Lv-shNC group. The above results are representative of three independent experiments.
Orai1 silencing induces an S-phase cell-cycle arrest and enhanced apoptosis
The influence of Orai1 silencing on cell-cycle progression was determined by flow cytometry. The percentage of cells in the S phase was significantly higher in the Lv-shOrai1 group than in the Lv-shNC group, while the percentage of cells in the G2/M phase decreased in the Lv-shOrai1 group (Figure 3(c), **p < 0.01). Additionally, Orai1 silencing enhanced apoptosis compared to negative controls (Figure 3(d), **p < 0.01). These results revealed that Orai1 silencing suppressed GIST-T1 cell proliferation by inducing S-phase arrest and apoptosis.
Effects of pharmacological inhibitors of Orai1-mediated SOCE on cell proliferation, the cell cycle, and apoptosis
Orai1, the pore subunit of SOCE, acts as an oncogene (Figures 2 and 3). SOCE was reduced after downregulating Orai1. Therefore, we evaluated the effects of pharmacological inhibitors of SOCE on cell proliferation, cell cycle, and apoptosis to determine whether the oncogenic function of Orai1 was attributed to Orai1-mediated SOCE. The established SOCE blockers, SKF-96365 and 2-APB, inhibited TG-induced Ca2+ influx in GIST-T1 cells (Figure 4(a)). After successful inhibition of SOCE, we found that the proliferation and colony formation capacity of GIST-T1 cells were suppressed in a dose-dependent manner (Figure 4(b)–(d)).

The effects of SOCE blockers on GIST cell proliferation. (a) The established SOCE blockers, SKF-96365 (1 µM) and 2-APB (100 µM), inhibited TG-induced SOCE in GIST-T1 cells. (b) The viabilities of GIST-T1 cells cultured with 2-APB (0, 50, 100, and 150 µM) or (c) SKF-96365 (0, 0.5, 1.0, and 1.5 µM) were evaluated in CCK-8 assays. The data are presented as the mean ± SD. ***p < 0.001 compared with the control group. (d) GIST-T1 cells were cultured with 2-APB (0, 50, 100, and 150 µM) or SKF-96365 (0, 0.5, 1.0, and 1.5 µM) for 9 days to form colonies in DMEM containing 10% FBS. Representative photographs of the colonies are shown on the left, and the numbers of colonies are shown on the right (mean ± SD; ***p < 0.001 compared with the control group). The above results are representative of three independent experiments.
We further used flow cytometry to assess the influence of decreased SOCE on cell-cycle progression. After incubation with 2-APB or SKF-96365 for 48 h, the percentages of cells in the S phase and G2/M phase increased (Figure 5(a)), while the percentage of cells in the G0/G1 phase decreased (Figure 5(a)) in a dose-dependent manner.
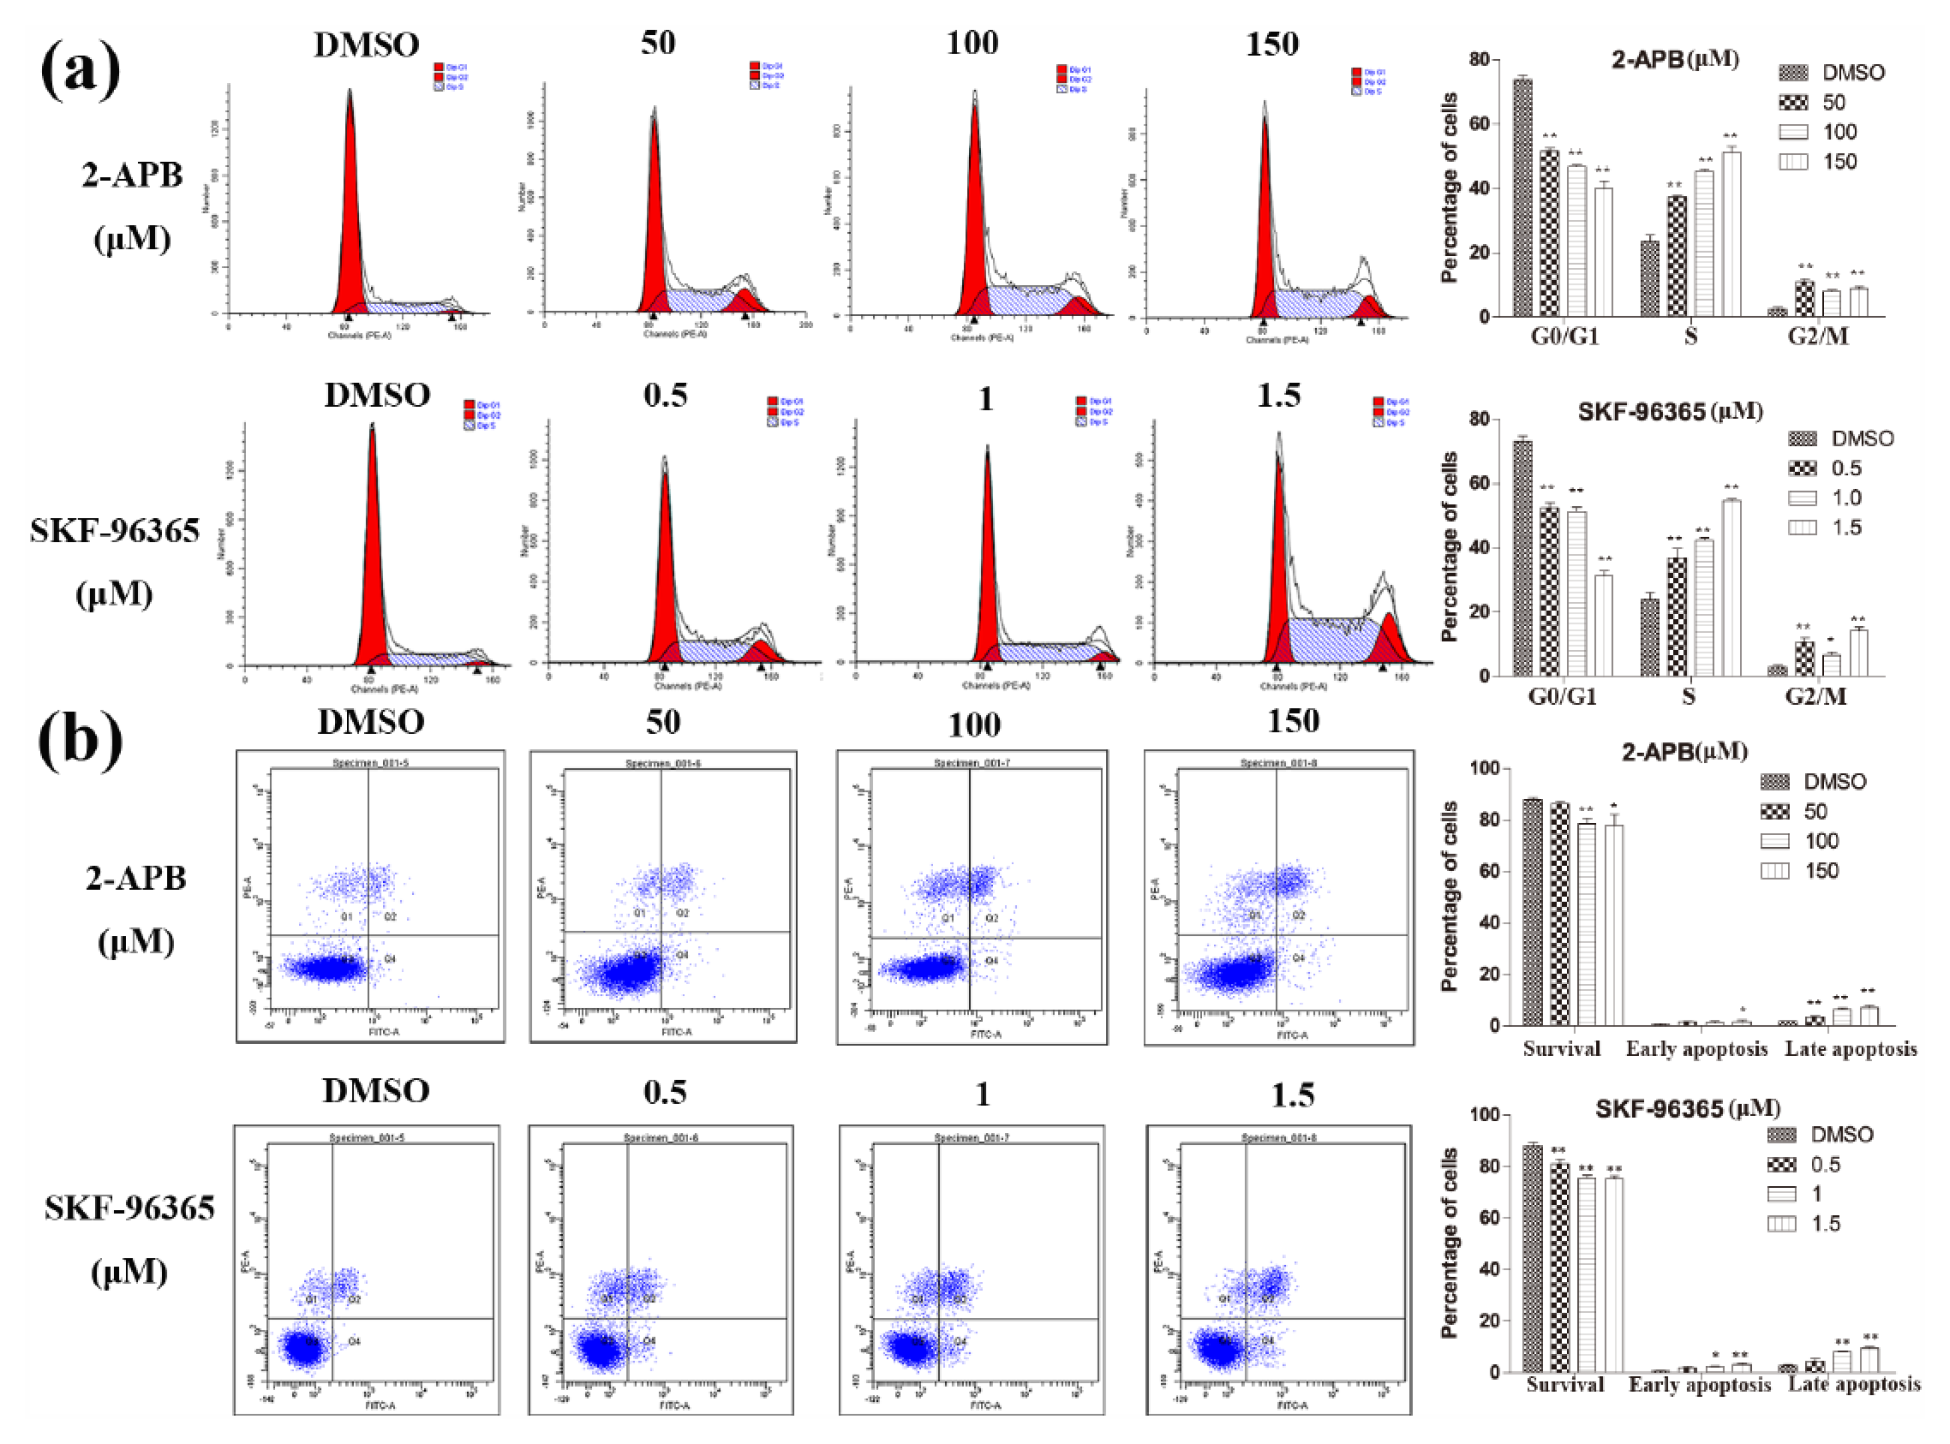
The effects of SOCE blockers on GIST cell cycle and apoptosis. (a) SOCE blockers induced S-phase arrest in GIST-T1 cells. GIST-T1 cells were treated with 2-APB (0, 50, 100, and 150 µM) or SKF-96365 (0, 0.5, 1.0, and 1.5 µM) for 48 h. The percentages of GIST-T1 cells in the G0/G1, S, and G2/M phases are shown (mean ± SD). *p < 0.05, **p < 0.01compared with the control group. (b) SOCE blockers induced apoptosis in GIST-T1 cells. GIST-T1 cells were treated with 2-APB (0, 50, 100, and 150 µM) or SKF-96365 (0, 0.5, 1.0, and 1.5 µM) for 48 h. Cells stained with FITC were considered apoptotic. The percentages of apoptotic GIST-T1 cells are shown (mean ± SD). *p < 0.05, **p < 0.01 compared with the control group. The above results are representative of three independent experiments.
The effects of 2-APB and SKF-96365 on GIST cell apoptosis were also evaluated via flow cytometry. After incubation with 2-APB or SKF-96365 for 48 h, as shown in Figure 5(b), we found significant dose-dependent stimulation of apoptosis in the 2-APB- and SKF-96365-treated GIST-T1 cells.
Inhibition of Orai1-mediated SOCE exerts an anti-proliferation effect by downregulating c-KIT and the ERK pathway
Most GISTs contain oncogenic mutations of c-KIT or platelet-derived growth factor receptor alpha (PDGFRA).36–38 c-KIT oncoproteins are critical for GIST cell proliferation.9,39 Therefore, we examined c-KIT protein expression after silencing Orai1 and found that the c-KIT protein levels were decreased in the Lv-shOrai1 group (Figure 6). Moreover, the c-KIT protein expression levels were also decreased in a dose-dependent manner when GIST-T1 cells were incubated with 2-APB or SKF-96365 for 72 h.

Inhibition of Orai1-mediated SOCE downregulated c-KIT protein expression and the ERK pathway. Cellular proteins were extracted from GIST-T1 cells transfected with lentivirus-mediated shRNA or treated with 2-APB (0, 50, 100, and 150 µM) or SKF-96365 (0, 0.5, 1.0, and 1.5 µM) for 72 h. The protein expression levels of c-KIT, phosphorylated MEK, total MEK, phosphorylated ERK, and total ERK were examined by western blotting. GADPH was used as the loading control. The above results are representative of three independent experiments.
Feng et al. 22 and Zhu et al. 30 found that low intracellular Ca2+ was linked to decreased levels of phospho-ERK, which prompted our interest in exploring the expression levels of ERK signaling pathway proteins after inhibition of Orai1-mediated SOCE. When GIST-T1 cells were transfected with Lv-shOrai1 or incubated with 2-APB or SKF-96365 for 72 h, the levels of phosphorylated MEK and phosphorylated ERK were decreased, while their total protein levels were unaffected (Figure 6). Moreover, the expression levels of phosphorylated MEK and phosphorylated ERK were reduced in a dose-dependent manner. These results indicated that c-KIT and the ERK pathway might be regulated by the tumor-promoting SOCE in GIST cells.
Discussion
GISTs are driven by gain-of-function mutations of c-KIT or PDGFRα. Imatinib mesylate has significantly improved the survival of GIST patients. However, imatinib resistance is a major cause of imatinib failure. 40 Therefore, identification of novel tumor markers for early detection and therapeutic targeting is important.
Several studies have demonstrated that Orai1-mediated SOCE promotes tumor progression and metastasis.27,30,32 Zhu et al. 30 found that Orai1 overexpression was observed in malignant esophageal squamous cell carcinoma and that high expression levels of Orai1 were associated with poor prognoses. Inhibition of Orai1-mediated SOCE by pharmacologic antagonists or by silencing Orai1 suppressed tumor cell proliferation. Consistent with the above studies, we observed a significant increase in Orai1 expression in GIST tissues compared with corresponding non-tumorous tissues. The high expression of Orai1 was positively correlated with high GIST risk, suggesting the importance of Orai1 in GIST proliferation.
To further investigate the effect of Orai1 on GIST cell proliferation, we knocked down and overexpressed Orai1 in GIST-T1 and GIST882 cells, respectively. After confirming Orai1 expression by western blotting, we evaluated the effects of Orai1 knockdown and overexpression on SOCE. Orai1 knockdown and overexpression repressed and increased SOCE, respectively, indicating that SOCE is mediated by Orai1 channel activity. Moreover, inhibition of Orai1-mediated SOCE by Orai1 knockdown or pharmacologic antagonists of SOCE impeded the proliferation of GIST cells, while activation of Orai1-mediated SOCE by Orai1 overexpression promoted GIST cell growth in vitro.
Taken together, these results indicate that Orai1-mediated SOCE may play a critical role in GIST proliferation. However, the mechanism of SOCE-mediated tumor promotion in GISTs remains unknown. In this study, we found that inhibition of Orai1-mediated SOCE induced a greater percentage of GIST cells in the S phase and stimulated apoptosis. Thus, the influence of SOCE inhibition on GIST cell growth may be partially due to inducing S-phase arrest and stimulating apoptosis.
The downstream signaling pathways of Orai1-mediated SOCE in GIST oncogenesis remain unclear. The c-KIT protein plays an essential role in GIST progression. 36 In this study, we explored the potential association between Orai1-mediated SOCE and the c-KIT protein. After silencing Orai1, c-KIT protein expression was decreased in the Lv-shOrai1 group. Moreover, c-Kit protein expression was also decreased when GIST cells were incubated with 2-APB or SKF-96365 for 72 h. These results indicated that c-Kit might mediate Orai1-/SOCE-regulated cell proliferation in GISTs. Combined inhibition of Orai1-mediated SOCE and c-Kit may synergistically repress GIST proliferation.
The Ras-Raf-MEK-ERK pathway plays critical roles in cell proliferation and the cell cycle.22,41 By detecting the expression of the ERK pathway, we revealed a correlation between Orai1-mediated SOCE and the ERK signaling pathway in GIST-T1 cells. Our data showed that compared to control cells, the levels of phosphorylated MEK and phosphorylated ERK were decreased in SOCE-inhibition cells, while their total protein levels were unaffected. Consistent with our data, Feng et al. 20 and Zhu et al. 30 found that the effects of Orai1 on proliferation are linked to reduced ERK phosphorylation and that knocking down Orai1 resulted in decreased phosphorylation forms of ERK. Such data indicated that the ERK signaling pathway might be one of the Orai1-SOCE-stimulated downstream signaling pathways in GISTs.
In summary, this study investigated the oncogenic roles of Orai1 and Orai1-mediated SOCE in GISTs. Our results showed that Orai1 was overexpressed in GIST tissues. Importantly, Orai1 is the pore subunit of SOCE, and Orai1 expression regulates SOCE. Therefore, SOCE was mediated by Orai1 in GIST cells. Inhibition and activation of Orai1-mediated SOCE significantly suppressed and promoted GIST cell proliferation, respectively. In addition, inhibition of Orai1-mediated SOCE induced S-phase arrest, stimulated apoptosis, and downregulated the expression of c-KIT and the ERK signaling pathway. These results suggest that Orai1-mediated SOCE may be a potential therapeutic target for GIST patients.
Footnotes
Acknowledgements
L.W., J.H., and Y.Z. contributed equally to this work.
Declaration of conflicting interests
The author(s) declared no potential conflicts of interest with respect to the research, authorship, and/or publication of this article.
Funding
This study was supported by the Key Project of Science and Technology of Shanghai (No. 13JC1401202), the National Natural Science Foundation of China (No. 31501127), the China Postdoctoral Science Foundation (No. 2015 M571577), and the State Key Laboratory of Oncology in Southern China (No. HN2011-08).
References
Supplementary Material
Please find the following supplemental material available below.
For Open Access articles published under a Creative Commons License, all supplemental material carries the same license as the article it is associated with.
For non-Open Access articles published, all supplemental material carries a non-exclusive license, and permission requests for re-use of supplemental material or any part of supplemental material shall be sent directly to the copyright owner as specified in the copyright notice associated with the article.