
Abstract
This article attempts to capture gender bias in education expenditure among the religious (Hindu, Muslim and others) and the social groups (SC, ST and General) in West Bengal. Oaxaca–Blinder decomposition technique is used to obtain gender bias for a specific demographic group. Further, an attempt has been made to identify the religious or social groups with the acute problem of gender bias. In this work, 71st round (January–June 2014) education expenditure data (individual level) provided by NSSO (National Sample Survey Office) is used.
Introduction
There exists a vast literature with evidence of gender discrimination against female household members in the intra-household allocation of goods and services at the regional/national level in India. In the context of ‘education’, a substantial number of studies on India point to the existence of gender bias (e.g., Azam & Kingdon, 2013; Deaton & Subramanian, 1991; Dreze & Kingdon, 2001; Kambhampati, 2008; Kambhampati & Pal, 2001; Kingdon, 1998, 2002, 2005; Lancaster et al., 2008; Pal, 2004; Tilak, 2002; Zimmerman, 2012, to name a few).
There are official evidence as well. The Government of India (2013) reports a very low enrolment rate in the primary and secondary education levels for female students compared to male students. Subrahmanian (2005) and Bandyopadhya and Subrahmanian (2008) suggested socio-economic reasons for the existence of gender bias in education in India. The topmost reasons for dropping out are lack of interest in studies, the economic condition of the parents, lack of parental motivation, cost of schooling, migration of family and demand for child labour for domestic and other purposes. After dropping out from upper primary classes, the students have been found to be generally helping the parents in earning money, either by getting involved in agriculture and allied activities, or directly by doing work to earn money. Girls have been found to be more victimised as households consider investment in a girl child for education as an additional monetary burden over and above the dowry and expenditure on marriage. On the other hand, investment in a boy child is considered more fruitful as he would turn out to be another bread-earner for the household.
However, the existing research articles have largely contributed in terms of the overall picture of the presence and the magnitude of gender bias in education in India. The social structure of India is multi-layered. Jejeebhoy and Sathar (2001) pointed out that female autonomy and access to information have different patterns across different religions in India. The female autonomy is largely constrained for Muslim groups as compared to Hindu groups. The constrained autonomy prevails in terms of taking decision for children’s education also. The lower educational attainment and expenditure is reflected in terms of female wage-earning across religious and social groups. Sengupta and Das (2014) pointed out that Hindu women generally get higher wage than Muslim, whereas Scheduled Tribe (ST) women get better wage payments compared to Scheduled Caste (SC) women. Borooah and Iyer (2005a, b) have shown that the rate of school enrolment for Muslim is very low as compared to Hindu. This gap gets widened when male and female children are considered differently. Further, NCAER (1999) Survey indicated that 16% Hindu, 17% Dalit and 23% Muslim families have not enrolled their children to school because they thought education is not important. Borooah (2012) using the IHDS data found that after controlling for a number of parental, household and school-related factors, children from all the different social groups, when compared to Brahmin children, were disadvantaged, in some or all of the three competencies of reading, arithmetic and writing. However, this disadvantage was the greatest for Muslim, Dalit and Adivasi children.
This article fills up the gap in the literature by looking at the expenditure side of education as indicated by Dreze and Kindon (2001). Paik (2014) showed that the simple participation in school by a girl might not help her to cross the stickiness of the religious and caste system in India. It requires the achievement of a certain level of human capital development that can be possible for spending more on girls of deprived sections in India. The perception of educational expenditure varies across religious and social groups. Saha (2013) using the 64th round NSSO data elaborated that the discrimination against girls varies across tribal groups and social groups. This differential attitude becomes more prominent for female children. The existing literature largely looks at the overall gender gap in education expenditure, which does not help us to identify the specific social or religious group where the problem is acute. The objective of this article is to study the magnitude of the gender gap in the educational expenditure across various social and religious groups using Oaxaca–Blinder decomposition technique by using the latest data on education expenditure provided by NSSO. Through this study, it would be possible to identify the social and religious groups that are most-affected and the policy design could be targeted as compared to a policy for the entire population.
The focus on West Bengal is for certain reasons. First, the dropout rate in West Bengal is much higher than the figures at the national level. Second, in the context of marriage at an early age, West Bengal (53%) comes fifth after Bihar, Jharkhand, Rajasthan and Andhra Pradesh (Ghosh & Kar, 2010). Third, Tisdell (2002) has also pointed out that there exists a tendency of favouring sons over daughters, which results in the deprivation of young female children in terms of education, health and other welfare parameters in the rural villages in West Bengal. Moreover, the extensive research works to examine gender bias in educational attainment and, subsequently, the expenditure on education for the state of West Bengal is not much in number. In terms of expenditure, Kingdon (2005) pointed out that Muslim households have significantly lower education budget shares than Hindus in West Bengal along with Andhra Pradesh, Himachal Pradesh, Karnataka, Orissa, Uttar Pradesh and Assam. Rana et al. (2003) have shown concern about the condition of the socially and economically underprivileged communities in West Bengal, particularly, the SCs, STs and religious minorities due to the lack of accessibility to proper facilities and the abundance of a poor quality of education.
However, there is no work related to the disparity in education expenditure prevalent among the socially and economically underprivileged communities in West Bengal. This article is an attempt to bridge the gap in the literature.
The plan of this article is as follows. In Section II, the model used in this article is described. Section III presents the methodology used; Section IV provides a brief description of the data used; Section IV discusses the regression and decomposition results. Finally, Section V provides the concluding remarks.
Model Specification: The Oaxaca–Blinder Decomposition
The aspect of gender in the education expenditure and educational attainment has been considered by including a dummy variable as an explanatory variable and checking the significance of the respective coefficient (Deaton & Subramanian, 1991; Drèze & Kingdon, 2001; Kingdon, 1998, 2002, 2005, etc.). Apart from these literatures, Brambor et al. (2006) used the interactive dummy framework in political science and mentioned that the multiplicative dummy framework is often criticised by the analysts as the impact of some explanatory variables simply becomes zero when the dummy takes the value zero. In other literature, there is further improvement of this technique in this context. For example, Asongu and Odhiambo (2019) used the technique of quadratic interaction terms to capture the effect of the implementation of the insurance policy on the GDP growth rates in Africa through a Panel regression. Boateng et al. (2018) estimated a quadratic cost function to obtain the relation between the information sharing offices and the market power in Africa through a panel setup. Asongu and Odhiambo (2020) also used the interaction dummy technique to find the critical masses for understanding the effect of gender on economic inequality.
However, the objective of this article is to estimate the differential in educational expenditure due to gender of the child across religious and social groups. This differential might not be assessed if the technique of interactive dummy has been implemented as the differential could only be estimated through the statistical significance of specific coefficients of the interactive. Hence, the technique of interactive dummy does not help to assess how the market perceives the differential endowments. The consideration of the Oaxaca–Blinder (1973) decomposition enables to isolate the contributions of the explained factors (the difference between the average of measured characteristics of the explanatory variables of males and females) and that of the unexplained factors (the differences in the estimated values of the regression coefficients between males and females).
To find the within and between group differentials, a decomposition technique analogous to the wage differential model of Brown et al. (1980) is used.
Two separate regression equations for the lth male and the lth female individual belonging to jth demographic group are given by


Here, Y is the expenditure for educational items; m and f are indexes for male and female students, respectively.
X is the vector of explanatory variables (personal characteristics) of students, which includes a log of monthly per capita expenditure (Log(MPCE)), its squared term ((Log(MPCE))2, household size (Hhsize), educational levels of household heads (Hdedu), age of the student (Age), age at the time of entry to school (Entry_age), a dummy d1 which takes the value 1 if education is free and 0, 1 otherwise; another dummy d2 which takes the value 1 if the student has a computer and 0, otherwise and a constant term.
In this model, the parameters of Equations (1) and (2) are estimated separately for men and women based on the respective sets of personal characteristics. In early models, discrimination was measured as the difference between the intercepts in the two regressions. However, Blinder (1973) and others argued that the slope coefficients also contain information about discrimination. In this model, we have three religious groups (Hindu, Muslim and Others) and three social groups (SC, ST and General). In order to get the overall mean of log of education expenditure for male and female students, the concept of the composite mean is used.
Overall mean of log of education expenditure for male students
Overall mean of log of education expenditure for female students
Here, θ j m and θ j f are the fractions of total male and female observations belonging to the jth demographic group, respectively.
In other words,
Here, N = total number of observations
Nm = total number of male observations
Nf = total number of female observations
Nm j = the number of male observations belonging to the jth demographic group, j = H, M, O.
Nf j = the number of female observations belonging to the jth demographic group, j = H, M, O.
Since fitted regression lines pass through the means of the data, the difference between overall raw mean for male and female students can be decomposed like the following way:
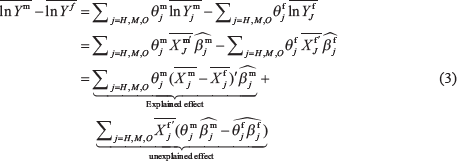
In case of social groups (SC, ST and General), the similar expression can be obtained:
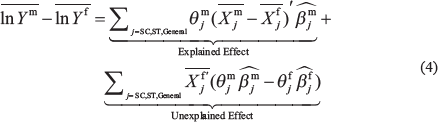
Further, in order to identify the religious or social groups with the1 acute problem of gender bias, a similar decomposition is done separately for each jth demographic group like the following way:
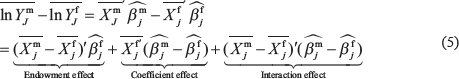
‘Endowment Effect’ is the expenditure gap due to differences in the average characteristics between males and females. This is the ‘Explained’ part. If males and females had the same endowments, this term is zero. In the ‘Unexplained’ part, the ‘Coefficient Effect’ represents the differential treatment of characteristics (due to difference by sex) when a particular set of characteristics is given. Interaction Effect accounts for the fact that the endowments effect and coefficients effect exist simultaneously between two groups.
In this article, we examine the implications of this decomposition within two types of demographic groups, viz., ‘Religious groups’ and ‘Social groups’. Religious groups include Hindu, Muslim and Others. Social groups include SC, ST and General.
To do this, the regression equations specified in Equation (1) and Equation (2) are estimated for male and female students separately for each jth demographic group. The components of the decomposition in Equations (3) and (4) are then estimated for all demographic groups. Finally, using Equation (5), these components are compared over all demographic groups to identify the demographic group where the magnitude of gender bias is the strongest.
The dataset used here is the 71th round data on participation and expenditure on education conducted by the National Sample Survey Office (NSSO), Government of India, for West Bengal. The span of the dataset is January 2014–June 2014. The survey has been conducted over 29 states and six Union Territories. This is the latest dataset available that contains detailed information on education expenditure. From this dataset, a complete profile of household education expenditure pattern at the individual level is available.
In West Bengal, the number of students at the Class 10 level and below is 6,079 (3,279 in the rural sector and 2,800 in the urban sector).
From the NSS item classification, the items pertaining to ‘education’ exclusively for these students are: ITEMLIST (see Majumder & Mitra, 2016).
Results and Discussion
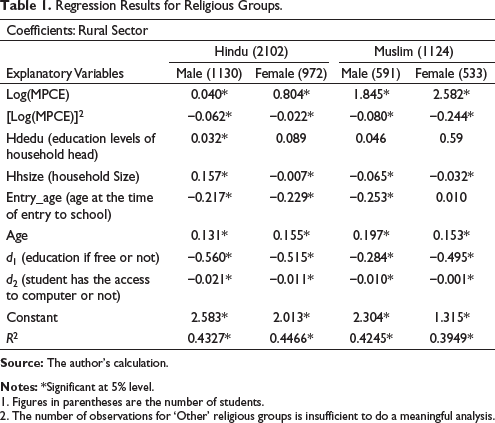
In Table 1, the regression results for male and female students belonging to religious groups Hindu and Muslim 2 are reported separately for both sectors. The R2 ranges between 0.3949 and 0.5361. It can be observed that the coefficients of Log (MPCE) and [Log (MPCE)]2 are positive, significant and negative, significant, respectively, for both religious groups in both sectors, thus having the expected signs. The coefficients of ‘Hhsize’ are positive, significant for male students and negative, significant for female students in both sectors for both religious groups. That is, with the increase in household size, there is a cut-down in educational expenses for female children, whereas this is not the case for male children. The coefficients of ‘Hdedu’ are statistically non-significant except for Hindu Male in the rural sector (positive) and Hindu Female in the urban sector (positive). It can be argued that the educated household head would spend more for the male children, but female children will remain unattained. In the urban sector, the educated household head is more likely to spend on female children for their education. The coefficients of ‘Entry_age’ are significant, negative in both sectors for both religious groups, except for Muslim female students in the rural sector (non-significant). This indicates that, in general, the higher entry age of students at schools leads to lesser expenditure on educational items. This finding can be explained in the following way: parents of the students starting school at higher age give less importance to their children’s schooling and their educational needs as, generally, children start their schooling at higher age when they were engaged in other activities (domestic, agricultural, etc.) during actual school-going age. This reasoning is further supported by the positive, significant coefficients of Age in both sectors for both religious groups. Balestra et al. (2017) found that the children with higher age at the time of entry to school have better cognitive skills as compared to other children. The coefficients of the dummy variables d1 and d2 are negative, significant in both sectors and for both religious groups, implying that expenditure on children’s education decreases if the education is free (d1 = 1) and if the student has access to computers (d2 = 1) as computer access reduces charges for items like photocopy and allied items.
Regression Results for Religious Groups.
Regression Results for Religious Groups.
Figures in parentheses are the number of students. The number of observations for ‘Other’ religious groups is insufficient to do a meaningful analysis.
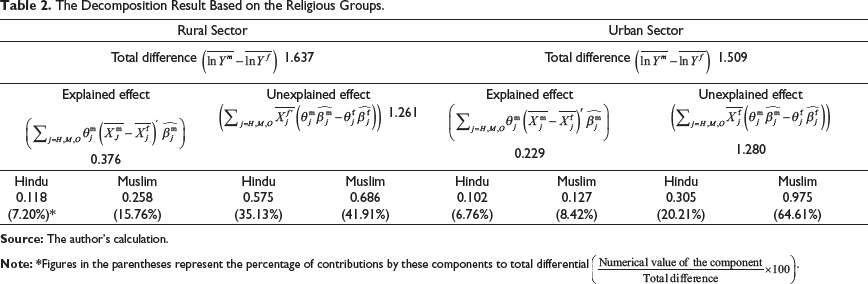
Table 2 describes the decomposition results based on the religious groups. The following observations are in order. First, the total differential (male expenditure—female expenditure) of mean expenditure is positive in both sectors. Second, it can be seen that the magnitude of the ‘Unexplained Effect’ component is higher compared to the ‘Explained Effect’ component for both sectors. This explains the fact that the treatment of characteristics by students differs by their sex. Thus, the unexplained part, which reflects differential returns to measured characteristics of males and females, has a larger contribution, and hence points to discrimination, as noted earlier. Third, in terms of religious groups, the unexplained effect of the Muslim group is contributing the highest in both rural (41.91%) and urban sectors (64.61%). This indicates the fact that the presence of the differential returns of males and females is acute for Muslims, which implies the fact that the problem of gender bias is acute in the Muslim group compared to the Hindu group.
The Decomposition Result Based on the Religious Groups.
In Table 3, the results of the decomposition for each religious group are presented. The following observations are in order. First, the total differential of mean expenditure (i.e., male expenditure—female expenditure) is positive and higher for Muslims than Hindus in both sectors. Second, the major contributor to this difference is the ‘Coefficient effect’ for both religions and sectors. Since this component quantifies the differential treatment of characteristics, a positive value clearly points to pro-male bias. 3 Third, the contribution of the ‘Coefficient effect’ is the highest for the Muslim group in the urban sector and followed by the Hindu group in the rural sector. Further, the fact that the ‘Coefficient effect’ is higher in the Muslim group indicates a higher degree of gender bias in this community with respect to education expenditure.
The Decomposition Result within Religious Groups.
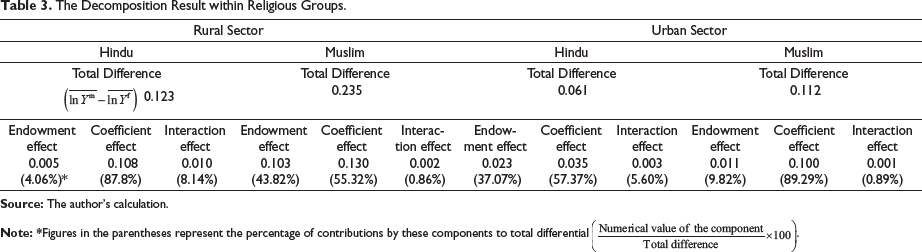
Table 4 presents the regression results relating to the social groups. Here the R2 is the range between 0.3649 and 0.6422. The number of observations in the ST group in the urban sector is insufficient to run a meaningful regression. It can be seen that the coefficients of Log (MPCE) and [Log(MPCE)]2 are positive, significant and negative, significant, respectively, for all social groups in both sectors. The coefficients of Hhsize are positive and significant for both sexes in the ST group and negative and significant only for females in the SC group in the rural sector. For the urban sector, the coefficient is significant only for male students in the SC group with a negative sign. Thus, in the General group, hhsize does not seem to play any role, in the ST group in the rural sector, there is no differential role between males and females, but in the SC group, the effect is negative for females in the rural sector and for males in the urban sector. The coefficients of ‘Hdedu’ are statistically non-significant for all the social groups, except for General Male (positive) in the rural sector and the urban sector (positive). Nair (2009) presented a striking difference across the social groups in terms of parental endowments in Andhra Pradesh, elsewhere in India. These classes are significantly backward in terms of education. Possibly, a very few heads would have the required educational capability to understand the significance of education in their children’s lives. The oefficients of Entry_age are negative, significant and coefficients of Age positive, significant across groups, sexes and sectors. This pattern is similar to that for the case of religious groups. The coefficients of the dummy variables d1 and d2 are negative, significant in both sectors and for both religious groups, leading to similar explanations as in the case of religious groups.
Regression Results for Social Groups.
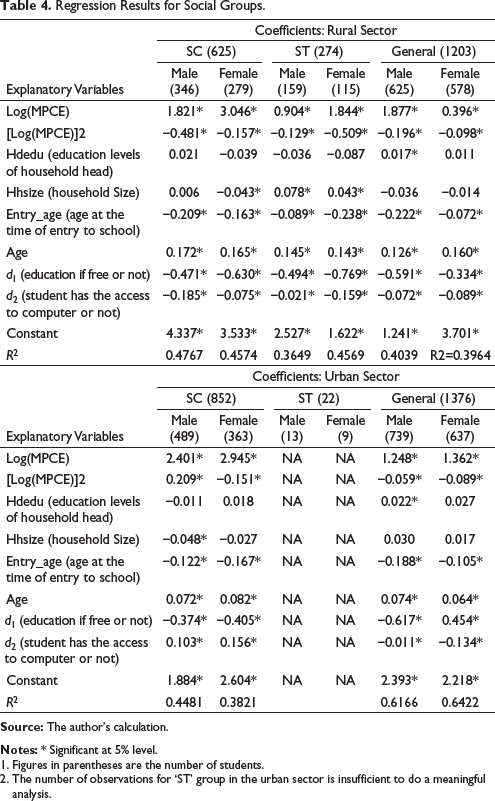
Figures in parentheses are the number of students. The number of observations for ‘ST’ group in the urban sector is insufficient to do a meaningful analysis.
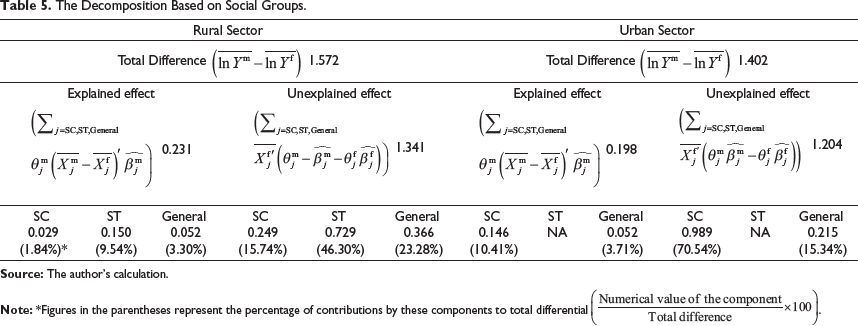
In Table 5, the components of the differentials based on social groups are reported. Among the components of total differential, the ‘Unexplained Effect’ is the highest contributor in both sectors across all social groups. In the rural sector, the contribution of ‘Unexplained Effect’ by ST is the highest (46.30%), whereas that by SC is the highest in the rural sector (70.54%). Hence, it indicates the fact that pro-male gender exists in both sectors across all social groups, and the problem is acute in the ST group in the rural sector and in the SC group in the urban sector, respectively.
The Decomposition Based on Social Groups.
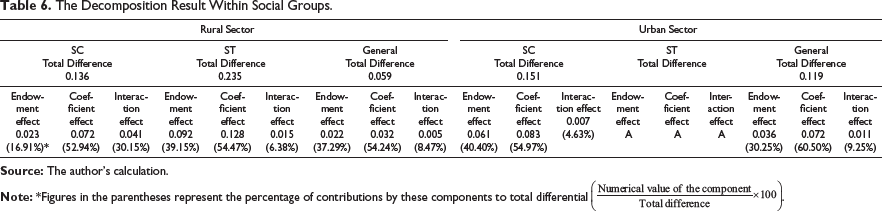
In Table 6, the components of the decomposition for each social group are reported. Among the components of the decomposition of total differentials of mean expenditure on education between male and female students, the ‘Coefficients effect’ is the highest contributor for all social groups. This implies that there exists pro-male bias in education expenditure across all social groups. Further, a comparison of the components over all three social groups in the rural sector and two groups in the urban sector shows that the total differential component is maximum for the ST group in the rural sector and for the SC group in the urban sector. The ‘Coefficient effect’ is maximum for ST in the rural sector and for SC in the urban sector. Hence, it can be concluded that the magnitude of gender bias is the highest in the ST group in the rural sector and gender bias is higher in the SC group compared to the General group in the urban sector.
The Decomposition Result Within Social Groups.
In this article, the gender bias in education expenditure in the religious and social groups is examined using the 71st round education data provided by NSSO. The underlying methodology is the Oaxaca–Blinder decomposition technique. The evidence of pro-male gender bias is found in both religious groups, with a higher magnitude for ‘Muslims’ in both sectors. For the social groups, pro-male gender bias is evident in all groups, with ST in the rural sector and SC in the urban sector showing higher magnitudes.
Footnotes
Acknowledgement
The author would like to thank Prof Amita Majumder for her guidance and assistance.
Declaration of Conflicting Interests
The author declared no potential conflicts of interest with respect to the research, authorship and/or publication of this article.
Funding
The author received no financial support for the research, authorship and/or publication of this article.