
Abstract
Aim/Background
Accurate staging of lung cancer is critical for treatment planning and prognosis. Traditional methods typically rely on binary classification and manual analysis of computed tomography (CT) scans, limiting diagnostic precision and scalability in clinical settings.
Objectives
This study introduces a deep learning-based system to automatically classify lung CT scans into three tumor–node–metastasis (TNM) categories.
Materials and Methods
The proposed method starts with automatic segmentation of various lung abnormalities, including internal and juxtapleural nodules, using an enhanced conditional generative adversarial network (c-GAN). Subsequently, a hybrid approach combining support vector machines (SVM) and deep neural networks is used to assign TNM stages. The model leverages a multilevel architecture to extract both local and global image features, integrates patient-independent data separation, and incorporates explainable artificial intelligence (AI) components.
Results
The automated system eliminates the need for manual region of interest (ROI) selection and delivers staging performance that rivals current high-end TNM classification tools. Compared to conventional binary classifiers, the proposed approach provides a comprehensive diagnostic model with improved accuracy and clinical relevance.
Conclusion
This work presents a robust and scalable AI-driven framework for lung cancer staging that aligns with established clinical protocols. By minimizing manual intervention and enhancing model interpretability, the approach supports more efficient and accurate analysis of CT scans in real-world healthcare environments.
Keywords
Introduction
The capability to forecast the extent of cancer at diagnosis is significant to determine the optimal course of treatment and to achieve a positive result. The cancer staging system, which was developed to give patients and healthcare professionals a prognosis for each patient and to compare patient classes participating in medical studies to receive standard care globally, is used to decide the level of cancer. The most popular cancer staging method among doctors is the tumor–node–metastasis (TNM) approach, which assesses the main tumor’s size and spread (T), association of regional lymph nodes (N), and occurrence of distant metastases (M). To classify lung cancer into TNM phases, this study created a multilevel deep-learning classifier. To eliminate an undesirable noisy area from the computed tomography (CT) data, the first-level lung segmentation method uses an appropriately tuned conditional generative adversarial network (c-GAN) algorithm. The following steps involve obtaining the deep features needed for each of the three support vector machine (SVM) classifiers using three distinct pre-trained ResNet50 networks. The Cancer Imaging Archive (TCIA) database is used to test and train suggested algorithms, which contain 422 unique patients with corresponding CT scans. The TNM class distribution is as follows:
T1: 107 patients; T2: 105 patients; T3: 105 patients; T4: 105 patients.
Data augmentation was applied during training and included random rotations, flips, and contrast adjustments to improve model generalization. The dataset was split into training (70%), validation (15%), and test (15%) sets. Importantly, the split was patient-independent to avoid data leakage, ensuring that no scan from a given patient appears in more than one subset.
Literature Survey
Radiologists are finding that computer-aided diagnostic (CAD) technologies facilitate better decision-making. Deep learning techniques and technology are driving a rapid increase in CAD accuracy across all medical imaging domains. Magnetic resonance imaging (MRI), CT, and positron emission tomography (PET) scans are among the imaging modalities now used to diagnose lung cancer. Among these, CT scans offer sufficient details for non-small-cell lung cancer (NSCLC) diagnosis and staging. Numerous studies have concentrated on employing deep learning techniques to identify malignant tumors in lung CT scans, as evidenced by research on lung nodule categorization using CT images and deep learning algorithms. 1 The identification of a tumor’s malignancy comprises three steps: feature extraction, feature subset selection, and classification. 2 Lung cancer diagnosis involves two stages: staging Cheng et al., additional examination of the tumor’s malignancy, and lesion finding. 3
Benign and Malignant Classification Using Patch Approach
Most of the previous studies on the discovery of lung cancer focused on differentiating between benign and malignant nodules. Studies have utilized region of interest (ROI) patch images from datasets such as the Lung Image Database Consortium (LIDC) and the Image Database Resource Initiative (IDRI). For binary and ternary classifications, Kang and Liu introduced a multiview convolutional neural network (MV-CNN), showing that the multiview method performs better than single-view methods. Similarly, Da Silva classified lung nodules as benign or malignant by combining a deep-learning model with a genetic algorithm.4, 5
A binary classifier based on a four-two-pathway CNN was proposed by Dey et al. for class label translation of 3D pictures. A basic 3D CNN, an enhanced 3D DenseNet with multiple outputs, a new multi-output network, and a 3D DenseNet were all included in the proposed CNN. 6
Zhao et al. built a cross-CNN combining AlexNet and LeNet using layer settings from LeNet and parameter configuration from AlexNet. The performance of the ideal network yielded an accuracy value of 0.8220 and an area under the curve (AUC) of 0.8771. 7
Xie et al. 8 suggested a lung nodule classifier using texture, shape, and deep model-learned information. To construct a classifier, three descriptors were used: a texture descriptor, a Fourier-shape descriptor, and a deep convolutional neural network. As a result, the LIDC–IDRI dataset’s performance accomplished an accuracy of 96.65%, 94.45%, and 81.24%, respectively, which was significantly higher than the accuracy attained by other techniques.
By decreasing misclassification, Shakeel et al. developed a method to increase lung image quality and lung cancer diagnosis. The weighted mean histogram equalization technique was used to eliminate noise from CT images in the TCIA dataset. 9
Benign and Malignant Classification Using Whole CT Images
An automated classification technique for identifying lung diseases in CT scans was presented by Lakshmanaprabu et al., using optimal deep neural network (ODNN) and linear discriminant analysis (LDA). To categorize lung nodules into binary groups, LDA was used to decrease the deep characteristics that were taken from the CT lung images. 10
Halder et al. established a lung nodule segmentation technique using an adaptive morphological filter. The filter, which applied adaptive structural elements, identified candidate nodule regions and reduced false positives from CT slices, enhancing detection accuracy. The SVM classifier was trained using features derived from the candidate nodule regions based on morphology, texture, and intensity. Using the LIDC/IDRI dataset, the proposed method obtained sensitivity, specificity, and accuracy of 94.88%, 93.45%, and 94.27%, respectively. 11
For the classification of lung cancer, Nanglia et al. presented a hybrid technique that combines a feedforward back propagation neural network (FFBPNN) and SVM. The method’s overall classification accuracy was 98.08%. 12
Tiwari et al. proposed a lung cancer detection method using a mask unit (MU)-based 3FCM algorithm and a target-based weighted Elman deep learning neural network (TWEDLNN). When tested on the LIDC–IDRI dataset, the algorithm demonstrated a 96% improvement in detection accuracy over current techniques. 13
A fusion-based method for segmenting and classifying lung CT and PET images was proposed by Mohana Priya and Venkatesan. 14 Ultimately, an SVM classifier was used, and it achieved 99% classification accuracy using texture and intensity information.
TNM Classification
The present focus is on creating algorithms that use CT scans to categorize lung cancer into TNM stages, as opposed to previous work that concentrated on identifying benign or malignant lung nodules.
A CNN-based lung cancer classifier using two neural networks for feature extraction and classification from FDG-PET/CT images was presented by Kirienko et al. The classifier achieves 90% accuracy, 47% recall, 67% specificity, and 0.68 AUC while performing binary classification between T1–T2 and T3–T4 classes. 15
Paul et al. suggested CNN-based methods for nodule identification, aimed at the follow-up of cancer patients. This method utilized three CNN models, improving accuracy and flexibility. 16
Zhao et al. established a 3D neural network to predict lymph node metastasis in T1 lung adenocarcinoma using CT images combined with prior clinical knowledge. 17
Mandal and Moitra introduced a 1-D CNN prototype for automatic staging and grading of NSCLC. 18
Materials and Methods
The methodology for applying AI and data analytics in proactive healthcare risk management involves several key steps: data collection, data preprocessing, model development, validation, and deployment.
Multilevel Deep Learning Approach for TNM Classification
The creation of a multilevel deep learning method is gaining traction since it increases process efficiency overall by enhancing performance at each level. ROI photographs acquired with the assistance of specialists are used by existing lung cancer algorithms for algorithm testing and training. The two-fold classification of provided nodule patches as malignant or benign has been the main focus of these existing systems. Oncologists and radiologists who treat lung cancer, however, base their classification strategy on the TNM classification. The suggested multilevel deep learning technique is depicted in Figure 1. It develops a fully autonomous TNM classifier by utilizing different levels of deep learning algorithms. First, to aid in process automation, a c-GAN is created for the segmentation of the lung. The segmentation procedure makes sure that all the lung image’s nodules are included and that non-lung areas are removed. The c-GAN consists of a generator and a discriminator, both conditioned on the input CT scan slices. Generator comprises five convolutional layers with ReLU activations, batch normalization, and upsampling blocks to enhance feature resolution. Discriminator comprises a 4-layer CNN with leaky rectified linear unit (ReLU) activations, ending in a sigmoid output for real/fake classification conditioned on the label information. The input is a preprocessed 2D CT slice (size 224 × 224 × 1), and the output is a synthetic CT-like slice of the same dimension. Loss functions comprise, for the generator, a weighted sum of adversarial loss and L1 reconstruction loss, and for the discriminator, binary cross-entropy loss distinguishing real versus synthetic images.
Multilevel Deep Learning for Survival Probability Estimation in Tumor–Node–Metastasis (TNM) Lung Classification.
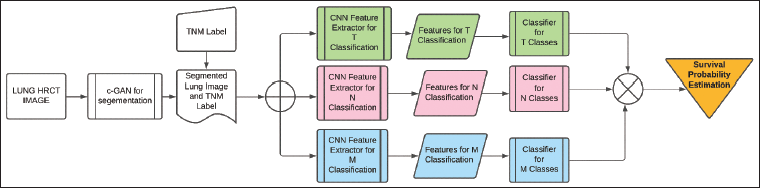
In order to extract the deep features needed in relation to TNM, a segmented lung picture is fed to three separate ResNet50 algorithms that have already undergone pre-training.
A pre-trained ResNet50 model is fine-tuned on the TCIA dataset, where feature maps are extracted at three different levels (early, middle, and deep layers), having layer configurations:
Early: Features from Conv2 block (output size ~56 × 56 × 256). Middle: Features from Conv3 block (~28 × 28 × 512). Deep: Features from Conv5 block (~7 × 7 × 2048).
To categorize these structures into TNM, each Resnet50 is followed by an independent SVM. Three separate SVM classifiers are trained independently for T, N, and M stages using these extracted feature vectors. During inference, each SVM outputs a stage prediction (for T, N, and M separately). These predictions are concatenated to form a complete TNM code for the patient. If needed, a simple rule-based conflict resolution step is applied to ensure clinical plausibility (e.g., if M1 is predicted, N stage is less emphasized).
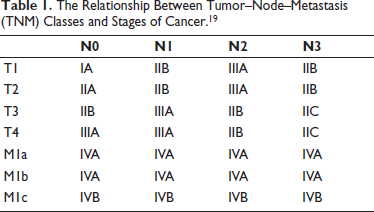
This multilayer classifier simultaneously classifies each CT image that is fed as input into three distinct sets of classes. According to the AJCC code, the classification acquired in these three classes aids in determining the cancer stage. The TNM classes taken into account in the study and how the classes relate to different stages of cancer are displayed in Table 1. These phases are helpful in determining the patient’s best course of treatment and in assessing the likelihood of survival. Additionally, this method helps assess a patient’s reaction to specific medicines.
The Relationship Between Tumor–Node–Metastasis (TNM) Classes and Stages of Cancer. 19
Formulation of the segmentation-level deep learning algorithm, deep feature extraction-level deep learning algorithms, and SVM classifiers is explained in the following subsections.
Optimal c-GAN for Lung Segmentation
The Taguchi optimization approach is employed to enhance the presentation of the c-GAN architecture. 20 The Taguchi optimization strategy is used to select and tune the c-GAN network to maximize the segmentation performance parameters of Jaccard index (J) and dice similarity coefficient (DSC).
The architecture’s performance can be adjusted by choosing the right number of multiscale feature extraction (MSFE) inception blocks. Additionally, the network is fine-tuned using Adam’s optimization parameters. The network has been fine-tuned for the suggested approach for segmenting images with nodules by utilizing an L27 orthogonal array.
Deep Learning-based Classifier
Three distinct pre-trained ResNet50 algorithms are utilized to extract deep features from segmented lung images in relation to TNM classes. In the medical image feature extraction process, especially when image databases are limited, pre-trained ResNet50 models are gaining popularity. This approach allows for effective training to acquire deep features using a smaller image collection, as it relies on a portion of the ImageNet database. 21
Deep features extracted from a specific layer of the ResNet50 model are then classified using a powerful stochastic classifier known as the SVM for the different TNM categories. At each layer, the network extracts distinct features linked to classification before progressing to next layer. 22 Dataset can be processed using GPU memory, with an activation minibatch size of 64 for efficient training.
Effectiveness of c-GAN in Lung Segmentation Process
The TCIA database is applied to train and evaluate the suggested algorithms.23, 24 Database contains CT scans of individuals identified with lung cancer, with annotations marking the tumor locations. These CT scans have a resolution of 512 × 512 pixels. Five academic thoracic radiologists who specialize in lung cancer have annotated the database. The TNM classification has been applied to the patient data. About 10–20 CT pictures of each patient are chosen for this investigation based on the annotations that are currently accessible. The following is a summary of the practical significance of TNM classes:
Tumor (T) classifications:
T1: tumor size ≤3 cm. T2: tumor size >3 to ≤5 cm. T3: tumor size >5 to 7 cm. T4: tumor size >7 cm.
Nodes (N) classifications:
N0: no regional lymph node involvement. N1: ipsilateral nodes within the lung up to hilar nodes. N2: ipsilateral mediastinal or subcarinal lymphadenopathy. N3: contralateral mediastinal or contralateral hilar lymphadenopathy, or scalene or supraclavicular nodes.
Metastases (M) classifications:
M0: no distant metastases. M1: distant metastases: M1a: regional metastatic disease (e.g., malignant pleural). M1b: solitary extrathoracic metastasis. M1c: multiple extrathoracic metastases.
By increasing performance parameters DSC and J, the network’s ideal parameters are found. Approximately 600 randomly selected CT pictures are used for training the segmentation algorithm in the 27 studies, and 1,000 CT pictures from each of the aforementioned classes are used for testing. The model’s other parameters are comparable to the article. 25 To train the suggested network for accurate lung field segmentation, a PC equipped with an NVIDIA GTX 1080 8 GB GPU and Intel Core i7 processor running at 4.20 GHz is used. The MSFE architecture yields the best network performance when images are downsampled to a 16 by 16 resolution.
Results
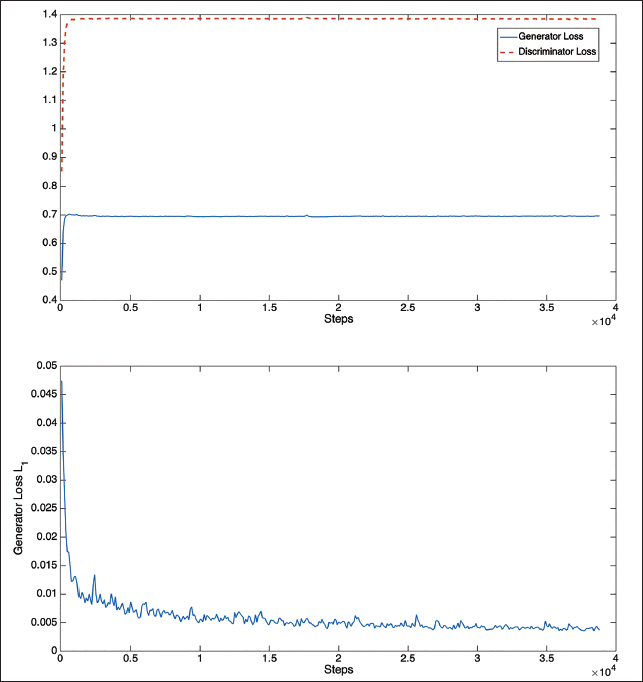
The performance of the loss function during the training stages for segmenting the lung region that includes the tumor is shown in Figure 2. These graphs demonstrate that only the early steps of the generator and discriminator loss functions exhibit convergence. But at about 20,000 steps, the L1 loss function converges.
Loss Function Plots for Training of Optimal Conditional Generative Adversarial Network (c-GAN).
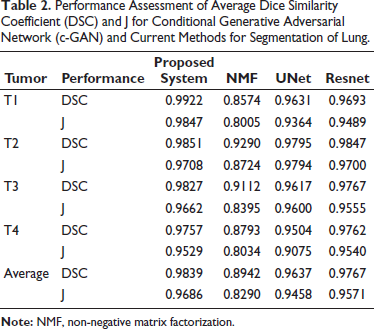
The c-GAN network, which has been optimally constructed in terms of performance, is compared to the most advanced deep networks currently in use, namely, non-negative matrix factorization (NMF), 26 UNet, 27 and ResNet. 22 All the techniques often produce performance that is passably excellent and free of nodules. But the segmentation performance begins to suffer when there are nodules. 28 The average DSC and J performances of the best c-GAN, which were obtained using 100 randomly selected images from each of the four classes—T1, T2, T3, and T4 are contrasted in Table 2 (different from training images). Segmentation performance of the suggested segmentation approach and current state-of-the-art algorithms of CT images with different lung tumors are displayed in this table. The suggested segmentation scheme performs better than the current approaches, according to the results. The suggested algorithm also has the benefit of producing better outcomes irrespective of the location and size of nodules. However, the size and location of the nodule affect the other approaches.
Performance Assessment of Average Dice Similarity Coefficient (DSC) and J for Conditional Generative Adversarial Network (c-GAN) and Current Methods for Segmentation of Lung.
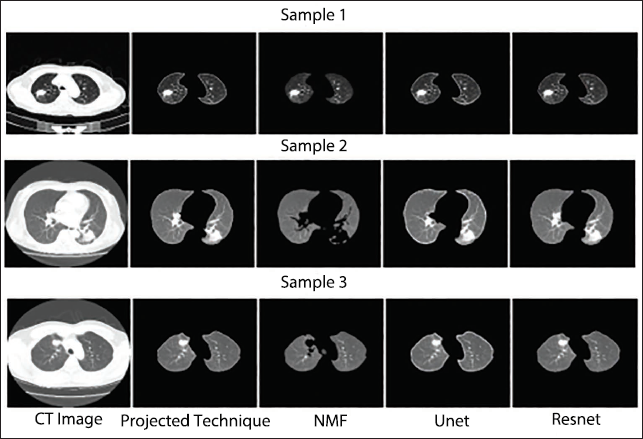
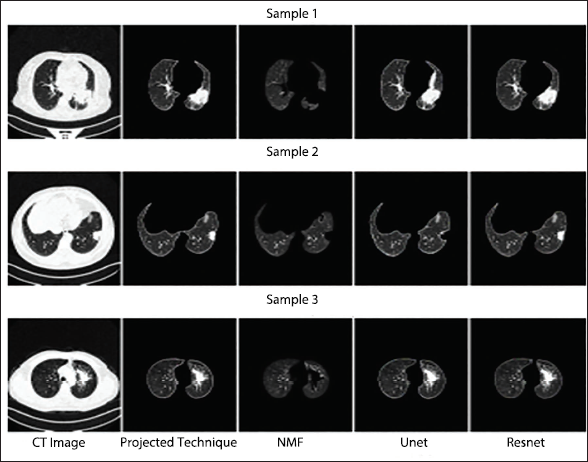
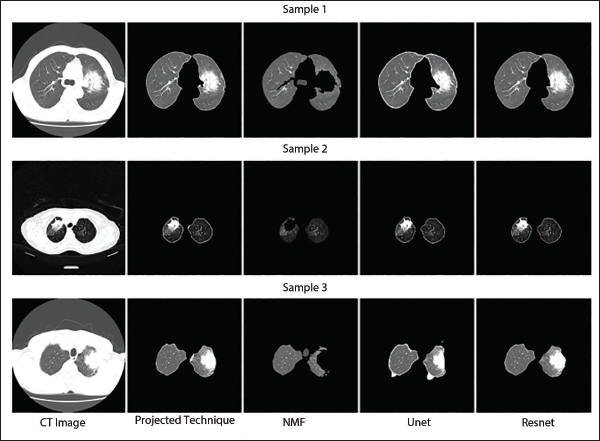
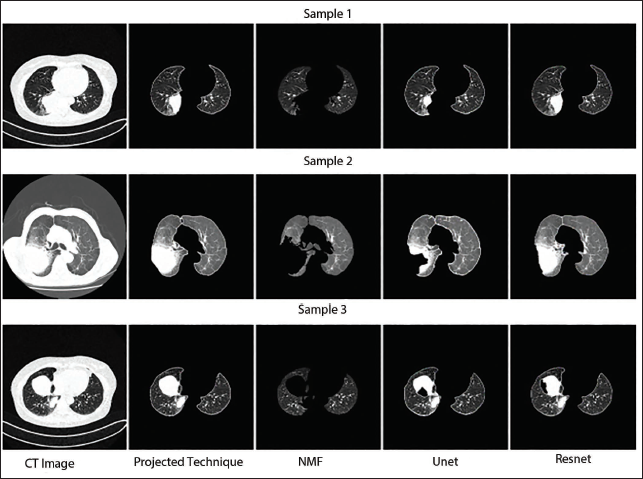
Segmentation routine study of an optimally modified c-GAN for a variety of dangerous pictures belonging to the T1, T2, T3, and T4 modules is displayed in Figures 3–6. These illustrations demonstrate that the suggested C-GAN algorithm is capable of effectively segmenting pictures with varying nodule sizes as well as the lung when a juxtapleural nodule is present. The segmentation performance algorithm also identified instances where it is challenging to distinguish between the scanning machine’s light and the lung nodule. UNet is unable to precisely capture nodule morphologies, while NMF performs badly in all four sets of pictures by ignoring the interior and juxtapleural nodules. 29 Resnet accurately segments the lung portion by adding every node, giving the suggested segmentation method a reasonably matching performance. 30 The effectiveness of the segmentation method contributes to process automation and enhances classification performance by lowering background noise in CT images (Table 1). 31
Qualitative Segmentation Performance Assessment of T1 Class Computed Tomography (CT) Imageries.
Qualitative Segmentation Performance Assessment of T2 Class Computed Tomography (CT) Imageries.
Qualitative Segmentation Performance Assessment of T3 Class Computed Tomography (CT) Images.
Qualitative Segmentation Performance Assessment of T4 Class Computed Tomography (CT) Images.
Three ResNet50 networks were developed, each followed by a novel SVM algorithm to classify TNM stages—T1, T2, T3, T4 (tumor classes), N0, N1, N2, N3 (node classes), and M0, M1a, M1b, M1c (metastasis classes). Since each segmented image had three class labels corresponding to TNM classification, separate datasets were prepared for each classification task to ensure clear training and testing processes.
The CT images were resized to a resolution of 224 × 224 pixels from the original 512 × 512 pixels during preprocessing as part of data augmentation. These resized images were then input into pre-trained ResNet50 models to extract deep features. Selecting the correct feature layers at this stage was crucial for maximizing classification accuracy. During the fine-tuning process, the weights of initial layers in pre-trained ResNet50 were frozen. Transfer learning proved beneficial in addressing the challenge of limited medical imaging data.
Before conducting a comprehensive performance analysis of classifiers, the effect of feature layer selection on classification accuracy was evaluated. Various feature layers—including fcc1000, res5c-branch2b, res5c-branch2c, avg-pool, and bn5c-branch2a—were tested. Among these, the SVM classifier achieved the highest accuracy when deep features were extracted from the bn5c_branch2a layer. These outcomes underscore the importance of precise feature selection in enhancing the performance of classification models, particularly for medical imaging tasks.
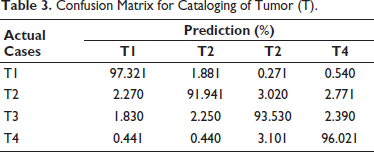
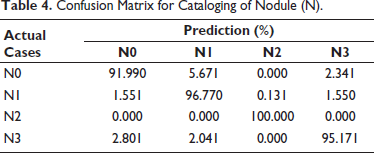
Tumor (T) categorization performance is displayed in Table 3. The system performed well even for classifying the lowest size of the tumor, as seen by the T1 class’s maximum performance of 97.32%. The increased classification accuracy for a smaller tumor suggests that this approach can be helpful in the early detection of cancer. About 2%–3% of the remaining classes are somewhat confused with the nearby classes. The tumor classification approach has an average classification performance of approximately 94.70%. Table 4 displays the effectiveness of the node (N) classification strategy. The N3 class has the best classification performance, at 100%. The N1 class has the lowest accuracy because it confuses with the adjoining N2 class by 5.67%. N2 and N4, the remaining two classes, provide somewhat accurate results. The node classification approach has an average performance of 95.78%.
Confusion Matrix for Cataloging of Tumor (T).
Confusion Matrix for Cataloging of Nodule (N).
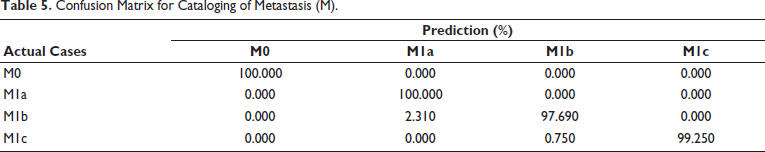
Similarly, effectiveness of metastasis (M) classification method is shown in Table 5. The fact that the M0 class result demonstrates 100% accuracy suggests that the early stages of cancer types I, II, and III can be predicted with accuracy. The M1a class provides 100% accuracy, but M1b class significantly misidentifies the M1a class by 2.31%. Since M1a and M1b belong to same IVA cancer stage, this confusion will not have an impact on the performance of cancer stage estimation. M classification technique has an average performance of approximately 99.23%.
Confusion Matrix for Cataloging of Metastasis (M).
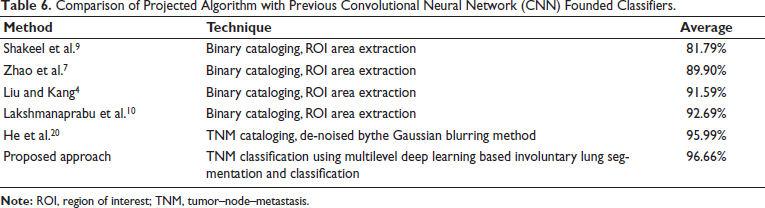
The suggested multilevel deep learning-based method’s classification performance is compared with previous literature work in Table 6. The majority of literature approaches concentrate on binary classification as benign and malignant, together with ROI patches. The suggested method has an advantage over all previous approaches in that it uses a given CT image to automate TNM categorization, saving diagnostic time so that early therapy can be started and successful treatment outcomes can be achieved.
Comparison of Projected Algorithm with Previous Convolutional Neural Network (CNN) Founded Classifiers.
Discussion
The proposed multilevel deep learning technique demonstrates significant potential in accurately classifying lung cancer stages based on TNM coding. By leveraging a hierarchical architecture, the model effectively captures both spatial features from imaging data and contextual relationships, leading to improved classification performance compared to traditional approaches. The results underscore the importance of critical features such as tumor size and lymph node involvement in accurate staging, as highlighted by explainability tools like Grad-CAM. However, challenges such as dataset bias and interpretability of complex models remain. Despite these limitations, the automated approach promises enhanced diagnostic efficiency, potentially aiding oncologists in developing precise treatment plans. Future work should focus on incorporating diverse patient datasets, expanding subcategory classification, and validating the model in real-world clinical settings to ensure broader applicability and robustness.
Conclusion
To effectively treat NSCLC, it is crucial to determine the cancer’s stage. The AJCC recommends using the TNM classification system to assess the disease stage. Following these guidelines, this study has developed three distinct methods for categorizing TNM stages to classify CT lung scans into three class groups.
An optimized c-GAN has been designed for automatic lung segmentation at the initial stage. This segmentation includes identifying lung nodules and juxtapleural nodules. The approach aligns with the classification techniques used for interstitial lung disease (ILD). Subsequently, three SVM classifiers and three separate deep-learning models were implemented to classify tumor size (T), nodal involvement (N), and metastasis level (M) based on the AJCC TNM staging system.
Key findings from this multilayered lung cancer classification approach include:
Multilayered deep learning-based segmentation and classification
A deep learning methodology was established to segment CT images and classify them into three TNM categories—tumor size (T), node location (N), and metastasis level (M). Unlike prior lung cancer classification studies that primarily focused on distinguishing cancerous from non-cancerous nodules, this approach emphasizes TNM staging for more precise diagnosis. The optimized c-GAN model effectively segmented the lungs in the initial step, removing chest region background noise and identifying nodes of varying sizes.
Use of ResNet50 networks and SVM classifiers
Three ResNet50 networks were utilized to extract deep features related to TNM classes at subsequent levels. These networks were followed by SVM classifiers, which categorized CT images into M, tumor size (T), and node location (N) classes. The proposed system demonstrated superior performance compared to traditional binary classification algorithms and showed results comparable to recently developed TNM classifiers.
Automated classification without manual intervention
A significant advantage of this approach is its ability to classify CT images into TNM stages without requiring manual selection or clipping of ROI. Furthermore, the study highlighted the effectiveness of reducing errors at each level using multilayered deep learning, which contributed to improved system performance.
Footnotes
Abbreviation
Acknowledgments
The authors would like to express heartfelt gratitude to SKN College of Engineering, Pune, for providing them with the platform, resources, and guidance necessary to carry out the research work. The institution’s supportive environment and access to state-of-the-art facilities have been instrumental in the successful completion of this study.
Declaration of Conflicting Interests
The authors declared no potential conflicts of interest with respect to the research, authorship, and/or publication of this article.
Ethical Statements and Informed Consent
This research did not involve human participants, animal subjects, or any material that requires ethical approval.
Funding
The authors received no financial support for the research, authorship, and/or publication of this article.