
Abstract
Background
Ritlecitinib (RIT) is a novel kinase inhibitor with promising therapeutic applications in the treatment of autoimmune disease alopecia areata. Accurate quantification of RIT in biological matrices is essential for pharmacokinetic studies and drug development.
Objectives
This study aims to develop and validate a sensitive and specific liquid chromatography-tandem mass spectrometry (LC-MS/MS) method for the quantitation of RIT in rat plasma and to apply this method in a pharmacokinetic study.
Materials and Methods
A sensitive and selective LC-MS/MS method was developed in a AB Sciex QTRAP 5500 coupled with Shimadzu Prominence LC-20AD UFLC (ultra-fast liquid chromatography) System using an C18 column (Xselect HSS T3 2.5 µm, 2.1x150 mm) with a mobile phase consisting of 0.1% formic acid in high-performance liquid chromatography (HPLC) grade water and 0.1% formic acid in acetonitrile (70:30, v:v). RIT (m/z 286.1 ↓ 105.7) and [ 13 C4]-ritlecitinib (internal standard, IS) (m/z 290.1 ↓ 109.7) were detected in a positive mode by electrospray ionization (ESI) using multiple reaction monitoring (MRM) and extracted from rat plasma samples through protein precipitation We validated the method according to United States Food and Drug Administration (U.S. FDA) guidelines, assessing parameters such as linearity, accuracy, precision, selectivity, sensitivity, recovery and stability. The validated method was then applied to a pharmacokinetic study in rats following the administration of RIT.
Results
On rat plasma, the LC-MS/MS method has shown exceptional linearity across the concentration range of 5–100 ng/mL. The FDA’s approved standards of ±15% matched the accuracy and precision measurements. The matrix effect was negligible, and the mean recovery was about 93%, indicating that RIT was fully extracted from plasma. Different experimental conditions found RIT to be stable. RIT is quickly absorbed, with a peak plasma concentration (Cmax) of 43.82 ng/mL occurring 0.5–0.75 hours after the dose. It then drops in concentration in a way that is biexponential, with a half-life at the end of 1.5 hours.
Conclusion
A highly sensitive and specific LC-MS/MS method for quantitation of RIT in rat plasma was successfully developed and validated. The method was effectively applied to a pharmacokinetic study, providing critical data on the absorption and elimination characteristics of RIT in rats. This established approach may support additional preclinical pharmacokinetic investigations of RIT.
Keywords
Introduction
In the treatment of alopecia areata, an autoimmune condition, ritlecitinib (RIT), which is an effective and selective kinase inhibitor, has emerged as a potentially useful therapeutic drug. This novel drug, marketed under the brand name Litfulo™, has shown significant efficacy in clinical trials, offering a new hope for patients suffering from this distressing condition. Alopecia areata is a medical condition caused by the immune system attacking hair follicles, resulting in hair loss that does not cause permanent scarring. It is estimated to afflict about 2% of people worldwide. 1 The pathogenesis involves an aberrant immune response that targets hair follicles, leading to hair loss. Despite various treatment options, there is a substantial unmet need for effective therapies.
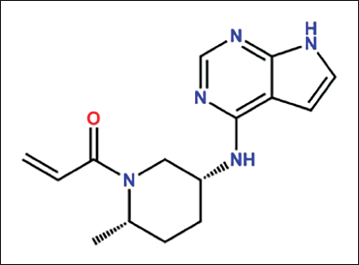
The janus kinase (JAK) inhibitor RIT targets JAK3 and the tyrosine-protein kinase (TEC) family of kinases, which are expressed in hepatocellular cancer. Chemically RIT is (3R,4R)-3-ethynyl-4-methyl-1-((1S)-1-(5-methyl-6-(7H-pyrrolo[2,3-d] pyrimidin-4-yl) pyridin-3-yl) ethyl) piperidin-4-ol (Figure 1). 2 It was developed by Pfizer and received its first regulatory approval from the United States Food and Drug Administration (U.S. FDA) in June 2023 for the treatment of alopecia areata. 3 The approval was based on robust clinical trial data demonstrating its efficacy and safety in reducing hair loss and promoting hair regrowth.
Chemical Structure of Ritlecitinib.
RIT’s selective inhibition of JAK3 and TEC family kinases primarily contributes to its therapeutic effect in alopecia areata. JAK3 is a critical component of the JAK-STAT signalling pathway, which mediates cytokine signalling involved in immune cell function and inflammation. 4 By inhibiting JAK3, RIT disrupts the signalling cascade that leads to the production of pro-inflammatory cytokines and the activation of immune cells that attack hair follicles. Inhibiting TEC family kinases also changes immune responses, which makes the drug more effective at stopping hair follicle destruction. 5
Previous studies have highlighted the usefulness of liquid chromatography-tandem mass spectrometry (LC-MS/MS) in kinase inhibitor quantitation. For instance, Xie et al. developed an LC-MS/MS method for the quantitation of baricitinib, another JAK inhibitor, in human plasma. 9 In the same way, Wang et al. reported a sensitive LC-MS/MS method for measuring tofacitinib in human plasma, showing that the method can be used in pharmacokinetic studies. 10 However, no reported methods for quantifying RIT in biological matrices exist. This gap necessitates the development of a new, highly sensitive and validated LC-MS/MS method for this novel drug.
Following the requirements for bioanalytical method validation established by the FDA, the European Medicines Agency (EMA) and other pertinent regulatory bodies, the method development and validation were carried out thoroughly by evaluating the performance characteristics of analytical methods, including accuracy, precision, selectivity, sensitivity, linearity, recovery and stability.7, 8 In order to evaluate the oral pharmacokinetic profile of the drug in rats, the LC-MS/MS approach that was developed and validated for RIT was used. The pharmacokinetic data obtained from this study will provide a comprehensive understanding of RIT behaviour in vivo, supporting its clinical development and therapeutic use.
Materials and Methods
Materials
RIT and [ 13 C4]-ritlecitinib (used as an internal standard, IS) have been provided as gifts by Glenmark Life Sciences Ltd., Mumbai. From the Merck Chemical Division, Mumbai, high-performance liquid chromatography (HPLC) grade acetonitrile, methanol, formic acid and dimethyl sulfoxide were procured. Throughout the course of the experiment, HPLC grade water from the Milli-Q water purification system was utilized. Every other chemical and solvent used was of the highest quality and conformed to HPLC grade specifications.
Instrumentation and Analytical Conditions
The RIT determination was carried out using an LC-MS/MS system that was linked to an AB Sciex QTRAP 5500 mass spectrometer with an electrospray ionization interface. (Applied Biosystems, Framingham, MA, USA). A positive mode of electrospray ionization was employed. 16 A C18 column (Xselect HSS T3 2.5 µm, 2.1x150 mm) from Waters, USA, was used for the compound separation. The mobile phase is 70:30 v/v mixture consisting of 0.1% formic acid in water and 0.1% formic acid in acetonitrile respectively. The injection volume was 5µL and the mobile phase flow rate was set at 0.35 mL/min for five minutes of run time. A temperature of 8°C was maintained for the autosampler and 35°C for the column.
The parameters for mass spectrometry were configured as follows for both RIT and IS: ion spray voltage at 5500 V, ion source temperature at 550°C, curtain gas at 15 psi, nebulizing gas at 40 psi, heating gas at 45 psi and entrance potential at 10V. Declustering potential, collision energy and collision cell exit potential for RIT were tuned to 112V, 45V and 24V respectively, whereas for IS they were tuned to 106V, 43V and 18V respectively. The multiple reaction monitoring (MRM) transitions were m/z 286.1 ↓ 105.7, and m/z 290.1 ↓ 109.7 for RIT and IS respectively. Analyst V 1.6.2 software (AB-SCIEX) was used.
Sample Preparation
A stock solution of RIT was first prepared at a concentration of 1 mg/mL in DMSO which was then diluted with diluent (methanol and water in a ratio of 70:30 v/v) for the preparation of stock calibration curve standards and stock quality control (QC) samples. To make the working calibration curve standard solution or working QC sample, 20µL of the respective stock calibration curve standard solution or stock QC sample was added to 980µL of blank plasma. Taken 100µL of the aliquot sample was added 20µL of IS (250ng/mL) and 280µL of acetonitrile (for protein precipitation) and then vortexed for five minutes and centrifugation was done at 4°C for ten minutes at 10,000 revolutions per minute (RPM). The supernatant solutions were injected into the LC-MS/MS for analysis. The standard solutions were prepared at concentrations of 5, 12.5, 25, 37.5, 50, 62.5, 75 and 100ng/mL for the calibration curve and QC samples were prepared at concentrations of 5.1 ng/mL (lower limit of quantification, LLOQ), 15ng/mL (low-quality control, LQC), 40ng/mL (middle quality control, MQC) and 80 ng/mL (high-quality control, HQC).
Validation
The analytical method was fully validated on rat plasma, following the guidelines of the U.S. FDA and EMA.7, 8 Specificity/selectivity, sensitivity, linearity, precision & accuracy, matrix effect, recovery, dilution integrity and stability are among the parameters that were evaluated during validation.
The selectivity of the experiment was assessed by analysing plasma samples from six distinct rat sources. 17 These samples included blank plasma, blank plasma spiked with the IS (zero calibrator), blank plasma spiked with the RIT working solution and IS and plasma samples collected after oral treatment. RIT and the IS chromatographic retention times were compared between samples to ensure no interference from endogenous compounds or contaminants in the plasma.
By correlating the analyte’s peak ratio to IS with the standards’ nominal concentrations, calibration curves for RIT in rat plasma were generated using a weighting factor of 1/X2. 12 To evaluate the method’s accuracy and precision, QC samples (5, 15, 40 and 80 ng/mL) were used to calculate the square of the correlation coefficients (r2), which were regarded as satisfactory as they were more than or equal to 0.99. For intra-day precision and accuracy, two independent runs of the six preparations of QC samples were estimated on the same day. On the other hand, experiments were carried out over two days to compute the inter-day values. The relative standard deviation (%CV) was used to represent precision, and the percentage of calculated value with respect to the nominal value (expressed as %nominal) was used to calculate accuracy. The precision and accuracy criteria for acceptance are % CV ≤ 15.00% and % nominal should be from 85.00 to 115.00 respectively, except for LLOQ, whose criteria for acceptance are % CV ≤ 20.00% and % nominal should be from 80.00 to 120.00. 7
The matrix effect was evaluated for RIT by comparing the instrument’s response for the analyte and IS in six different lots of matrix samples (analyte and IS spiked in blank extract) at LQC and HQC levels to the response for the analyte and IS in a reference solution prepared in diluent at the corresponding concentration. The matrix effect was assessed by matrix factor and internal standard normalized matrix factor (ISNMF). The ISNMF from 0.85 to 1.15 is said to be acceptable. 13 The recovery was evaluated by comparing the instrument’s response to RIT and IS in extracted samples at LQC, MQC and HQC levels (six preparations each) to the response in extracted blank matrix spiked with RIT and IS (post extraction spiked samples) at the same levels. The % CV of the % recovery should be not more than (NMT) 15.00. 7
The stability of the RIT stock solution (1 mg/mL) and IS (0.01 mg/mL), as well as the stability of the spiking solution (5000 ng/mL) and IS (250 ng/mL), was tested by comparing the peak response of a freshly prepared solution with solutions that were stored under short-term conditions (approximately 25°C for 6 hours) and long-term conditions (− 20°C for 10 days).
The stability of RIT in rat plasma was assessed by analysing three sets of LQC samples with a concentration of 15 ng/mL and HQC samples with a concentration of 80 ng/mL. The short-term stability study was conducted at a temperature of 25℃ for a duration of six hours prior to processing. In addition, samples that were stored at a temperature of –20°C for a duration of four weeks were analysed to assess their long-term stability. The stability of the treated samples was determined by subjecting them to an autosampler at a temperature of 4°C for a period of 24 hours. Samples that underwent five freeze-thaw cycles were examined to determine their freeze-thaw stability. The stability samples were assessed by comparing them to the newly created ones. A sample was deemed stable if the variation in accuracy was equal to or less than 15.00%. 18
DQC at 200 ng/mL was performed to assess dilution integrity. Samples were then diluted five and ten times with blank rat plasma, resulting in 40 ng/mL and 20 ng/mL respectively. Accuracy and precision were determined by doing an individual run with six repeats. The acceptance criterion for diluted samples required accuracy (% nominal) to be between 85.00 and 115.00% and precision to be NMT 15.00%. 18
Application in Pharmacokinetics Studies
Experimental Animals and Laboratory Conditions
The rats employed were healthy Sprague-Dawley rats aged two to three months, with a weight range of 180–220 g. The animals were acquired from Enveda Therapeutics India Private Limited, Hyderabad (Reg no.: 2200/PO/Rc/S/2022/CPCSEA). The animals were acclimated to the laboratory conditions for a duration of five days. During this time, they were provided with appropriate nourishment and water. The animals were housed in a standard laboratory environment, which consisted of a 12/12 dark/light cycle, room temperature and about 50% humidity. All pharmacokinetic testing was conducted in strict compliance with the guidelines set forth by the Institutional Animal Ethics Committee (IAEC) for the responsible use of animals in research.
Animals were given a single oral dosage of RIT in the form of one capsule. Blood samples of 1.0mL were obtained at certain time intervals: 0.25, 0.5, 0.75, 1, 1.5, 2, 2.5 and 3.5 hours after the administration. Subsequently, the blood samples were transferred into RIA tubes containing K2 ethylenediaminetetraacetic acid (EDTA). The blood was subjected to centrifugation at a speed of 4,000 RPM in a refrigerated centrifuge for five to ten minutes to separate the plasma, which was thereafter stored at a temperature of –20°C until the research findings are analysed.
To prepare the sample, 20µL of an IS (250 ng/mL) 280µL of acetonitrile was added to 100µL of rat plasma followed by vortexing and centrifugation and the supernatant solutions were collected for quantification. The plasma peak concentration (Cmax) and time to attain Cmax (Tmax) following oral administration were measured directly from the plasma concentration–time profile. The pharmacokinetic profile of RIT was determined using the WinNonlin (Version 5.2) software.
Results and Discussion
LC-MS/MS Method Development
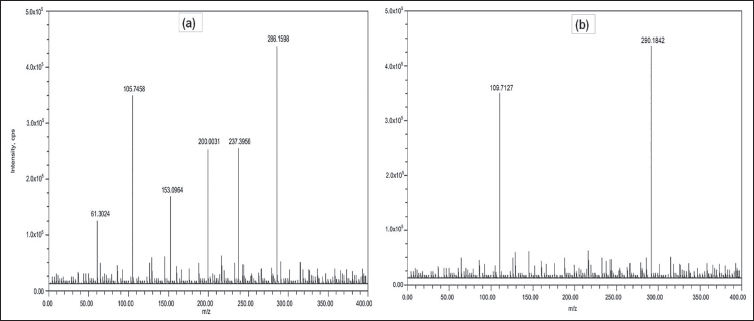
Our technique for measuring RIT in rat plasma samples is a very sensitive LC-MS/MS approach by using simple protein precipitation as an extraction step. 15 RIT and the IS were ionized in the ES+ mode. 16 The parent ions of the RIT and IS were identified at m/z 286.1 and 290.1 respectively. Figure 2 illustrates the most notable components in the product ion spectra, which were m/z 105.7 for RIT and 109.7 for IS. MRM mode was used to measure the amount of RIT (m/z 286.1 ↓ 105.7) and IS (m/z 290.1 ↓ 109.7). MS/MS parameters such as the declustering potential, collision energy and collision cell exit potential were optimized for both RIT and IS to get adequate response. Achieving the necessary chromatographic separation was accomplished by adjusting the mobile phase composition and column. The ultimate liquid chromatography (LC) conditions included using a polar reversed-phase column with a customary mobile phase composed of 0.1% formic acid in HPLC grade water and 0.1% formic acid in acetonitrile (70:30, v:v). 16
Mass Spectra (a) Ritlecitinib and (b) [ 13 C4]-Ritlecitinib.
Method Validation
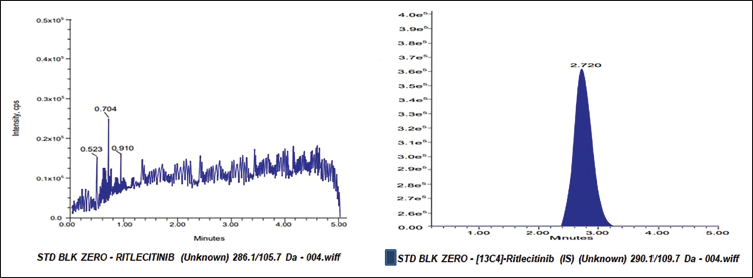
RIT and the IS were successfully separated from the endogenous components of blank rat plasma under optimal LC-MS/MS conditions (Figure 3). At the RIT and IS retention times, the blank rat plasma exhibited no interference. The IS peak was the only one that the zero-calibrator showed. The findings showed that the established technique for analysing RIT in rat plasma samples was specific. RIT and IS exhibited peaks near 2.7 minutes in the LLOQ chromatogram, and the results were accurate and precise, proving the method’s sensitivity.
MRM Chromatogram of Zero Calibrator.
The RIT calibration curves were generated in the range of 5–100 ng/mL. The resultant linear equations were found to be y = 0.01790x + 0.03985 (r2 = 0.9923) respectively, using a 1/X 2 weighting factor (Figure 4). 17 The accuracy of all the standards ranges from 89.69 to 107.96%. The ratios of RIT and the IS’s peaks were directly proportional to their plasma concentration, demonstrating the assay’s linearity within the evaluated range with good accuracy and precision.
Linearity Plot.
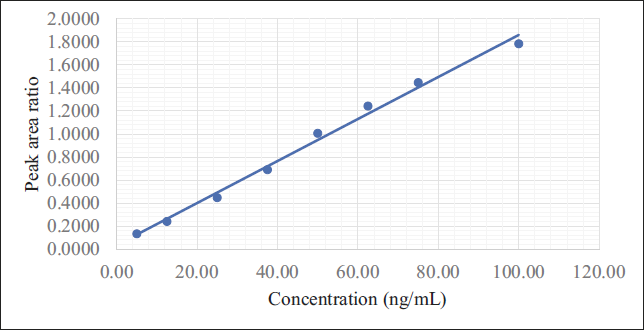
Table 1 illustrates the precision and accuracy findings for intra-day and inter-day periods. The accuracy values varied from 95.89 to 99.48%, while the precision values ranged from 4.54 to 8.55%. Table 1 illustrates the dilution integrity quality control (DIQC) results in rat plasma after five and ten dilutions. The accuracy values vary from 95.91 to 96.60%, while the precision values range from 3.00 to 6.57%. These findings demonstrate the dependability of the validated technique in analysing samples that surpass the upper limit of quantification after being diluted. 17
Method Validation Results.
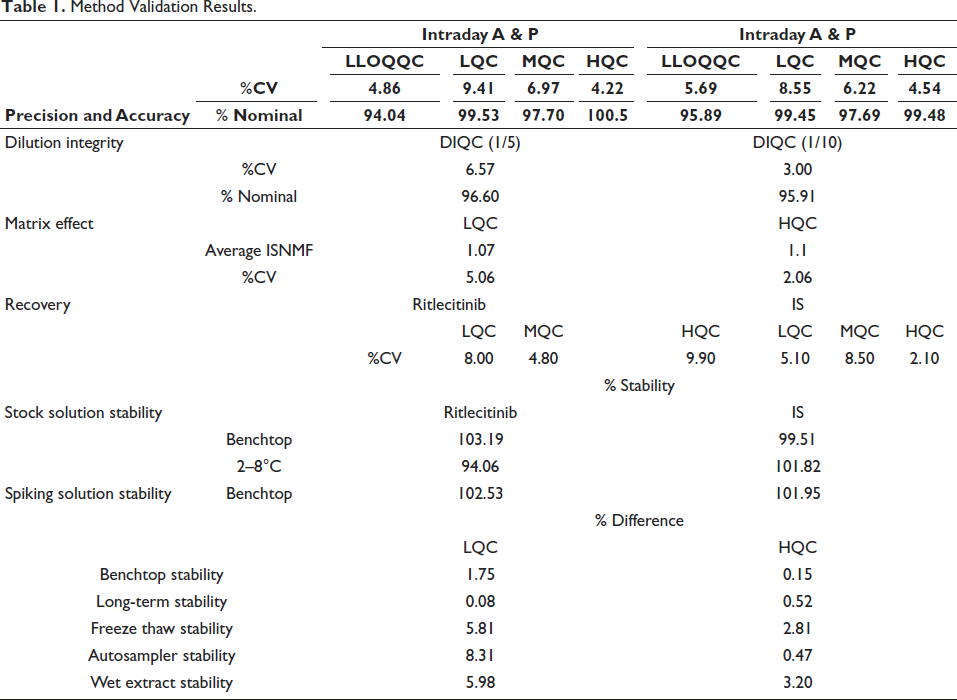
A study was carried out to evaluate the matrix effect of the analyte and IS in samples, where matrix effect (ISNMF) values are 1.07 and 1.10 for LQC and HQC and %CV < 15% at both levels. These data suggest the absence of matrix effects for RIT and IS in rat plasma. The recovery study revealed that the %CV values of IS and RIT in rat plasma varied from 2.1 to 9.9. The findings indicate that the protein precipitation approach is appropriate for extracting compounds from rat plasma samples.
For RIT, the short-term and long-term stabilities (similarity factor) of the stock solution were 103.19 and 94.06% respectively, while for the IS, they were 99.51 and 101.82%. The spiking solution’s short-term stabilities (similarity factor) were 102.53 and 101.95% for RIT and the IS respectively. Table 1 demonstrates the stability of RIT in rat plasma at LQC and HQC levels. RIT demonstrated stability during both short- and long-term storage, having a peak area bias of <15% comparing stored and newly extracted samples. Stability was within the acceptable range in both processed samples kept in the autosampler for 24 hours and QC samples that underwent five freeze-thaw cycles. The results indicate RIT maintained its stability when subjected to the specified storage and handling conditions.
In summary, our findings fulfilled all requirements, demonstrating the dependability of the established technique for analysing RIT in rat plasma.
Pharmacokinetic Study
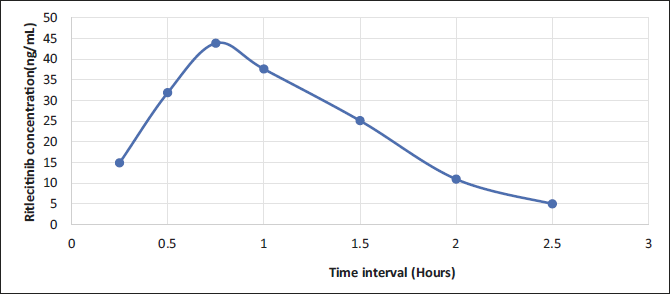
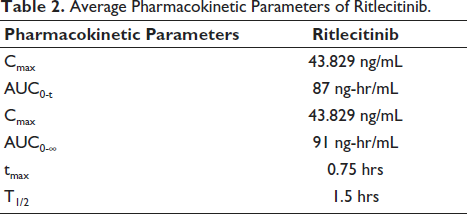
A pharmacokinetic investigation was conducted in rats using the developed bioanalytical method. Figure 5 displays the typical patterns of RIT plasma concentration over time after taking one capsule orally as a single dosage. The pharmacokinetic variables derived from the above profiles are consolidated in Table 2. The drug content in the rat plasma was easily quantifiable up to 3.5 hours after administering the medication. RIT achieved its maximum concentration (Cmax) in the plasma of rats at 0.75 hours after being administered. The Cmax, Tmax and T1/2 of RIT were 43.829 ± 1.3 ng/mL, 0.75 ± 0.03 hours and 1.5 ± 0.08 hours respectively. Area under the curve (AUC) is a useful way to check how bioavailable a medication is from its dosage form. It shows the total integrated area under the blood concentration-time profile and the amount of drug that gets into the systemic circulation after being taken by mouth. AUC0-∞ for RIT was 91.74 ± 1.67 ng h/mL. In conclusion, our LC-MS/MS method appears appropriate for pharmacokinetic research involving the determination of RIT levels.
Average Plasma Concentration-Time Profile for Ritlecitinib in Rats (n = 6).
Average Pharmacokinetic Parameters of Ritlecitinib.
Conclusion
This work presents a straightforward and precise LC-MS/MS technique for accurately measuring the concentration of RIT in rat plasma. The bioanalytical approach was thoroughly verified following the criteria of the U.S. FDA and the EMA. The method demonstrated excellent repeatability and reliability. Ultimately, the established technique was effectively used in the pharmacokinetic investigation of RIT to ascertain its drug concentration in rat plasma. The existing analytical methodology and the results of our study will be beneficial for future inquiries and clinical examinations of RIT.
Footnotes
Abbreviations
Acknowledgments
We would like to thank R&D centre, Glenmark Life Sciences Ltd., Mumbai for providing us standards as gift.
Declaration of Conflicting Interests
The authors declared no potential conflicts of interest with respect to the research, authorship and/or publication of this article.
Funding
The authors received no financial support for the research, authorship and publication of this article.
Ethical Approval and Informed Consent
The pharmacokinetic experiment conducted on healthy rats was approved by the IAEC under the protocol number 2200/PO/Rc/S/2022/CPCSEA-69/A. All procedures were performed following the guidelines outlined by the Committee for the Purpose of Control and Supervision of Experiments on Animals (CPCSEA), ensuring the ethical treatment and welfare of the animals used in the study.