
Abstract
Kaji-ichigoside F1, a pentacyclic triterpenoid saponin, exhibits various beneficial pharmacological effects. In this study, a simple, rapid, and specific high-performance liquid chromatography-tandem mass spectrometry method for rapid quantification of kaji-ichigoside F1 in rat biological matrix was developed. Plasma was prepared by a single-step protein precipitation followed by separation of the analyte using an Inertsil ODS-3 column with a gradient mobile phase. Positive ion electrospray was used and selected reaction monitoring transitions were m/z 673.27 → 511.15 for kaji-ichigoside F1 and m/z 429.19 → 267.29 for morroniside, respectively. The developed method was validated with linear range of 20 to 10 000 ng/mL. All validation parameters were well within the acceptance limit based on the guidance of FDA. The validated method was successfully applied to analyze samples from the in vivo and in vitro pharmacokinetic studies in rats.
Rosa roxburghii Tratt, named Cili in Chinese, belongs to the Rosa genus of Rosaceae family and contains various phytochemicals including organic acid, polysaccharide, vitamins, flavonoids, and triterpenoids. 1 It has been known to exhibit many beneficial actions on anti-aging, 2 prevention of atherosclerosis, 3 prevention of diabetes, 4 improvement of immunity, 5 anticancer, 6,7 antimutation, 8 and increasing fertility. 9
Kaji-ichigoside F1 (Figure 1(a)), a pentacyclic triterpenoid saponin, is the principal bioactive component in R. roxburghii Tratt. It has been proved to be effective in the treatment of acute high-altitude hypoxia, which might be related to its abilities to improve the damage of brain tissue, reduce the level of serum malondialdehyde, and increase the content of superoxide dismutase. 10 In recent studies, it was reported that kaji-ichigoside F1 showed in vivo hepatoprotective effect at doses of 50 to 100 mg/kg due to the plausible mechanism of reduction of D-GalN-induced cytotoxicity. 11 Another research suggested that kaji-ichigoside F1 had anti-inflammatory/antinociceptive activity. 12

Chemical structures of (a) kaji-ichigoside F1 and (b) morroniside (IS).
Kaji-ichigoside F1 has beneficial effects in many diseases. But up to now, only a few studies have been carried out to determine the content of kaji-ichigoside F1 in R. roxburghii Tratt and other traditional Chinese medicine using HPLC-UV method. 13,14 To the best of our current knowledge, the in vivo and in vitro pharmacokinetic characteristics of kaji-ichigoside F1 in rats were still unclear. The objective of the present study was to investigate the in vivo and in vitro pharmacokinetic profiles of kaji-ichigoside F1 in rats, which can help elaborate the relationship between the intensity and time course of pharmacological events and the in vivo toxicological effects of ingredients, and extend the scope of the use and acceptance of different species. 15,16 The researches were systematically investigated by a simple, rapid, and specific LC-MS/MS method.
For kaji-ichigoside F1 and morroniside (IS, Figure 1(b)), the product ion scan spectra are presented in Figure 2. As shown in Figure 3, all samples are found to have no interferences from endogenous substances at the retention regions of kaji-ichigoside F1 (2.10 minutes) and IS (1.84 minutes) in the chromatograms of blank plasma samples obtained from 6 different sources. Calibration curves were constructed by plotting the peak area ratios of kaji-ichigoside F1 to IS vs the concentrations of the calibration standards. The linear regression of kaji-ichigoside F1 in the rat plasma exhibited good linear relationships in the range from 20 to 10 000 ng/mL (r2 = 0.9918) with the mean value of regression equation as y = 1.34 × 10⁻⁴ x - 4.61 × 10⁻⁴ (w = 1/x2 ). The LLOQ for kaji-ichigoside F1 in the rat plasma was found to be 20 ng/mL within the acceptance limit of ±20%.

Product ion scan spectra of (a) kaji-ichigoside F1 and (b) morroniside (IS).

SRM chromatograms of (a) kaji-ichigoside F1 and (b) morroniside (IS) in rat plasma. Chromatographic profile of (I) a blank plasma sample, (II) a sample of plasma spiked with kaji-ichigoside F1 (20 ng/mL) and IS, and (III) a sample of plasma at 30 minutes after intravenous administration of kaji-ichigoside F1. SRM, selected reaction monitoring.
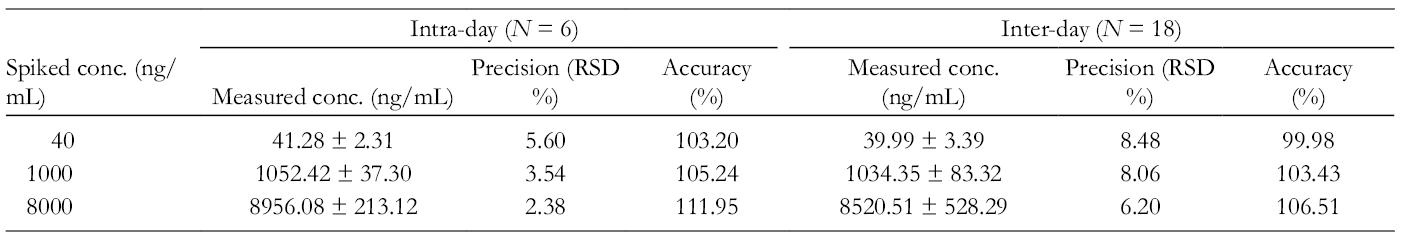
For accuracy and precision of the method, 3 concentration levels (quality control [QC] samples) of kaji-ichigoside F1 were assayed in 6 replicates on 3 days. The intra-day and inter-day accuracies were between 99.98% and 111.95%, and the intra-day and inter-day RSD was <8.48% (Table 1, n = 6). The extraction recoveries were all within the acceptable range and there was no significant matrix effect on kaji-ichigoside F1 in this method by evaluating 3 concentration levels of QC samples. Stability was investigated by analyzing the rat plasma samples at low- and high-concentration levels of QC samples. Plasma samples were subjected to storage at ambient temperature for 6 hours, to 3 freeze-thaw cycles, in the autosampler at 4°C for 24 hours, and to long-term storage conditions at −20°C for 7 days. Stability data indicated the satisfactory stability of kaji-ichigoside F1 in rat plasma (Table 2, n = 6).
The Intra- and Inter-day Precision and Accuracy of Kaji-ichigoside F1 in Rat Plasma.
Stability Data of Kaji-ichigoside F1 in Rat Plasma (Mean ± SD, N = 6).

The validated method was successfully applied to study the pharmacokinetics of kaji-ichigoside F1 in rats by intravenous injection at the doses of 5.0 mg/kg. The mean plasma concentration-time profile of kaji-ichigoside F1 in rats is presented in Figure 4. The main pharmacokinetic parameters of kaji-ichigoside F1 in rat plasma are summarized in Table 3.
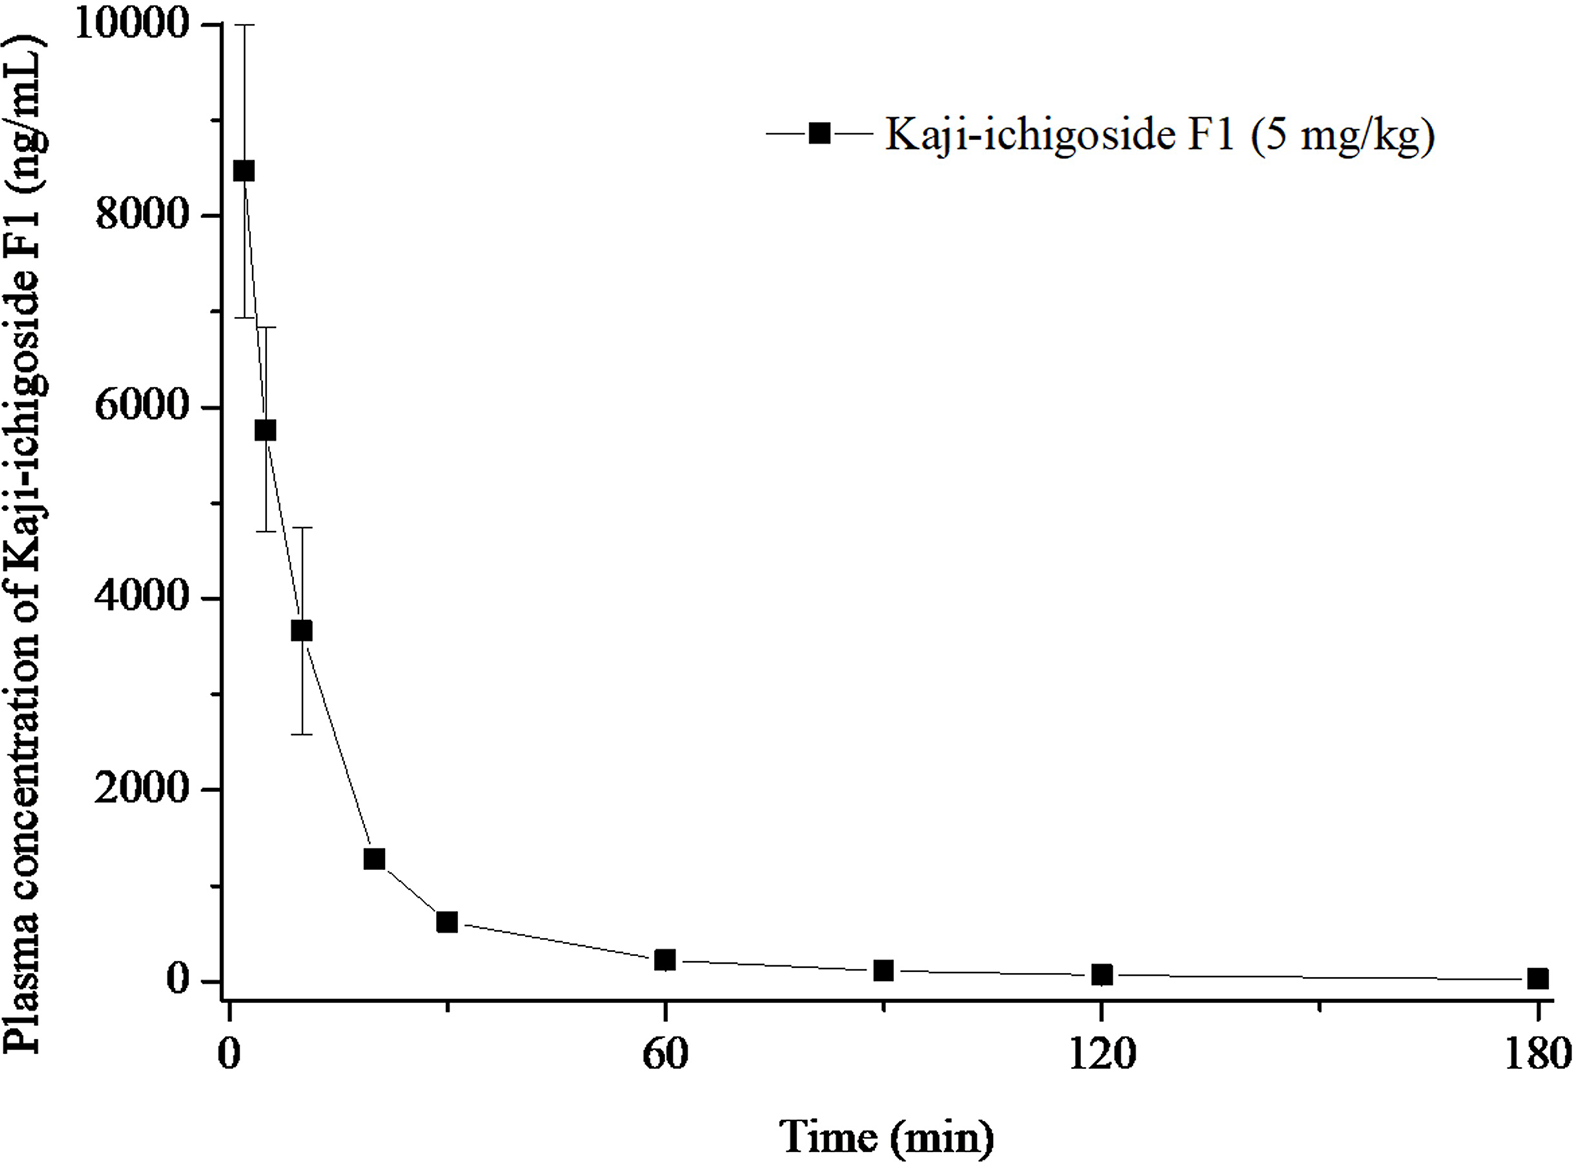
Plasma concentration-time profile of kaji-ichigoside F1 following intravenous administration in rats.
Pharmacokinetic Parameters of Kaji-ichigoside F1 Following Intravenous Administration at the Dose of 5 mg/kg (Mean ± SD, N = 6).

The percentages of the spiked amounts of kaji-ichigoside F1 (10 µM) remaining after 5-, 10-, 20-, 30-, 45-, 60-, 90-, and 120-minute incubation with rat hepatic microsomes are shown in Figure 5. Following 120-minute incubation, 15.63% of spiked amounts were recovered in the rat hepatic microsomes and the in vitro T 1/2 was 44.71 minutes.

In vitro metabolic kinetics of kaji-ichigoside F1 in rat liver microsomes.
In summary, it was the first research to develop and validate a simple, rapid, and specific LC-MS/MS method for the determination of kaji-ichigoside F1 in rat biological matrix. This validated LC-MS/MS assay was successfully applied to the in vivo and in vitro pharmacokinetic investigation of kaji-ichigoside F1 in rats. The results laid a good base for further researches of kaji-ichigoside F1.
Experimental
Chemicals and Reagents
Kaji-ichigoside F1 (99% of purity) and morroniside (IS, 99% of purity) were both purchased from Dalian Meilun Biotechnology Co., Ltd (Dalian, China). Methanol and acetonitrile, of HPLC grade, were obtained from Tedia Company, Inc. (Fairfield, OH, USA). Propylene glycol for injection was purchased from Nanjing Weier Pharmaceutical Co., Ltd (Nanjing, China). The rat hepatic microsomes and NADPH were purchased from Dalian Meilun Biotechnology Co., Ltd. All other chemicals were of analytic grade or better.
Instrument and LC-MS/MS Conditions
Chromatographic separation was performed with a Surveyor HPLC system including an autosampler, LC pump and degasser coupled to a TSQ Quantum Discovery mass spectrometric detector equipped with electrospray ionization interface (Thermo Finnigan, San Jose, CA, USA). A reversed phase Inertsil ODS-3 column (50 mm × 4.6 mm I.D., 5 µm particle size, GL Sciences Inc., Tokyo, Japan) was used for sample separation and the column temperature was set to 25°C. The mobile phase consisted of purified water and acetonitrile at a flow rate of 0.6 mL/min. Elution was in a linear gradient, with acetonitrile content changing from 5% to 25% between 0 and 0.2 minutes. Acetonitrile content was increased from 25% to 95% from 0.2 to 1.8 minutes by a linear gradient elution. Then acetonitrile content was decreased to 5% within 0.71 minutes. The total run time was 3.5 minutes per sample. The selected reaction monitoring (SRM) optimal conditions were as follows: spray voltage 3500 V, vaporizer temperature 250°C, and capillary temperature 300°C. The MS transitions optimized in SRM mode were m/z 673.27/511.15 (quantitative) and 673.27/184.69 (qualitative) for kaji-ichigoside F1 and 429.19/267.29 for IS at positive ionization mode. All the operations, acquiring and analysis of data, were controlled using Xcalibur software (version 1.4). 17,18
Preparation of Standard Solutions, Calibration Samples, and Quality Control Samples
Stock solutions of kaji-ichigoside F1 (10.0 mg/mL) and IS (2.0 mg/mL) were prepared in dimethyl sulfoxide and methanol, respectively. Proper dilutions were made in methanol to produce a series of working standard solutions of 2, 10, 50, 200, 500, and 1000 µg/mL for kaji-ichigoside F1 and 5000 ng/mL for IS. All the working standard solutions for kaji-ichigoside F1 and IS were freshly prepared when needed and stored at 2°C to 8°C in refrigerator.
Calibration standards of kaji-ichigoside F1 were prepared by spiking 1% amounts of the standard solutions in blank rat plasma. Six levels of the calibration curve were evaluated. The calibration equation was calculated by the least-squares linear regression method. The final concentrations of kaji-ichigoside F1 in plasma were 20, 100, 500, 2000, 5000, and 10 000 ng/mL. QC samples were similarly prepared in blank plasma with the final concentrations at 40, 1000, and 8000 ng/mL. All the spiked samples were treated in accordance with the plasma sample preparation process.
Plasma Sample Preparation
About 50 µL of each calibration standard samples, QC samples, and unknown samples was added with 50 µL of working IS solution (5000 ng/mL) and 100 µL of methanol and vortex-mixed for minimum 60 seconds. Subsequently, the mixtures were centrifuged at 14 000 rpm for at least 10 minutes at 4°C. After centrifugation, the supernatants were carefully transferred and a 20 µL aliquot was injected into the LC-MS/MS system for measurement.
Method Validation
The LC-MS/MS method to determine kaji-ichigoside F1 from plasma sample was validated according to the US Food and Drug Administration guidelines for bioanalytical method validation (FDA, 2018). 19 The specificity and selectivity, linearity, accuracy and precision, extraction recovery and matrix effect, and stability were fully validated.
In Vivo Pharmacokinetic Studies
Six Sprague-Dawley rats (body weight 180-220 g) with the certificate no. SCXK (Shandong) 2014–0007 were obtained from Jinan Pengyue Laboratory Animal Breeding Co., Ltd., Jinan, China. Rats were housed under controlled conditions (12 hours light/dark cycle, 23°C-25°C and 50%-70% humidity) with free access to standard laboratory rodent chow and filtered water and acclimatized in the plastic cages for 7 days prior to experiment. All the animal welfare and experimental procedures were approved by the Animal Ethics Committee at Shengli Oilfield Central Hospital, Dongying, China, and strictly in accordance with the guide for the care and use of laboratory animals (National Research Council of USA, 1996).
After at least 12 hours overnight fasting with free access to water, the rats were administered kaji-ichigoside F1 intravenously at the dose of 5 mg/kg. Blood samples (approximately 150 µL) were withdrawn from jugular vein of rats before and at 2, 5, 10, 20, 30, 60, 90, 120, and 180 minutes after dose. The blood samples were immediately centrifuged at 4500 rpm for 10 minutes at 4°C. Then the plasma samples were transferred carefully from each collection and stored at -20°C until analysis. The pharmacokinetic parameters were calculated by using DAS 2.0 software package (Mathematical Pharmacology Professional Committee of China, Shanghai, China) by a non-compartmental method.
In Vitro Metabolic Study
Rat liver microsomal incubations were conducted in triplicate. The reaction mixtures contained hepatic microsomal protein (final concentration ≈ 0.5 mg/mL), NADPH (final concentration ≈ 10 mM), and kaji-ichigoside F1 (final concentration ≈ 10 µM) and the volume was adjusted to 200 µL by adding 0.1 M potassium phosphate buffer (pH 7.4). The mixtures were pre-incubated in a 37°C water bath with gentle shaking for 5 minutes before the addition of NADPH. To the reaction mixtures was added 600 µL ice-chilled precipitant (IS solution) before and at 5, 10, 20, 30, 45, 60, 90, and 120 minutes after reaction initiated by the addition of 10 mM NADPH incubation (n = 3). The tubes were vortex-mixed for 60 seconds and centrifuged at 14 000 rpm for 10 minutes, and 20 µL of the supernatants was analyzed by using the LC-MS/MS method described above. 20 In the determination of in vitro T 1/2, the analyte concentrations were converted to percentage drug remaining, using the T = 0 concentration as 100%. The slope of the linear regression from log percentage remaining vs incubation time relationships (-k) was used in the conversion to in vitro T 1/2 values using in vitro T 1/2 = -0.693/k.
Footnotes
Declaration of Conflicting Interests
The author(s) declared no potential conflicts of interest with respect to the research, authorship, and/or publication of this article.
Funding
The author(s) received no financial support for the research, authorship, and/or publication of this article.