
Abstract
Objective
To determine the effects of deoxyelephantopin on mTOR and its related target molecules (Akt/mTOR/P70S6K) in the ER-positive breast cancer cell line.
Materials and Methods
Primary in silico simulations were determined, and the effects of deoxyelephantopin on the phosphorylation of the Akt/mTOR/P70S6K molecules were evaluated using AlphaScreen-based assays and western blot analysis, respectively.
Results
Based on the estimated FEB and K i values, deoxyelephantopin appeared to have a stronger affinity toward P70S6K as compared with Akt and mTOR. Both deoxyelephantopin and control inhibitors were observed to form hydrogen bonds with the same key residue, Leu175 of the P70S6K molecule. Deoxyelephantopin downregulated the p-P70S6K protein expression significantly from 18 µM (p < 0.05) and onward. Based on the AlphaScreen assay, deoxyelephantopin produced a concentration-dependent inhibition on the phosphorylation of P70S6K with an IC50 value of 7.13 µM.
Conclusion
Deoxyelephantopin induced cell death in MCF-7 cells possibly via DNA fragmentation, inhibition of the phosphorylation of P70SK6, and downregulation of the relative p-p70S6K protein expression levels.
Introduction
Elephantopus scaber Linn. (Asteraceae; E. scaber) is an erect rhizomatous herb, locally known as “Tutup Bumi,” 1 “Elephant’s Foot,” “Gobhi,” or “Didancao.” 2 E. scaber is widely used in ethnomedical practices. In Indian traditional medicine, it is used for treating various ailments, including cancer. 3 In traditional Chinese medicine, E. scaber is known to have heat-clearing and detoxification properties. 4 The medicinal properties of E. scaber have been described in Chinese herbology texts and are listed in the Chinese Pharmacopoeia for treating infection-related ailments such as dysentery, sore throat, fever, and other inflammation-associated illnesses. 4 This plant contains sesquiterpene lactones such as scabertopin, deoxyelephantopin, isodeoxyelephantopin, and other bioactive compounds such as epifriedelanol, lupeol, and stigmastereol.5, 6
The antitumor activity of its sesquiterpene lactones was first demonstrated by Kurokawa et al. 7 Deoxyelephantopin (Supplementary Figure 1), a major sesquiterpene, consists of an alpha–methylene gamma lactone moiety with notable biological activities. 8 It is known to possess anticancer properties based on several in vitro studies, as well as animal studies. Interestingly, it has shown potent cytotoxic activities on breast cancer cell lines, including the highly resistant triple negative strain. 9 Deoxyelephantopin is also found to suppress the metastasis of mammary carcinoma both in vitro and in vivo and more effective than paclitaxel in treating breast cancer. 10 Interestingly, it represses nuclear factor-kappa B (NF- κB) activation as part of its antitumor activities. NF-κB activation is a hallmark of tumor angiogenesis and metastasis in mammals and plays a key role in sustaining tumors.2, 10 However, its upstream effectors are not known.
The mechanistic target of rapamycin or the mTOR signaling pathway has become an important candidate pathway for drug development. As an important molecule, mTOR coordinates one of the major survival and growth pathways often dysfunctional in most cancers. Dysregulation of this signaling pathway contributes significantly to cancer pathogenesis and chemotherapy resistance. In breast cancer, PI3K/Akt/mTOR signaling pathways seem to be critical for the proliferative response mediated by estrogen, insulin growth factor, and epidermal growth factor receptor. 11 Thus, the development of mTOR signaling inhibitors is a rational therapeutic strategy for breast cancer and other tumors that presents divergent molecular characteristics. 12
As mentioned earlier, deoxyelephantopin is found to repress NF- κB activation, and the mTORC1 complex is known to contribute to NF-κB activation downstream of EGFR/PI3K/Akt signaling. 13 Mechanistically, mTORC1 accelerates NF-κB signaling by enhancing IKK (inhibitor of NF-κB kinase) activity. 13 Furthermore, mTORC1 is a crucial activator of ERα transcriptional activity, and estrogen is known to activate the mTORC1 signaling pathway.14, 15 Hence, it would be interesting to know if deoxyelephantopin affects the mTOR (upstream of NF-κB). This study aims to determine the effects of deoxyelephantopin on mTOR and its related target molecules in an ER-positive breast cancer cell line.
Materials and Methods
Materials
The MCF-7 breast adenocarcinoma cell line (ATCC® HTB-22) was obtained from the American Type Culture Collection (ATCC), USA. Fetal bovine serum (FBS), minimum essential medium (MEM), penicillin-streptomycin, and Trypsin-EDTA were purchased from Gibco, USA. Medium additives, DMSO, rapamycin, wortmannin, and insulin-like growth factor-1 (IGF-1) were obtained from Sigma-Aldrich, USA. DeadEnd Fluorometric TUNEL System, CellTiter 96 AQueous One Solution Cell Proliferation Assay, was from Promega, USA. AlphaScreen SureFire Akt 1/2/3 p-S473, AlphaScreen SureFire p-mTOR (Ser2448), and AlphaScreen SureFire p-P70S6K assay kit were purchased from Perkin-Elmer, USA. The antibodies against phosphor-mTOR, mTOR (Ser2448), phosphor-Akt (Ser473), Akt, phosphor-p70S6 kinase (Thr389), and p70S6 kinase were all obtained from Cell Signaling, USA.
Isolation and Characterization of Deoxyelephantopin
Deoxyelephantopin was isolated from E. scaber leaves and characterized as previously described. 16 E. scaber leaves were obtained from Jabatan Pertanian Relau, Pulau Pinang, Malaysia. Authentication was carried out, and a specimen voucher (IPNAT0003) was deposited at the Malaysian Institute of Pharmaceuticals and Nutraceuticals, Pulau Pinang, as previously described. 16 The structure and identity of the deoxyelephantopin were confirmed using analytical methods, including HPLC, NMR, and mass analysis as previously prescribed. 16
Molecular Docking
Briefly, the structures of deoxyelephantopin and control drugs such as rapamycin, wortmannin, voxtalisib, and staurosporine were constructed using the ACD/ChemSketch Freeware Version 11.01 (Advanced Chemistry Development, Inc., Canada) and optimized using PRODRG server (
Cell Culture and Cell Proliferation Assay
MCF-7 cell line was cultured in MEM supplemented with 2 mM L-glutamine and adjusted to contain 100 U/mL of penicillin, 100 µg/mL streptomycin, 1.0 mM sodium pyruvate, 0.10 mM nonessential amino acid, 1.5 g/L sodium bicarbonate, 0.01 mg/mL bovine insulin, and 10% (v/v) FBS. The cells were maintained in an incubator supplemented with 5% (v/v) CO2 at 37°C, and the medium was replaced every two to three days. For each independent experiment, cells from different passage numbers on different days were used. Approximately 6000 cells were seeded onto each well of two 96-well plates (T0 and T1) and incubated for 48 h. Subsequently, cells in the T1 plate were cultured in a reduced-serum medium containing 0.50% (v/v) FBS-complete MEM for 4 h, and the T0 plate was subjected to cell proliferation assay immediately. The medium in the T1 plate was replaced with a reduced-serum medium containing compound and incubated for a further 72 h. Control cells were treated with 0.10% (v/v) of DMSO (vehicle) in 0.50% (v/v) of FBS-complete MEM. Vincristine sulfate was used as a positive control. The cell proliferation assay was carried out using CellTiter 96 AQueous One Solution cell proliferation assay reagent (Promega, USA) following the manufacturer’s protocol. The absorbance was measured at 490 nM using the EnVision 2014 Multilabel Reader (Perkin Elmer, USA). All the response parameters were calculated as described previously. 19 G150, TGI, and LC50 values were determined from the interpolation of a curve-fit-spline graph, computed using GraphPad Prism Version 5.0 (GraphPad, USA).
DNA Fragmentation Detection Using DeadEnd Fluorometric TUNEL System
MCF-7 cells were cultured in Lab-Tek chamber slides (Nunc, USA), and the medium was replaced with test solutions containing deoxyelephantopin diluted in MEM medium supplemented with 0.50% (v/v) of FBS once cells reached approximately 70% confluency. Negative control cells were treated with 0.10% (v/v) DMSO diluted in MEM supplemented with 0.50% (v/v) of FBS. DNase as a positive control was included in the experiments (100 µL of DNase buffer containing 1 U/mL DNase I). The chamber slides were then incubated in a CO2 incubator at standard conditions for 24 h. Subsequently, the slides were processed using the DeadEnd Fluorometric TUNEL System kit (Promega, USA) according to the manufacturer’s protocol. The processed slides were observed using a standard fluorescein filter set to view the yellow-green fluorescence of fluorescein at 520 ± 20 nm using the Olympus Fluorescent Microscope BX51 (Olympus, USA). Images were captured using CellSens Software Version 1.4.1 (Olympus, USA) with an XC50 camera from Olympus (Olympus, USA). The mean number of positive nuclei was determined from eight different fields using a 400× magnification field from at least three independent experiments. Cells with yellow-green fluorescence (indicating DNA fragmentation) were manually quantified using a cell counter in ImageJ software (
Determination of the mTOR Signaling Pathway Inhibitory Activities of Deoxyelephantopin Using AlphaScreen SureFire Assay Kits
AlphaScreen SureFire assay kits (Perkin Elmer, USA) were used to determine the mTOR signaling pathway inhibitory activities of deoxyelephantopin in the MCF-7 cell line. AlphaScreen SureFire is a homogeneous, bead-based technology (donor and acceptor beads) that utilizes two antibodies in a sandwich assay. Laser excitation on the donor bead at a wavelength of 680 nm causes energy transfer to the acceptor bead yielding an emission signal at 520nm to 620 nm. Based on the assay, phosphorylation of molecules would result in the donor bead binding to the phosphorylated protein and subsequently attaching to the acceptor bead. The donor beads would release singlet oxygen molecules upon excitation, which triggers the cascade energy transfer in the acceptor bead, thereby producing light. The light emitted is counted as the phosphorylation count. To determine the mTOR signaling pathway inhibitory activities of deoxyelephantopin on MCF-7 cells, three phosphorylation sites were investigated, namely, p-Akt (Ser473), p-mTOR (Ser2448), and p-70S6K (Thr389).
Briefly, the cell suspension was transferred into a sterile tip tub, and 100 µL of cell suspension in medium supplemented with 10% (v/v) FBS was plated into 96-well culture plates at 20,000 cells/well. The plates were then incubated for a further 16 h. Subsequently, the medium was replaced with MEM medium without FBS and further incubated for 3 h prior to treatment according to the manufacturer’s protocol. Following that, the medium was replaced with a medium containing 0.50% (v/v) FBS and a series of concentrations of compounds such as deoxyelephantopin, rapamycin (positive control inhibitor for p-mTOR and p-P70S6K), or wortmannin (positive control inhibitor for Akt). The negative control consisted of wells containing 0.10% (v/v) of DMSO in a reduced-serum medium as above. The plate was further incubated for 2 h. Subsequently, the medium containing treatment drugs was discarded, and the cells were stimulated with the reduced-serum medium containing 600 nM of IGF-1 for 10 min (optimized for this assay) to activate the physiological activities of the cell. After stimulation, the cells were rinsed, and 1× lysate buffer was added to each well. The plate was then incubated in a plate shaker at 350 rpm and 22°C for 10 min. Approximately 4 µL of test lysate and positive and negative control lysates provided in the kit were transferred into Proxiplate-384 Plus.
The acceptor and donor reaction mix was prepared as described in the manufacturer’s protocol. Under subdued light, 5 µL of acceptor reaction mix was added to each well-containing cell lysate. The plate was then sealed with TopSeal-A (384-microplate adhesive cover; Perkin Elmer, USA) and wrapped with aluminum foil. The plate was further incubated on a plate shaker, set at 22°C and 150 rpm for 2 h. Subsequently, 2 µL of donor mix was added to each well-containing cell lysate under subdued light. The plate was sealed and incubated for another 2 h on a plate shaker. Finally, the plate was unwrapped and unsealed for signal measurements using the EnVision 2014 Multilabel Reader (Perkin Elmer, USA) under the standard AlphaScreen setting with endpoint reading mode and laser excitation with a total measurement time of 130 ms and an excitation time of 40 ms.
Western Blot Analysis
Briefly, cells were treated with deoxyelephantopin, control drugs, or vehicle for 24 h in an incubator at standard conditions, followed by 13 nM of IGF-1 for 10 min (optimized for western blot). Rapamycin (1 µM) was used as a positive control for the mTOR signaling pathway at Ser2448 and Thr389. Wortmannin (0.50 µM) was used as a positive control on the mTOR signaling pathway at Ser473. A 0.10% (v/v) of DMSO-treated cells was used as a negative control. To isolate protein, cells were first scrapped in cold PBS solution using a cell scraper and then resuspended in 100 µL of ProteoJET Mammalian Cell Lysis Reagent (Fermentas, Canada) and processed according to the manufacturer’s protocol.
SDS-PAGE was carried out using the Bio-Rad Mini-Protean Tetra Cells System (Bio-Rad, USA) according to the manufacturer’s protocol. The resolving gel composition of 8% (v/v) was used for the higher molecular weight of proteins such as mTOR (289 kDa), and 12% (v/v) was used for lower molecular weight proteins such as Akt (60 kDa) and P70S6K (70 kDa). Electrophoresis was carried out at 180 V for 80 min. Subsequently, the electro-transfer of total protein was carried out using a Bio-Rad Mini Trans-Blot Electrophoretic Transfer Cell (Bio-Rad, USA) at 100 V for 150 min according to standard protocol. Briefly, blots were rinsed and blocked with 3% (w/v) BSA in tris base saline containing 0.005% (v/v) of Tween-20 (TBST) for 1 h and later probed with optimized primary antibodies against Akt (1:1000), p-Akt (1:500), mTOR (1:1000), p-mTOR (1:1000), P70S6K (1:1000), p-P70S6K (1:500), and β-actin (1:1000) at 4°C overnight. Subsequently, the blot was probed with secondary antibodies containing Precision Protein StrepTactin-HRP Conjugate (Bio-Rad, USA) in an optimized dilution solution containing 3% (w/v) BSA in TBST for 2 h, followed by Clarity Western ECL substrate (Bio-Rad Laboratories, USA). ChemiDoc XRS Imaging System (Bio-Rad Laboratories, USA) was used to detect the chemiluminescence signal. Quantity One 1-D Analysis Software (Bio-Rad, USA) was used to analyze the images. Image Lab Software (Bio-Rad Laboratories, USA) was used to determine band intensities and quantification. All signals were normalized to the reference protein, β-actin. Experiments were represented as the mean fold changes of three independent experiments.
Data Analysis
Statistical analysis was calculated using one-way analysis of variance followed by Dunnett’s post hoc test using GraphPad Prism 5.01 (GraphPad Software, USA), and the results are represented as mean ± SD and are considered statistically significant when p values < 0.05.
Results
Molecular Docking
In this study, control drugs and deoxyelephantopin were docked into possible binding sites of mTOR, Akt, and P70S6K, and their molecular interactions and binding affinities were determined. Briefly, for interaction with Akt protein, the calculated FEB and Ki values of deoxyelephantopin were −7.89 kcal/mol and 1.64 µM, which were relatively higher than control inhibitors, indicating a weaker interaction (Table 1). Rapamycin forms a significant number of hydrogen bonds with Akt residues such as Gly1, Glu34, and Ser240, but there were no hydrophobic interactions (Figure 1A). On the other hand, wortmannin interacts with Gly1 and Leu347 residues by forming hydrogen bonds and interacts with Arg2 (alkyl, alkyl), Phe236 (π-alkyl), Leu239 (alkyl), Leu277 (alkyl), and Arg346 (alkyl) via hydrophobic interactions (Figure 1B). Meanwhile, deoxyelephantopin forms hydrogen bonds with Lys179, Ser7, Gly159, and Phe161 residues (Figure 1C) and a single hydrophobic interaction with Val164 (alkyl; Figure 1C; Table 1). The interactions of deoxyelephantopin with Akt were dissimilar to those of rapamycin and wortmannin. The bond distances calculated for deoxyelephantopin and Akt were between 1.66 Å and 4.60 Å, longer in range as compared with the inhibitors. In addition, the fact that FEB and K i values were higher for deoxyelephantopin than for rapamycin and wortmannin shows that it has a weaker binding affinity.
Summary of Molecular Interactions of Compounds With Akt, mTOR, and p70S6K Protein.
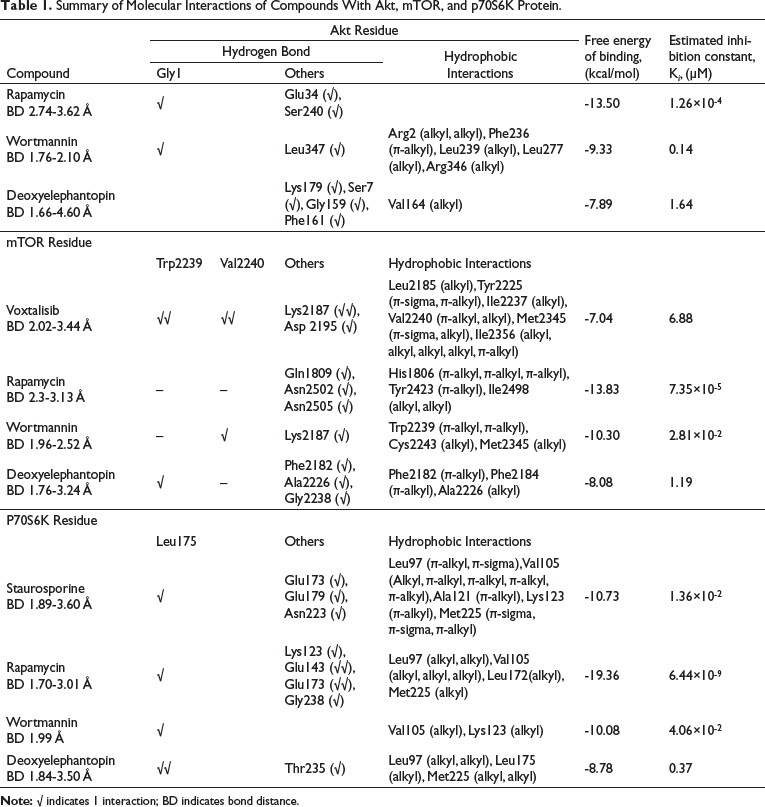
Detailed Molecular Interaction Between Compound and Substrate Binding-Site of Akt, mTOR, and P70S6K Protein (A) Rapamycin and Akt (B) Wortmannin and Akt (C) Deoxyelephantopin and Akt (D) Voxtalisib and mTOR (E) Rapamycin and mTOR (F) Wortmannin and mTOR (G) Deoxyelephantopin and mTOR (H) Staurosporine and P70S6K (I) Rapamycin and P70S6K (J) Wortmannin and P70S6K (K) Deoxyelephantopin and P70S6K. The Conformations of Ligands are Shown in Ball and Stick Representation and the α-Helix Structure of the Protein Model is Depicted in Yellow. Atoms are Colored Gray for Carbon, Blue for Nitrogen, Orange for Sulphur, Red for Oxygen, and White for Hydrogen. The Hydrophobic Interactions and Hydrogen Bonds are Depicted by Green and Black Lines, Respectively.
As for interactions with mTOR, the FEB and K i values for deoxyelephantopin were also relatively higher compared with rapamycin and wortmannin, but interestingly, lower in comparison with voxtalisib, indicating a stronger interaction with mTOR as compared with voxtalisib (Table 1). Interestingly, the K i value for deoxyelephantopin was determined at 1.19 µM, which was much lower as compared with voxtalisib (6.88 µM). Voxtalisib forms hydrogen bonds with important residues in mTOR, such as Trp2239 and Val2240, in parallel with Lys2187 and Asp2195 (Figure 1D). Rapamycin was observed to interact with Gln1809, Asn2502, and Arg2505 (Figure 1E), while wortmannin was found to interact with Lys2187 and Val2240 (Figure 1F). On the other hand, deoxyelephantopin interacts with Trp2239, which is similar to voxtalisib, and with other residues, such as Phe2182, Ala2226, and Gly2238 (Figure 1G). As for hydrophobic interactions, π-orbitals of voxtalisib were observed to have hydrophobic interactions with Met2345 (π-sigma), Tyr2225 (π-sigma, π-alkyl), Val2240 (π-alkyl), and Ile2356 (π-alkyl) residues. Meanwhile, voxtalisib forms hydrophobic interactions with Leu2185, Ile2237, Val2240, Met2345, and Ile2356 by forming alkyl interactions. On the other hand, it was seen that deoxyelephantopin formed hydrophobic π-alkyl interactions with Phe2182 and Phe2184, as well as alkyl interactions with Ala2226 residues of the mTOR molecule.
None of these residues were similar to the residues forming hydrophobic interactions with the inhibitors.
Similarly, with mTOR and Akt, the calculated FEB and K i values of deoxyelephantopin interaction with P70S6K were comparatively higher as compared with controls. However, the estimated K i value for deoxyelephantopin was lower (0.37 µM) for P70S6K compared with Akt and mTOR (1.64 and 1.19 µM, respectively). Interestingly, staurosporine, rapamycin, wortmannin, and deoxyelephantopin formed hydrogen bonds with key residue Leu175 (Table 1). Staurosporine also forms hydrogen bonds with other residues such as Glu173, Glu179, and Asn223 (Figure 1H). As for hydrophobic interactions, staurosporine forms π-orbital interactions with Leu97 (π-alkyl, π-sigma), Val105 (alkyl, π-alkyl, π-alkyl, π-alkyl, π-alkyl), Ala121 (π-alkyl), Lys123 (π-alkyl), and Met225 (π-sigma, π-sigma, π-alkyl), respectively.
As for rapamycin, in addition to interaction with key residue Leu175, it also interacts with other residues such as Lys123, Glu143, Glu173, and Gly238 (Figure 1I). It forms alkyl hydrophobic interactions with Leu97, Val105, Leu172, and Met225 residues. On the other hand, wortmannin forms only a single hydrogen bond with Leu175 and alkyl hydrophobic interactions with Val105 and Lys123 residues (Figure 1J). Meanwhile, deoxyelephantopin forms hydrogen bonds with Leu175 and Thr235 and alkyl hydrophobic interactions with Leu97, Leu175, and Met225 residues, respectively (Figure 1K). These hydrophobic interactions were similar to those with staurosporine and rapamycin at Leu97 and Met225 residues. Overall, this primary simulation suggested that deoxyelephantopin forms weak interactions with Akt and mTOR but has a relatively stronger affinity with P70S6K.
Cell proliferation and Cell Death Characterization
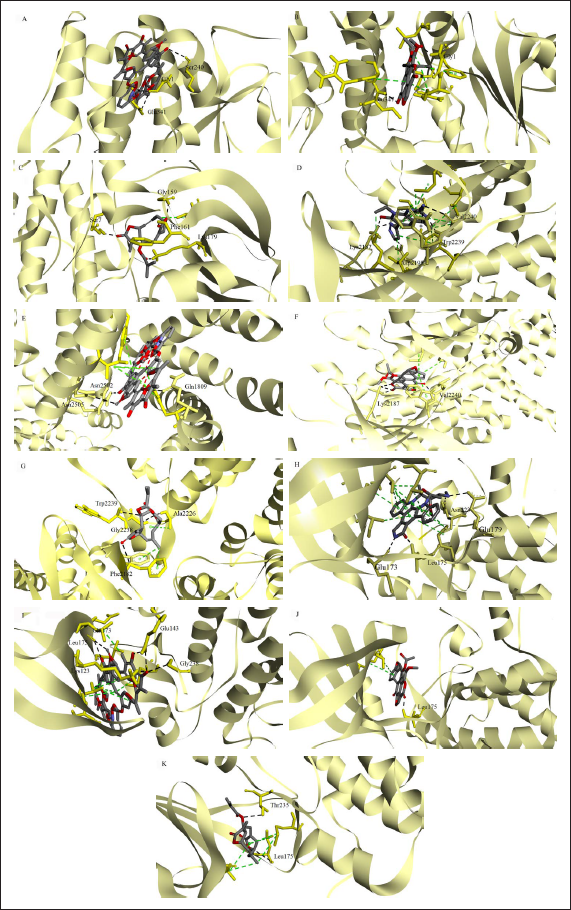
The cell proliferation effects were determined and the response parameters such as G150, TGI, and LC50 were interpolated values, representing the concentrations of which percentage growth is +50, 0, and -50, respectively. As shown in Figure 2A, deoxyelephantopin showed growth inhibitory activities on MCF-7 cells with a GI50 value of 10.84 µM, a TGI value of 13.52 µM, and an LC50 value of 18.00 µM, respectively. Concentrations between 10 and 20 µM appeared to have cytostatic and cytotoxic activities at 72 h. In comparison with the control, vincristine produced much lower values, at 1.44 µM, 3.21 µM, and 77.83 µM for GI50, TGI, and LC50, respectively (Figure 2B). Surprisingly, deoxyelephantopin exerts an LC50 value or cytotoxicity effect at a lower concentration than the control drug. For subsequent experiments, the safe concentration range for deoxyelephantopin was limited to 20 µM for all treatment durations of 24 h or less. As for cell death characterization, the possibility of deoxyelephantopin causing DNA fragmentation was investigated using the semiquantitative microscopy method. Deoxyelephantopin produced a dose-dependent effect on the MCF-7 cells (Figure 3). However, only higher concentrations of deoxyelephantopin, at 10 and 15 µM, produced a significantly higher number of positively labeled nuclei as compared to the vehicle-treated cells at 24 h (Figure 3A–E). Deoxyelephantopin appears to induce DNA fragmentation as early as 24 h using concentrations near GI50 and TGI values.
The Growth Inhibition Curve of (A) Deoxyelephantopin and (B) Vincristine Sulfate in MCF-7 Cells. Positive Values (<100%) Represent Growth Inhibition and Negative Values (<0%) Represent Cytotoxicity as Compared with Initial Cells Plated (T0). All Data are Presented as Mean ± SD of Three Independent Experiments.
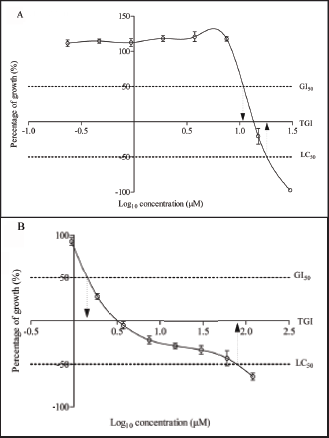
Representative Images of DNA Fragmentation in MCF-7 Cells Treated with (A) 1 U/mL DNase I (B) 0.10% v/v DMSO (C) 10 µM Deoxyelephantopin, (D) 15 µM Deoxyelephantopin (E) Mean Percentage of Cells with Positive Nuclei Determined from 100 Cells from Eight Different Fields Using 400x Magnification Field. The Yellow-Green Fluorescence Indicates the Presence of DNA Fragments After Being Treated for 24 h. Data are Presented as Mean ± SD of Three Independent Experiments (n = 3, *p ≤ 0.05).
The mTOR Signaling Protein Phosphorylation Activity
Insulin-like growth factor 1 (IGF-1) is one of the important stimuli that induce the mTOR signaling pathway. The optimization of IGF-1 concentration (EC80 value) used to activate the mTOR signaling pathway on MCF-7 cells was first carried out. The EC80 value is the concentration of IGF-1 producing 80% activation of the mTOR pathway (Akt). Based on the results, EC80 was determined at 660 nM. Hence, 600 nM of IGF-1 was used to stimulate the mTOR signaling pathway in the MCF-7 cell line after drug treatment for 2 h. Based on the experimental results, deoxyelephantopin at all concentrations appears to reduce the phosphorylation of Akt (p-Akt; Ser473) in a nondose-dependent manner for a treatment duration of 2 h. The phosphorylation count at the lowest concentration and upon stimulation with IGF-1 immediately produced a 62.3% reduction in signal counts compared to the negative control and remained rather constant thereafter (Figure 4A). By contrast, wortmannin produced a concentration-dependent inhibition of phosphorylation of Akt beginning at 20 nM and onwards, where the IC50 value was approximated at 281.80 nM (Figure 4B). All control lysates produced the expected phosphorylation and inhibition of phosphorylation counts of Akt.
Signal Quantification of p-Akt Phosphorylated at Ser473 in MCF-7 Cells After Treatment with (A) Deoxyelephantopin (B) Wortmannin. Signal Quantification of p-mTOR at Ser2448 After Treatment with (C) Deoxyelephantopin (D) Rapamycin. Signal Quantification of p-P70S6K at Thr389 After Treatment with (E) Deoxyelephantopin (F) Rapamycin. Data are Presented as Mean ± SD of Three Independent Experiments.
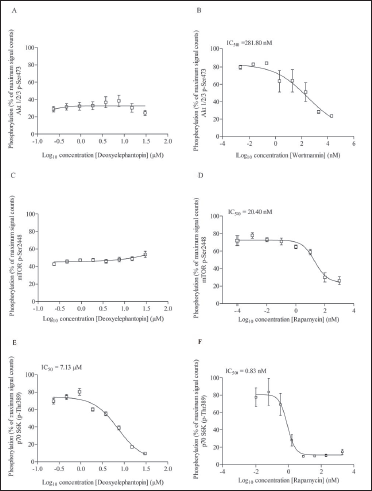
Similarly, for the phosphorylation of mTOR (p-mTOR; Ser2448), deoxyelephantopin elicited a similar inhibition pattern along the concentration range tested, comparable to p-Akt (Figure 4C). The phosphorylation count at the lowest concentration and upon stimulation with IGF-1 immediately produced an approximately 50% reduction in signal counts compared to the negative control and remained constant thereafter. By contrast, rapamycin elicited a concentration-dependent inhibition of mTOR phosphorylation with an IC50 value of 20.40 nM (Figure 4D). Surprisingly, deoxyelephantopin elicited a concentration-dependent inhibition on the phosphorylation of P70S6K with an IC50 value of 7.13 µM (Figure 4E). On the other hand, rapamycin produces an IC50 value of 0.83 nM (Figure 4F), which was expected. Based on the AlphaScreen experiments, deoxyelephantopin appears to have no clear concentration-dependent inhibition pattern on p-Akt and p-mTOR but inhibits the phosphorylation of P70S6K in a concentration-dependent manner with a relatively low IC50 value.
The mTOR Signaling Protein Expression
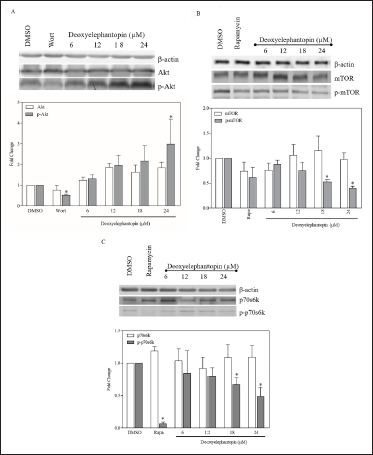
Western blot analysis revealed an increasing trend of protein expression of p-Akt in MCF-7 cells after being treated with deoxyelephantopin for 24 h (Figure 5A). However, statistically significant induction was only observed at the highest concentration (24 µM; P < .05) for p-Akt. By contrast, wortmannin reduced the expression of p-Akt significantly as compared to control cells (0.50 µM; P < .05). On the other hand, the effects of deoxyelephantopin on p-mTOR appeared to be different from those of p-Akt. Deoxyelephantopin inhibited p-mTOR expression at 18 µM and higher (P < .05) compared with control cells (Figure 5B). Although rapamycin (at 1 µM) reduced the expression of p-mTOR, it was not found to be statistically significant. As for P70S6K expression, densitometric scanning revealed that deoxyelephantopin reduced p-P70S6K significantly from 18 µM (P < .05) and onwards and appeared not to have any significant effects on P70S6K expression alone at all concentrations (Figure 5C). Rapamycin reduced the expression of the phosphorylated mTOR to almost complete inhibition.
Densitometric Scanning Analysis and Representative Images of Western Blot Analysis for the Protein Expression of (A) Akt and pAkt (B) mTOR and p-mTOR (C) P70S6K and p-P70S6K Following Treatment with Deoxyelephantopin and Control Drugs for 24 h. Data are Presented as Mean Fold Change ± SD of Three Independent Experiments. *P ≤ .05 Compared with Untreated Control (Unpaired t-test).
Discussion
Deoxyelephantopin is a major germacranolide sesquiterpene lactone in Elephantopus scaber L. or other Elephantopus genus plants. Various studies have indicated that deoxyelephantopin possesses potent activity against mammary adenocarcinoma cell lines, inhibits growth, and induces ER stress‐mediated apoptosis, leading to significant attenuation of cancer cell metastasis.10, 20, 21 The mTOR is a serine/threonine kinase belonging to the PI3K (phosphoinositide 3-kinase)-related protein kinase family. It has a crucial role in regulating a plethora of cellular proteins mediating the cell cycle, growth, survival, and death.22, 23 Upstream of mTOR is the class I PI3K and Akt (protein kinase B), which mediate mTOR activation. Activation of Akt triggers downstream activation of protein complexes mTORC1 and mTORC2 that activate gene transcription and regulate cell growth and survival. Akt phosphorylates mTOR at Ser2448 and, in turn, phosphorylates a wide range of substrates to promote protein translations, ribosome biogenesis, and other anabolic processes.24, 25 Specifically, the mTORC1 complex regulates protein synthesis through the Thr389 phosphorylation and activation of P70S6K.26, 27 Activated P70S6K is known to upregulate the translation of 5’TOP (terminal oligopyrimidine tract) mRNAs, which encode elongation factors and ribosomal proteins as part of the translation machinery. 28
The dysregulation of the PI3K/Akt/mTOR signaling pathway has been implicated in various cancer characteristics, including dysregulated proliferation and metabolism and genomic instability in tumor cells.29, 30 The PI3K/Akt/mTOR pathway activation is also one of the main causes of cancer cell resistance to chemotherapies. 30 Cancers such as breast cancers, colorectal, renal cell carcinoma, nonsmall cell lung cancer, sarcomas, and gastrointestinal tumors are known to possess a constitutively activated mTOR signaling pathway.31–35 Hence, the mTOR pathway has become a rational target for cancer drug development and therapy.36–40 Constitutive Akt signaling promotes cancer cell survival, proliferation, and progression. 41 Phosphorylation of Akt at Ser473 residue has been associated with poor prognosis in human cancers, including breast cancer. 42 In addition, pAKT overexpression has been reported as a negative prognostic factor for breast cancer in terms of overall survival (OS) and disease-free survival (DFS). 43 Meanwhile, multiple studies have demonstrated that overexpression of P70S6K and p-P70S6K are predictors of chemotherapy resistance and poor prognosis.44–50 The importance of P70S6K in cancer tumorigenesis suggests that it is a potential anticancer target, and specific P70S6K inhibitors could be developed as a therapeutic target for clinical application.
In this study, deoxyelephantopin exhibited growth inhibitory and cytotoxic activities toward the ER-positive cancer cell line (MCF-7) with a GI50 value of 10.84 µM, TGI value of 13.52 µM, and an LC50 value of 18.00 µM, respectively. These results were rather consistent with previously reported studies. The IC50 value reported for deoxyelephantopin in MCF-7 cells was 5 µM, and the IC50 values in various cell lines ranged from 0.28 to 14 µM. 51 At higher concentrations near GI50 and TGI values or 10 and 15 µM, deoxyelephantopin produced a significantly higher number of positively labeled nuclei, suggesting DNA fragmentation at 24 h as compared to the vehicle-treated cells. This observation is also consistent with another published report indicating that deoxyelephantopin-treated cell lines (including the T-47D breast carcinoma cell line) at IC50 concentrations exhibited morphological features such as cell shrinkage, membrane blebbing, nuclear fragmentation and chromatin condensation, positive annexin V/PI staining, and DNA laddering, which were all consistent with apoptosis induction after 48 h of treatment. 52 In another study, deoxyelephantopin, also dose-dependent, reduces the viability of osteosarcoma cells by inducing mitochondrial apoptosis and activation of apoptotic-related proteins, such as Bcl-2, Bax, caspase-3, caspase-9, and poly ADP-ribose polymerase. 53
In this study, deoxyelephantopin at all concentrations appears to reduce the phosphorylation of p-Akt and p-mTOR compared with negative control, but no concentration-dependent changes were analyzed using the AlphaScreen assay. By contrast, western blot analysis revealed an increasing trend of protein expression of p-Akt in deoxyelephantopin-treated MCF-7 cells, with a statistically significant induction observed at the highest concentration after 2 h of treatment. The increase in phosphorylated Akt (Ser473) expression in this cell line treated with deoxyelephantopin underlines a possible compensatory mechanism. The activation of p-Akt is likely because of indirect feedback activation effects.54, 55 For example, in some studies, Akt and eIF4E survival pathways seemed to be activated by mTOR inhibition.56–58 Akt activation is also known to occur in response to various cellular stresses, such as oxidative stress, heat shock, and hyperosmolarity.59–61 Hence, it is possible that the upregulation of p-Akt was because of cellular stress elicited by deoxyelephantopin.
However, based on the western blot results, deoxyelephantopin decreased p-mTOR protein expression significantly compared to control cells. This was similarly observed in the AlphaScreen assay for all concentrations, albeit nondose-dependent. It is important to note that the AlphaScreen assays measure phosphorylated species at a stipulated incubation time (2 h) and western blot analysis is a semiquantification of the proteins detected using commercial antibodies after 24 h. As for P70S6K protein expression, although there were no significant changes as seen with the blot analysis, deoxyelephantopin appeared to reduce relative p-P70S6K expression significantly from 18 µM (P < .05) and onwards. This observation was in concordance with the AlphaScreen assay results. Deoxyelephantopin elicited a concentration-dependent inhibition on the phosphorylation of p-P70S6K with an IC50 value of 7.13 µM, indicating that this compound is a potent inhibitor of P70S6K phosphorylation. These experimental results were also supported by the primary in silico simulation between deoxyelephantopin and targets, which suggested that deoxyelephantopin has a stronger affinity for P70S6K as compared with Akt or mTOR. Deoxyelephantopin, like staurosporine, rapamycin, and wortmannin, was discovered to interact with key residue Leu175 at the P70S6K molecule. Leu175 residue on the hinge region of the binding site of P70S6K appears to be an important site of binding for p70SK6 inhibitors.62, 63 Because proteolytic cleavage of P70S6K is important for apoptosis, 64 it is not surprising that p-P70S6K protein expression was downregulated and that DNA fragmentation was also detected at the same time. In conclusion, deoxyelephantopin induces cell death, possibly via DNA fragmentation, inhibition of the phosphorylation of p70SK6, and downregulation of the relative p-p70S6K protein levels in MCF-7 breast carcinoma cells. These properties in deoxyelephantopin and E. scaber may be useful as part of complementary treatment against breast cancer, although in vivo studies should be carried out to further prove this point.
Supplemental Material
Supplemental material for this article is available online.
Supplemental Material for The Effects of Deoxyelephantopin on the Akt/mTOR/P70S6K Signaling Pathway in MCF-7 Breast Carcinoma Cells In Vitro by Wan Failiza Wan Mohamad Fazil, Azimah Amanah, Muhammad Asyraf Abduraman, Shaida Fariza Sulaiman, Habibah Abdul Wahab, Mei Lan Tan, in Journal of Pharmacology and Pharmacotherapeutics
Footnotes
Declaration of Conflicting Interests
The authors declared no potential conflicts of interest with respect to the research, authorship, and/or publication of this article.
Funding
This work was supported in part by the Ministry of Education Malaysia under the Fundamental Research Grant Scheme (FRGS/1/2018/SKK08/USM/02/13).
References
Supplementary Material
Please find the following supplemental material available below.
For Open Access articles published under a Creative Commons License, all supplemental material carries the same license as the article it is associated with.
For non-Open Access articles published, all supplemental material carries a non-exclusive license, and permission requests for re-use of supplemental material or any part of supplemental material shall be sent directly to the copyright owner as specified in the copyright notice associated with the article.