
Abstract
Introduction:
In the world, haemoglobin abnormalities are one of the most common inherited disorders, which can be either quantitative (thalassaemia) or qualitative (haemoglobinopathy). Along with complete blood count (CBC), cation exchange-high performance liquid chromatography (CE-HPLC) helps in classifying them as traits, homozygous, and compound heterozygous disorders.
Materials and Methods:
It is a prospective study conducted for a period of two years in Apollo Hospitals, Chennai, Tamil Nadu (South India). We included a total of 500 patients for whom HPLC was asked, and excluded those with a recent history of blood transfusion (three months before sample collection). An EDTA anticoagulated blood sample was used for doing CBC using DxH 800 haematology analyser, sickling test using sodium metabisulfite and HPLC using Bio-Rad D10 analyser.
Results:
In our study, the commonest disorder was found to be heterozygous HbE (35.53%), followed by beta-thalassemia trait (31.47%), homozygous HbE (19.80%), HbE/beta-thalassemia and heterozygous HbS (each 3.55%), homozygous HbS (2.03%), HbSE and HbS-beta-thalassemia (each1.02%), heterozygous HbD, heterozygous HbC, beta-thalassemia intermedia and HbH (each 0.51%). The diseased groups mostly showed decreased RBC count, haemoglobin, haematocrit, MCV, MCH and MCHC and increased RDW. Sickling test showed positivity for 10 out of 12 cases with HbS peak.
Conclusion:
HPLC is superior and more advantageous than other methods for screening and detection of various haemoglobin disorders, as it provides rapid and accurate results. Both HbF and HbA2 can be detected and measured in a single run. It can detect even minor quantities of various haemoglobin variants, helping in the diagnosis of heterozygous states and uncommon haemoglobin disorders. It helps in the detection of various genetically inherited haemoglobin disorders in the antenatal screening, aiding early treatment and management.
Introduction
Abnormal Hb is the most common genetic disorder in the world, and it increases the global health burden. It can be either due to a defect in the structure of the globin gene (haemoglobinopathy) or a defect in the globin production (Thalassemia). In the world, they are more common in Southeast Asia, with the predominant being beta thalassaemia, followed by alpha thalassaemia and HbE. Next comes Africa, with sickle cell disease and HbC.[1,2] In India, the most common disorder is sickle cell disease, while beta thalassaemia is the second.[3]
Cation exchange-high performance liquid chromatography (CE-HPLC) is a technique of analytical chemistry used to separate, identify, and quantify each component in the mixture. It is widely used as the first line of investigation for thalassaemias and haemoglobinopathies. Together with the complete blood count (CBC), it helps in identifying and classifying them as traits, homozygous, and compound heterozygous disorders. RBC count, haemoglobin, MCV, MCH and reticulocyte count are usually reduced in homozygous and normal to near normal in heterozygous cases.[4,5] On subjecting the haemoglobin to HPLC, it elutes in the order of HbA1a, HbA1b, HbF, LA1c/CHb-1, LA1c/CHb-2, HbA1c, P3, HbA0, and HbA2. HbA0 and HbA2 are major Hb, while HbA1a, HbA1b, HbF, and P3 are minor Hb that are formed by post-translational modification of globin chains.[4]
In HPLC, beta-thalassemia trait shows elevated HbA2 of 4%–9%, whereas beta-thalassemia intermedia shows 10%–35% HbA0 and elevated LA1c, and beta-thalassemia major shows >85% HbF, <3% HbA0, and elevated LA1c. HbE trait shows decreased HbA2 and 30%–35% of HbE, which coelute with HbA2. While HbE is >85% in homozygous HbE, with minimal or nil HbA0.HbD is seen as an unknown peak with a 3.8-minuteretention time. It is 30%–45% in HbD trait and >90% in homozygous HbD.HbS peak is seen at 4.2 minutes, sometimes coeluting with HbA2. It is 30%–40% in heterozygous HbS and 70%–90% in homozygous HbS with increased HbF.HbS/beta-thalassemia shows increased HbF, 5%–10% of HbA0, and >50% HbS. HbSE shows increased HbF, <10% HbA0, 30%–50% HbA2 (coeluted HbE), and 30%–50% HbS. HbE/beta-thalassemia shows 5%–50% HbF, <25% HbA0, and 50%–80% HbA2.[4,6–8]
Objective
The objective of the study is to know the incidence and categorisation of abnormal haemoglobins, and estimation of their retention time by using HPLC in a tertiary care setup, since there are only very few studies done in South India, and early diagnosis of these helps in proper and prompt management.
Materials and Methods
This study was done for two years in Apollo Hospitals, Chennai, a quaternary care centre in South India. A total of 500 consecutive patients for whom HPLC was requested were included, and those with a recent history of transfusion (three months before sample collection) were excluded.
An EDTA anticoagulated blood sample was used. CBC using the DxH 800 haematology analyser was used for RBC indices. Sickling test was carried out using sodium metabisulfite (a reducing agent) for cases with an HbS peak. CE-HPLC was done by the Bio-Rad D10 analyser. The blood samples were diluted and injected into the analytical cartridge of D10. Bio-Rad D10 delivers a programmed buffer gradient of increasing ionic strength to the cartridge, where the haemoglobins are separated based on their ionic interactions with the cartridge material. The absorbance of the elute flowing through the flow cell of the filter photometer is recorded at 415 nm. The HbA2/HbF/HbA1c dual programme gives the chromatogram. The different Hb are identified by their retention times. Those falling outside are seen as unknown peaks.
Data Management and Statistical Analysis
The data thus collected was tabulated and analysed using statistical package for Social Services (IBM SPSS Statistics for Windows, Armonk, NY, version 25.0, IBM Corp). All the continuous variables were expressed as mean ± SD if they were normally distributed. All the categorical variables were expressed as percentages. A comparison of continuous variables was done by an independent sample t-test. For comparison of continuous variables for more than two categories, we have used ANOVA. Post Hoc analysis using LSD was done when statistical significance was found in ANOVA. A comparison of categorical variables was done by either the Chi-square test or Fisher’s Exact test. All P < .05 were considered statistically significant.
Observation
Prevalence of haemoglobin disorders in the suspected patients:
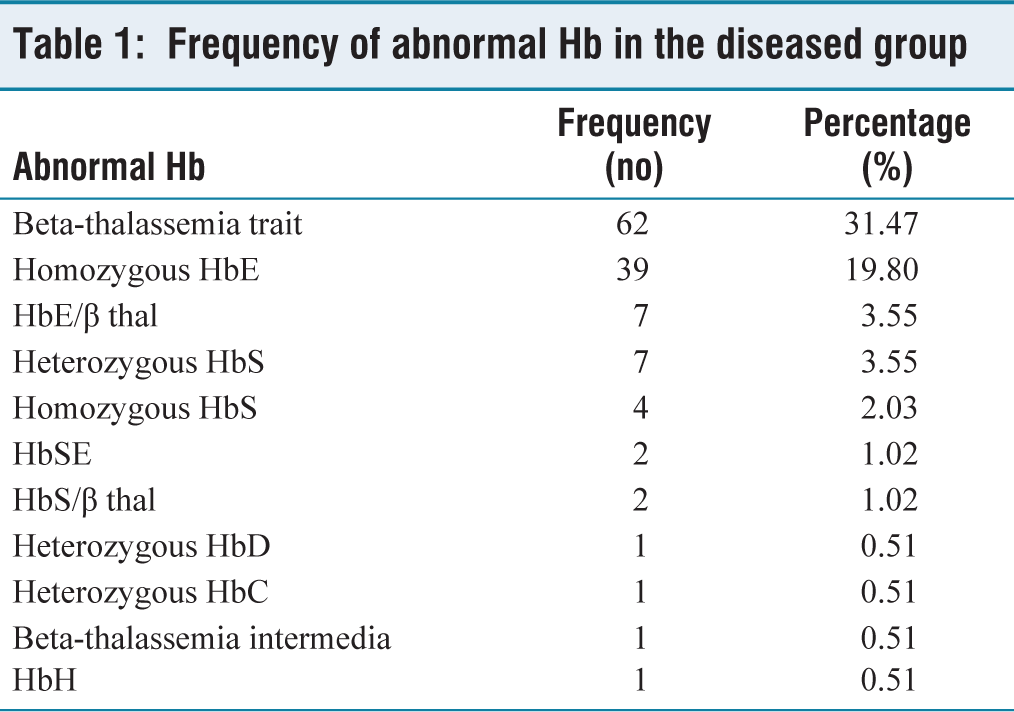
In this study, 197 (39.4%) out of 500 patients suspected of Hb disorders were found to have abnormal haemoglobin. Of which the commonest disorder was heterozygous HbE (35.53%), followed by beta-thalassemia trait (31.47%), homozygous HbE (19.80%), HbE/β thalassemia (3.55%), heterozygous HbS (3.55%), homozygous HbS (2.03%), HbSE (1.02%), and HbS/β thalassemia (1.02%). The Frequency of abnormal Hb in the diseased group is given in Table 1.
Baseline clinical profile:
The proportion of haemoglobin disorders was found to be higher in females (54.3%) than in males (45.7). This study highlights that sickle cell disorders (HbAS and HbSS) were more common among younger patients, whereas beta-thalassemia trait, heterozygous HbE, homozygous HbE, and HbE/β thalassemia were seen in individuals more than 30 years old.
Frequency of abnormal Hb in the diseased group
Haematological indices:
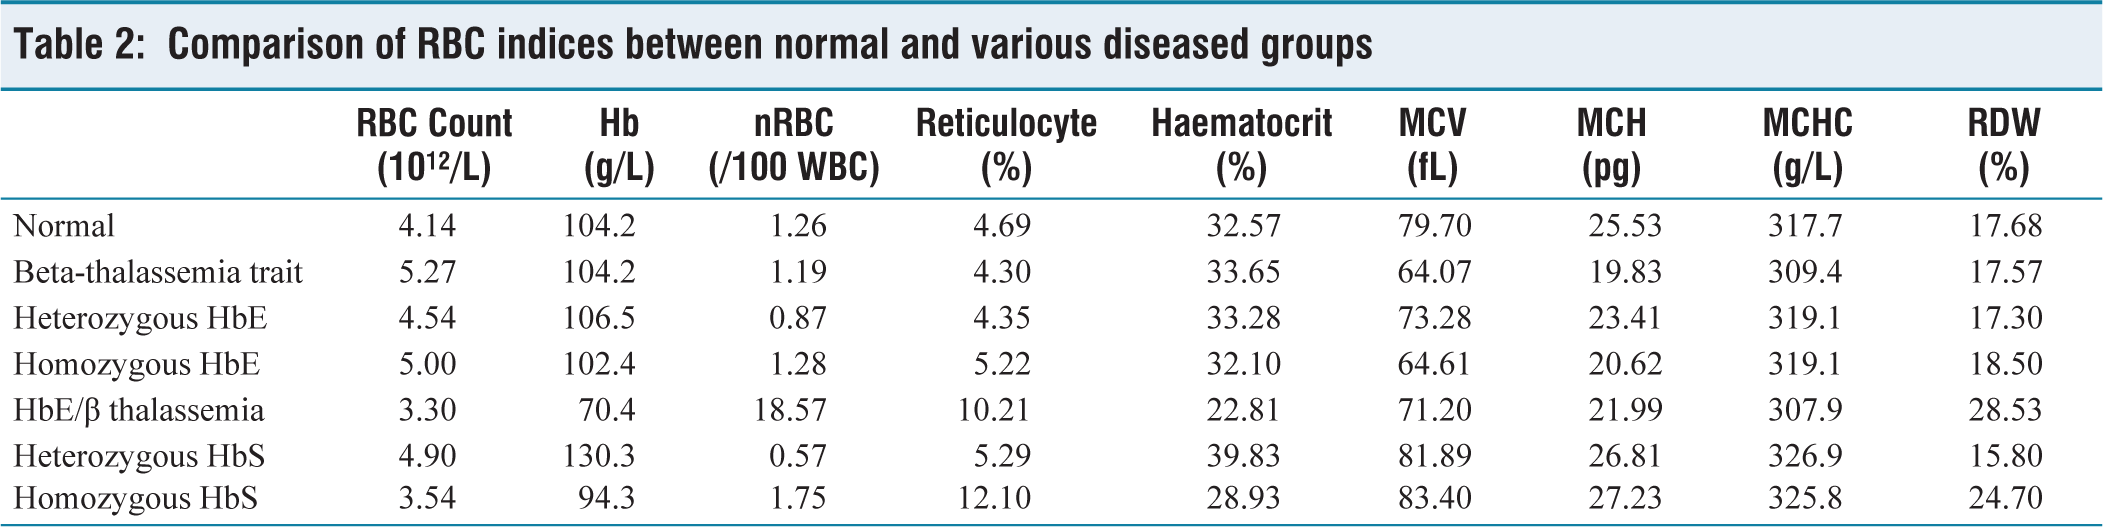
RBC count was decreased in HbE/β thalassemia (3.30 × 10¹²/L) and homozygous HbS (3.54 × 10¹²/L). A considerable decrease in the haemoglobin level was seen in the HbE/β thalassemia (70.4 g/L) and homozygous HbS (94.3 g/L) groups, whereas a slight decrease was seen in all the other groups. Decreased haematocrit level was seen in all the disease groups, whereas it was much lower in HbE/β thalassemia (22.81%) and homozygous HbS (28.93%). MCV was lowered in beta-thalassemia trait, heterozygous HbE, homozygous HbE, and HbE/β thalassemia groups. Decreased MCH and MCHC and elevated RDW were seen in all the diseased groups. Comparison of various RBC indices between the normal and diseased groups is given in Table 2. No significant difference was seen in the RBC, reticulocyte count, total WBC count, WBC differential counts, and platelets.
Comparison of RBC indices between normal and various diseased groups
Chromatogram analysis:
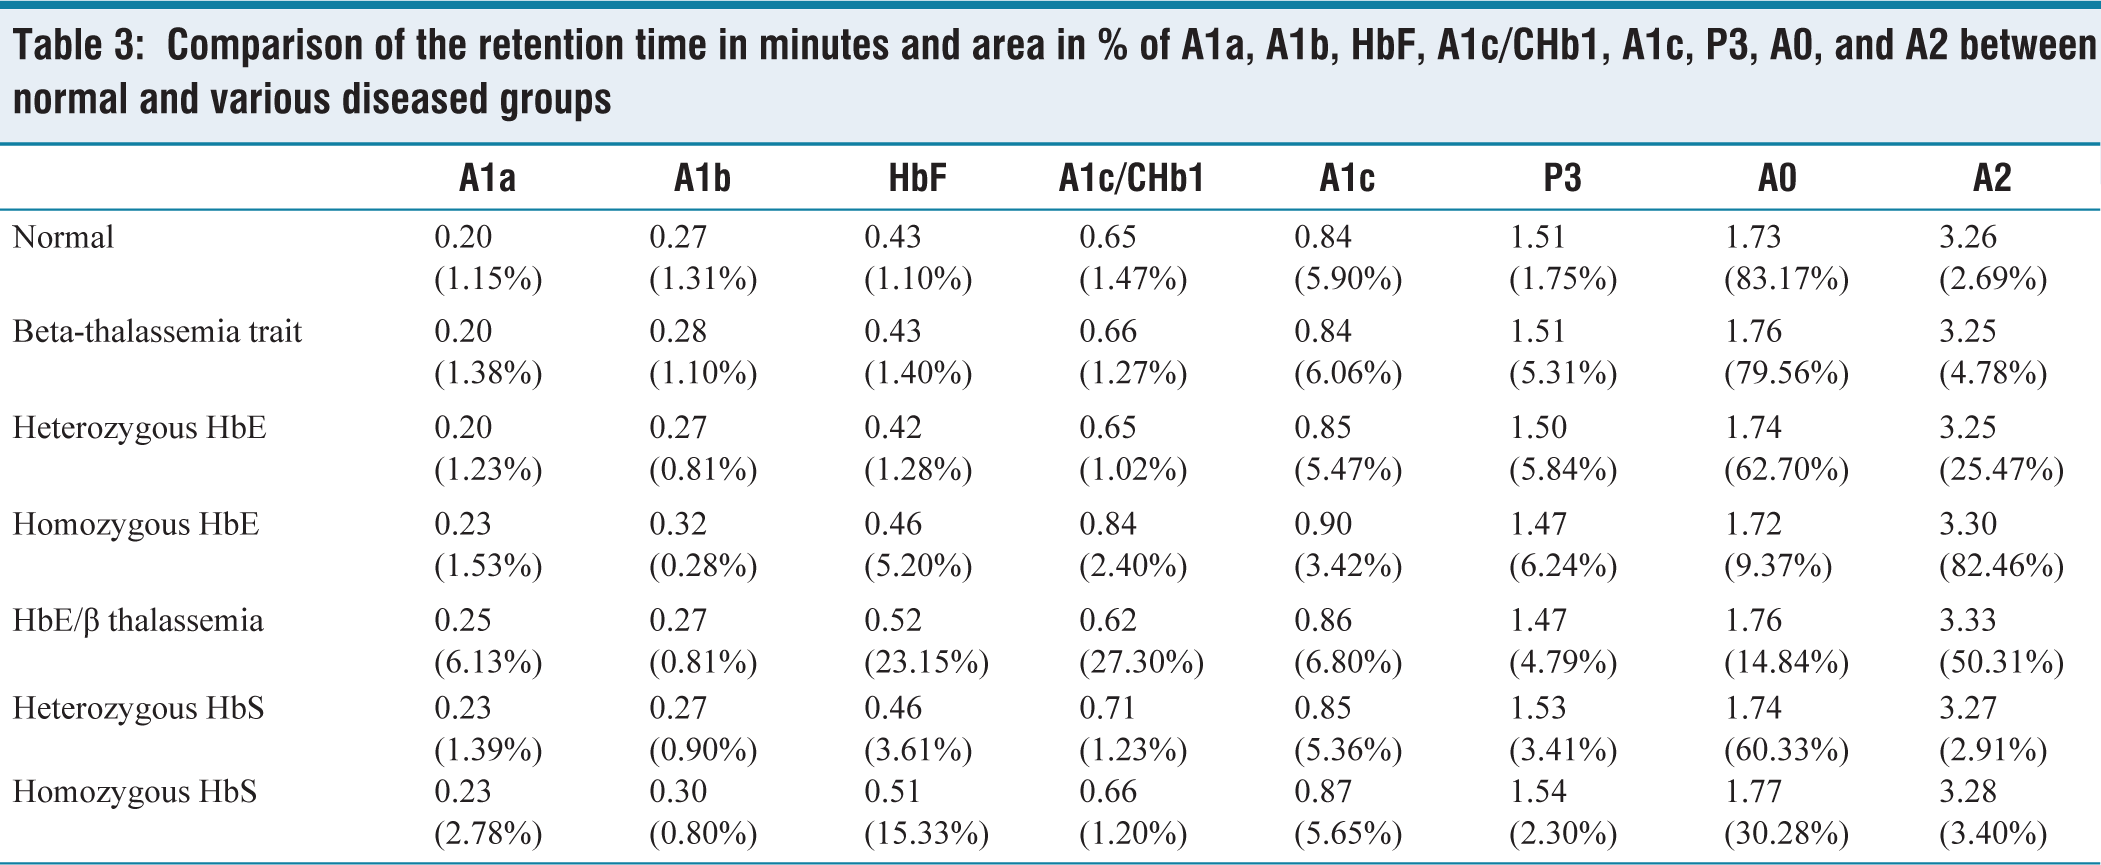
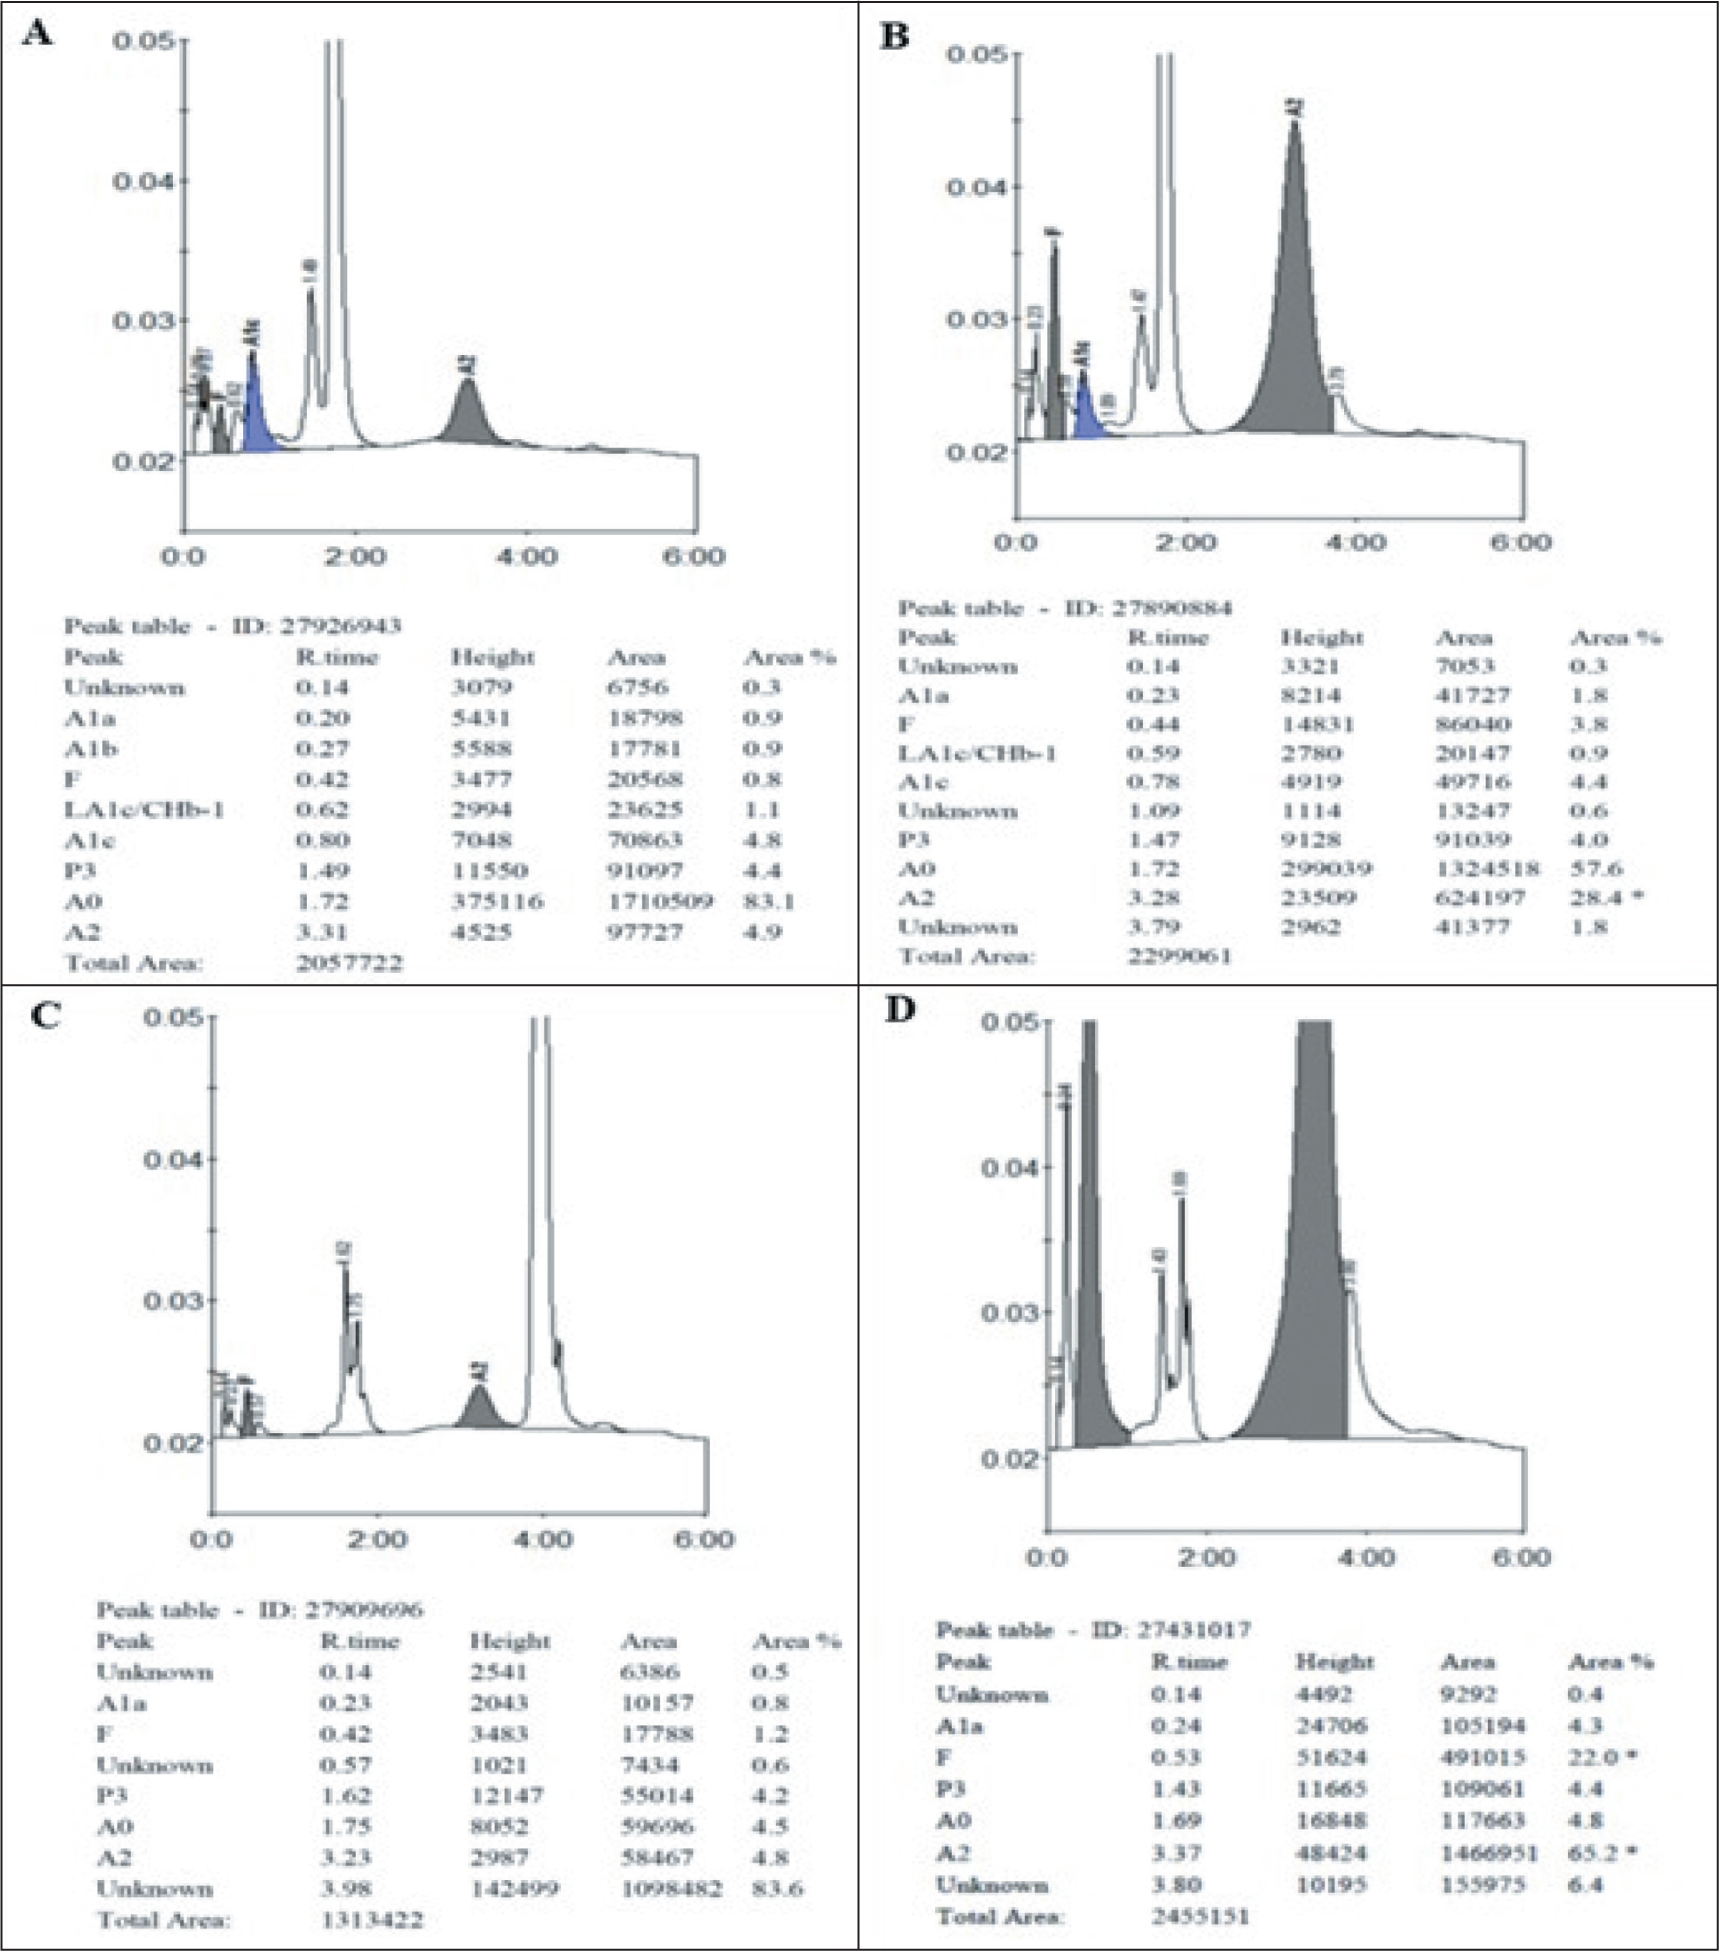
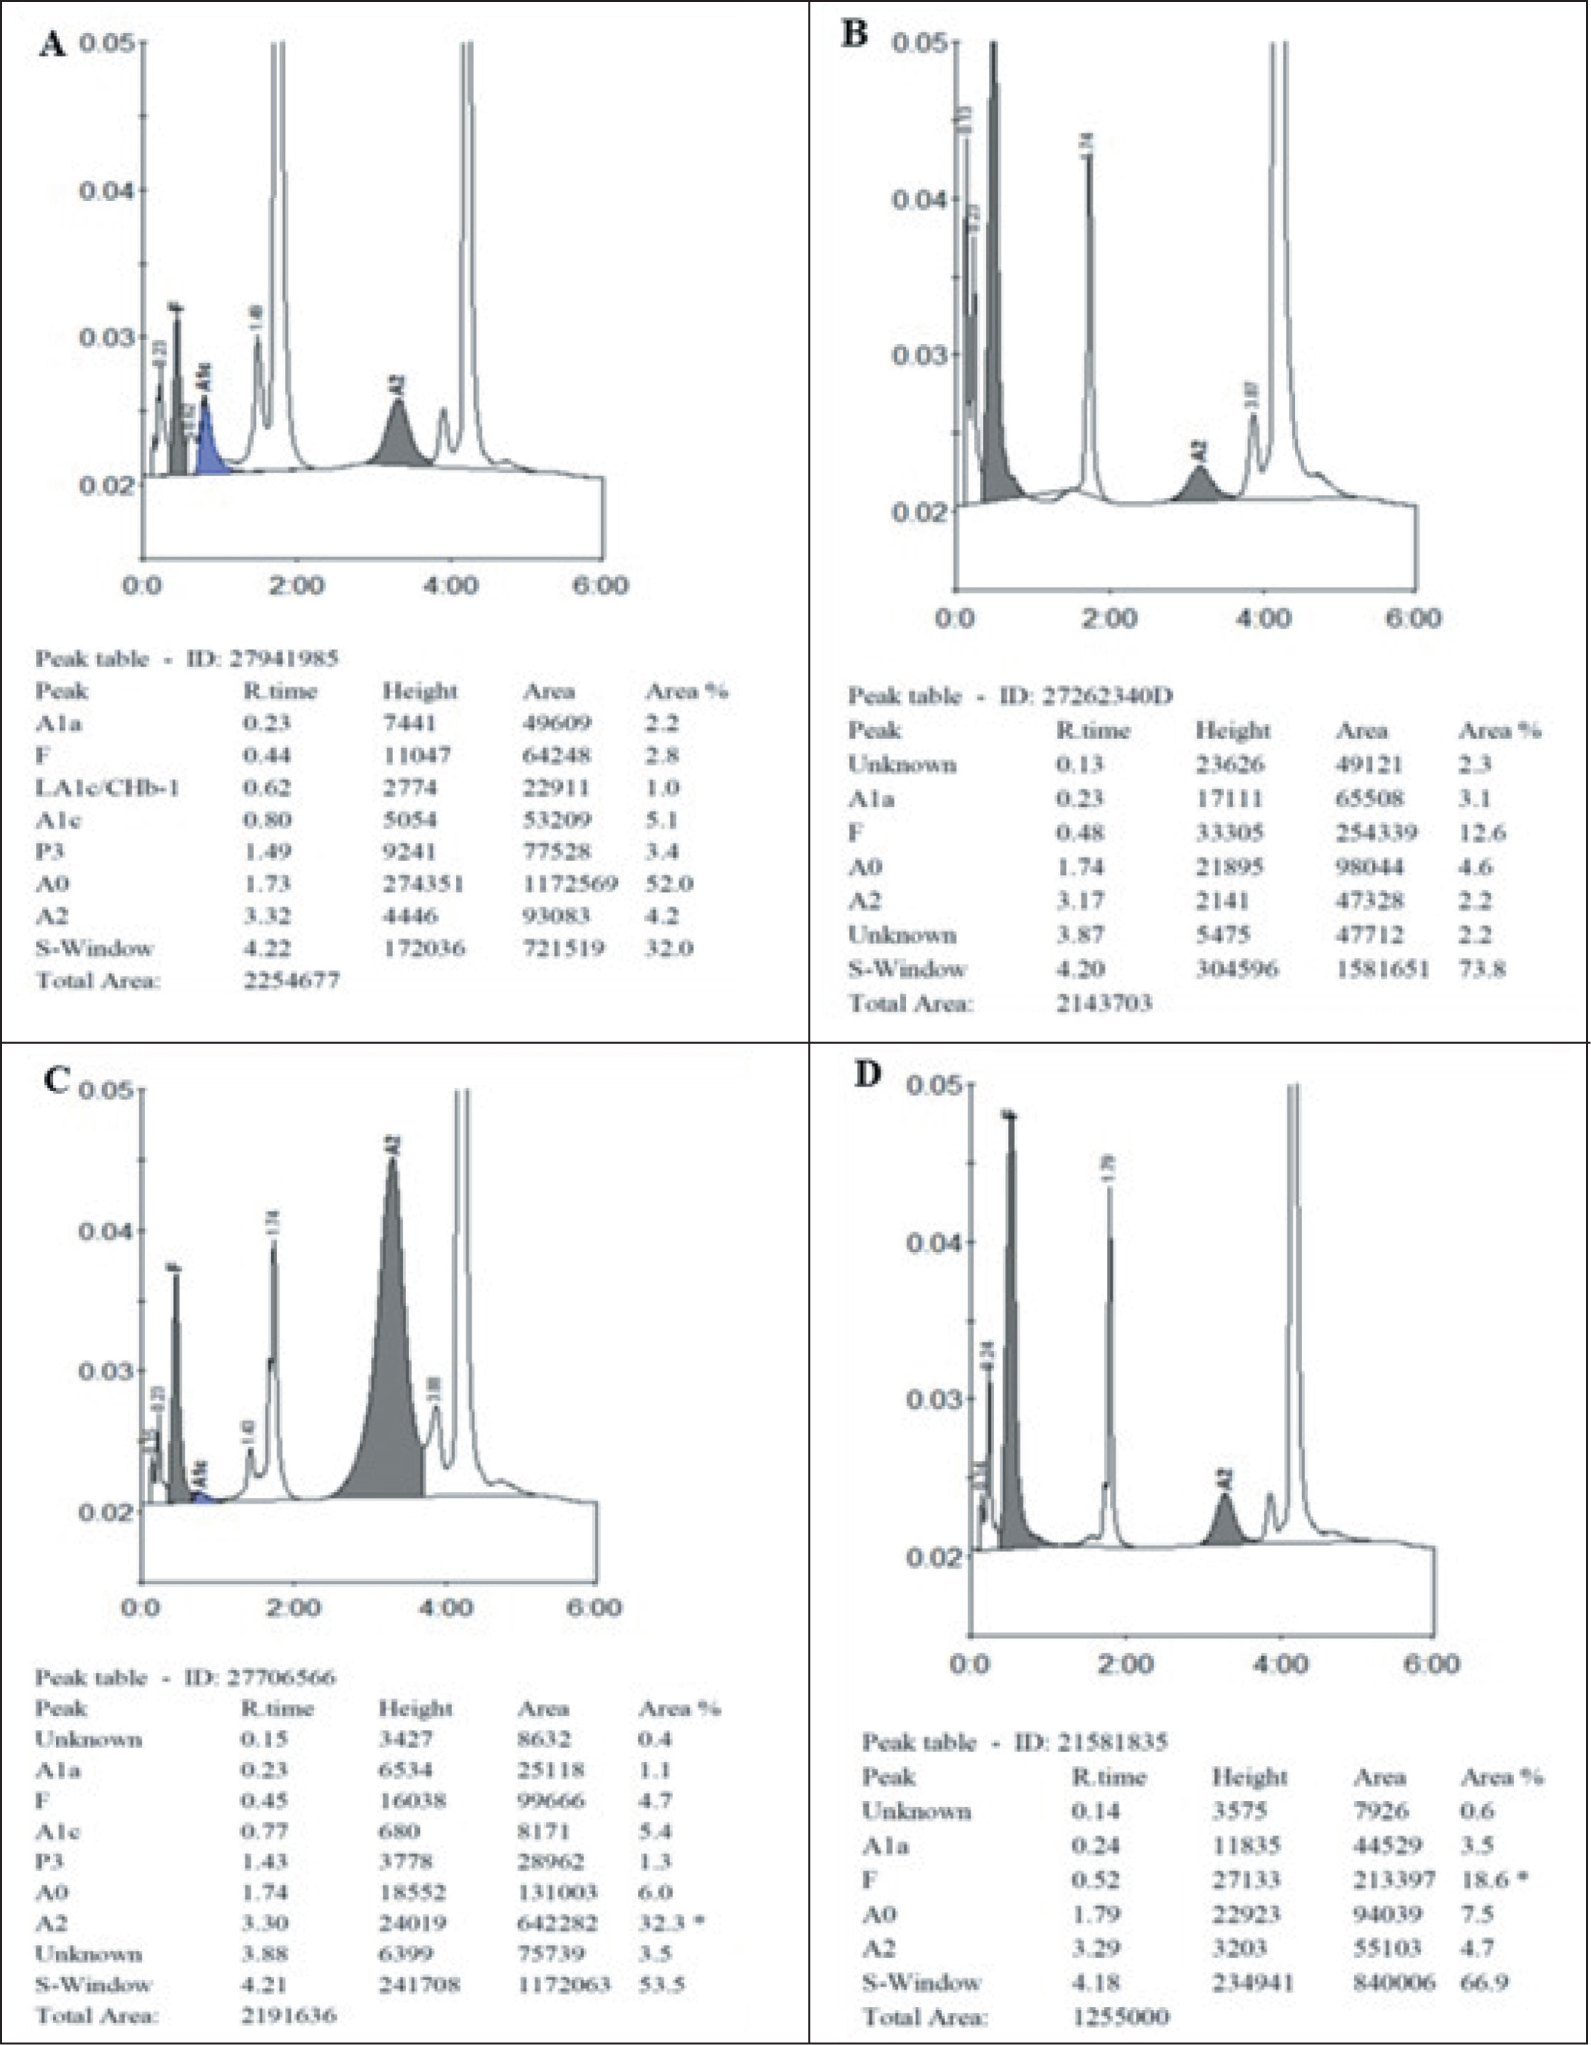
The area occupied by the A0 peak was found to be reduced to a variable extent in all the haemoglobin disorders (beta-thalassemia trait: 79.56%, heterozygous HbE: 62.70%, homozygous HbE: 9.37%, HbE/β thalassemia: 14.84%, heterozygous HbS: 60.33% and homozygous HbS: 30.28%). The area occupied by the A2 peak was found to be slightly increased in beta-thalassemia (4.78%), very much increased in heterozygous HbE (25.47%) and homozygous HbE (82.46%), and normal in the sickle cell disease. It was much higher in the homozygous cases than in the heterozygous cases. The area occupied by HbF is highly increased in homozygous HbE (5.20%), HbE/β thalassemia (23.15%) and homozygous HbS (15.33%), and is moderately increased in heterozygous HbE (1.28%) and HbS (3.61%). The normal retention time (in minutes) was found to be 0.20 for A1a, 0.27 for A1b, 0.43 for HbF, 0.65 for A1c/CHb1, 0.84 for A1c, 1.51 for P3, 1.73 for HbA0, and 3.26 for HbA2. The area (%) occupied by them normally is 1.10–1.20, 1.27–1.35, 1.0–1.20, 1.32–1.61, 5.80–6.00, 1.74–1.76, 82.7–83.6, and 2.65–2.73, respectively. Comparison of the retention time (minutes) and area of A1a, A1b, HbF, A1c/CHb1, A1c, P3, A0, and A2 between normal and various diseased groups is given in Table 3.
Comparison of the retention time in minutes and area in % of A1a, A1b, HbF, A1c/CHb1, A1c, P3, A0, and A2 between normal and various diseased groups
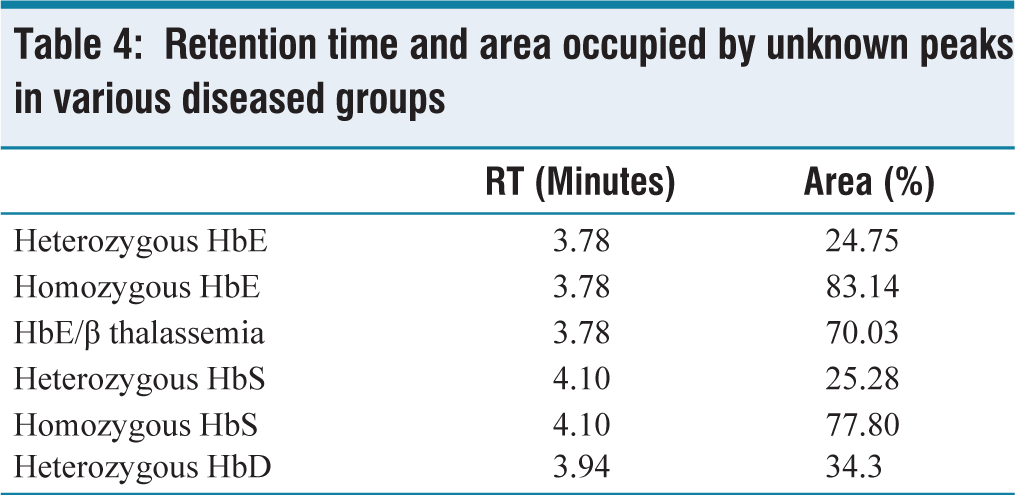
Few peaks appear outside the normal peaks with their retention time at 3.78 minutes (E-window), 4.10 minutes (S-window), and 3.94 minutes (D-window). Retention time and area occupied by unknown peaks in various diseased groups are given in Table 4. HbE (E-window) tends to coelute with HbA2, occupying an area of 20.2%–51.1% in heterozygous HbE and 72.7%–93.2% in homozygous HbE, HbS (S-window) occupies an area of 21.6%–27.4% in heterozygous HbS and 75%–79.80% in homozygous HbS. HbD (D-window) occupies an area of 34.3% in heterozygous HbD. The HPLC chromatogram images of various Hemoglobin variants are given in the Figure 1 and Figure 2.
Retention time and area occupied by unknown peaks in various diseased groups
Sickling test:
Out of 12 cases (heterozygous HbS, homozygous HbS, and HbSE), 10 showed a positive result.
Colour Plate-HPLC Chromatogram
Chromatogram of beta-thalassemia trait (A), heterozygous HbE (B), homozygous HbE (C) and compound heterozygous HbE and beta-thalassemia (D)
Chromatogram of heterozygous HbS (A), homozygous HbS (B), compound heterozygous HbS and HbE (C), and compound heterozygous HbS and beta-thalassemia (D)
Discussion
In our study, we analysed the baseline clinical profile, blood parameters, and chromatogram patterns. We found heterozygous HbE (35.53%) to be the most common, followed by beta-thalassemia trait (31.47%), homozygous HbE (19.80%), compound heterozygous HbE-beta-thalassemia (3.55%), heterozygous HbS (3.55%), homozygous HbS (2.03%), HbSE (1.02%), HbS-beta-thalassemia disease (1.02%), and HbD (0.51%). Balgir et al. showed heterozygous HbE to be the most common disorder in the North-eastern regions of India (10.9%).[8] Our findings were concordant with Balgir et al. On the other hand, Buch et al. reported beta-thalassemia trait (3.7%) to be the most frequent, followed by double heterozygous sickle cell with beta-thalassemia, sickle cell trait, and sickle cell disease.[9]
In the present study, we observed a greater prevalence of Abnormal HbS in females (54.3%). This finding of female preponderance was similar to the studies done by Purohit et al. (50.8%), Ashtiani et al., Rao et al., and Balgir et al.[7,8,10,11]
In a study done by Chandrasekar et al., the beta-thalassemia trait (35%), heterozygous HbE (19.5%), homozygous HbE (16.5%), heterozygous HbS (4.6%), HbE/β-thalassemia (2.7%), and HbS/β-thalassemia (1.8%) were more common among individuals more than 12 years old, whereas β-thalassemia major (2.3%) was more commonly seen in the less than 12 years age group.[4] These findings were in concordance with our study.
Abnormal Hb generally presents with anaemia. In our study lowest RBC count was associated with HbE/β thalassemia (3.30 × 10¹²/L), which is in concordance with the studies done by Chandrasekar et al. (3.6 × 10¹²/L) and Rao et al. (3.2 × 10¹²/L). Here, the lowest haemoglobin was also noted in HbE/β thalassemia (70.4 g/L), which is similar to that seen in Chandrasekar et al. (69 g/L) and Rao et al. (62 g/L) studies. MCV was found to be decreased in beta-thalassemia trait (64.07 fL), followed by homozygous HbE (64.61 fL), whereas it was the lowest in homozygous HbE in the studies of Chandrasekar et al. (63.6 fL), Balgir et al. (65 fL), and Rao et al. (63 fL). MCHC was found to be the lowest in HbE/ β thalassemia (307.9 g/L), which is in concordance with the study done by Chandrasekar et al. (292 g/L).[4,7,8]
In our study, the area occupied by A0 was lowest in homozygous HbE (9.37%), which was in concordance with the study done by Rao et al. (3.7%). The area of HbA2 was highest in homozygous HbE (82.46%), which was similar to the studies done by Chandrasekar et al. (90.8%) and Balgir et al. (98.2%). Area occupied by HbF was found to be highest in HbE/β thalassemia (23.15%), which was similar to the studies by Chandrasekar et al. (31.3%) and Rao et al. (21.7%).[4,7,8]
The area occupied by the unknown peaks (S, D, and E-window) in our study were 2.25% at 3.78 minutes in heterozygous HbE, 5.35% at 3.78 minutes in homozygous HbE, 2.95% at 3.78 minutes in HbE/β thalassemia, 4.10% at 4.10 minutes in HbS trait, 77.80% at 4.10 minutes in homozygous HbS and 34.3% at 3.94 minutes in heterozygous HbD which showed considerable difference from those values observed in other studies done by Chandrasekar et al., Rao et al., Sachdev et al. and Joutovsky et al.[4,6,7,12]
Conclusion
HPLC is more advantageous and superior to other studies for screening and detection of various haemoglobin disorders, as it provides rapid and accurate results. Both HbF and HbA2 can be detected and measured in a single run. It can detect even minor quantities of various haemoglobins, thus helping in the diagnosis of heterozygous states and uncommon haemoglobin disorders. In the antenatal screening, genetically inherited haemoglobin disorders can be diagnosed, for which proper management can be done sooner.
Limitations
It was a single-centre, cross-sectional design done only on patients suspected of abnormal Hb, and the exact incidence of the Abnormal Hb in the population could not be ascertained.
Quantification of HbA2 is not possible when the patient has abnormal haemoglobin, like HbD, HbG, and HbE, as they coelute with HbA2.
For samples containing >16.5% HbF, HbF may elute in LA1c/CHb or A1c window and no HbF is reported.
Elevated levels of HbA2 may be masked in the presence of concomitant Iron deficiency anaemia and megaloblastic anaemia.
HbA2 is falsely increased by HbS adducts.
There are many acquired causes of HbA2.
Interpretation of chromatogram is not advised in the absence of clinical history.
Confirmation of the diagnosis of abnormal haemoglobin with the molecular and parental study was not done in a few patients.
Findings need to be corroborated with the larger, multi-centric study.
Recommendations
CE-HPLC is an excellent tool for the detection of abnormal haemoglobin, given its ease of use and the fast results. But the results should be reported in correlation with ethnic origin, CBC, HbH preparation, peripheral smear findings, sickle cell preparation, parental studies, molecular studies, and details like thyroid status, B12/folate levels, and retroviral therapy.
Footnotes
Declaration of conflicting interests
The authors declared no potential conflicts of interest with respect to the research, authorship and/or publication of this article.
Funding
The authors received no financial support for the research, authorship and/or publication of this article.
Institutional ethical committee approval number
Ethical approval for this study was obtained from the Institutional Ethics Committee—Clinical Studies, Apollo Hospitals. Both authors are certified researchers by the Institutional Ethics Committee—Clinical Studies, Apollo Hospitals.
Informed consent statement
All authors and institutions have confirmed this manuscript for publication. Since the study did not involve any patient interaction or intervention, the Institutional Ethics Committee approved a waiver of informed consent.
Credit author statement
Aarthiprabha K Ravichandaran: Conceptualisation, Methodology, Data curation, Writing- original draft, Project administration.
Mamta Soni: Conceptualisation, Methodology, Supervision, Writing- review and editing, Project administration.
Data sharing statement
All the data are available if needed.
Use of artificial intelligence
The authors declare that no artificial intelligence tools were used in the preparation of this manuscript.
Disclaimer
The authors declare no disclaimer.