
Abstract
Background:
Stroke code pathways expedite reperfusion therapy, but 20%–40% of activations are later identified as stroke mimics. While clinically necessary, these pseudo-activations incur significant costs and resource use, particularly in out-of-pocket payment models.
Aim:
To analyse cost, efficiency, and resource utilisation of stroke code activations at a tertiary hospital in South India, focusing on pseudo-activations.
Methods:
Retrospective audit of 44 consecutive stroke code activations (January-June 2025). Data sources included emergency logs, imaging timestamps, treatment records and discharge summaries. Stroke mimics were evaluated for timelines and hospital costs using 2025 institutional tariffs. Activation efficiency was assessed using the Number needed to activate (NNA) and therapeutic yield by number needed to treat (NNT) from published trials.
Results:
Of 44 activations, 25 (56.8%) were true strokes, 13 (29.5%) were mimics, five were transient ischaemic attacks (TIAs), and one had atrial fibrillation without stroke. Eleven patients were thrombolysis-eligible; five received therapy (mean door-to-needle 113 min). NNAs came to around two activations per true stroke, around four per thrombolysis-eligible patient and around nine per treated patient. Direct per-activation costs were ₹47,000–₹69,000 ($538–$790). Typical mimic workups (imaging, labs, short-stay bed) accounted for ₹3.96–₹7.32 lakh ($4,536–$8,385; 26%–40% of total ₹14.1–₹17.5 lakh/$16,151–$20,046). Each activation diverted 4–6 hours of staff/scanner resources. Based on trial NNTs, five treated patients may have yielded around one additional independent outcome.
Conclusion:
Nearly one-third of stroke code activations were mimics, generating substantial cost and operational burden. Structured triage, staff education and tiered activation protocols may improve efficiency without compromising safety.
Keywords
Introduction
Strokes remain a leading cause of death and disability worldwide, with a rising global burden across low- and middle-income countries.[1] In India, the burden of strokes continues to increase, driven by a high prevalence of vascular risk factors and limited access to acute care.[2] Intravenous thrombolysis and thrombectomy have been shown to significantly improve functional outcomes when delivered promptly.[3–5]
To minimise in-hospital delays, stroke code activations are recommended by major international guidelines, including those from the American Heart Association/American Stroke Association and the UK’s National Institute for Health and Care Excellence (NICE).[6,7]
However, such high-sensitivity protocols inevitably capture a large proportion of stroke mimics—reported to range between 20% and 40% in international series.[8,9] Similar trends have been observed in Indian centres, where operational delays and resource constraints contribute to mimic rates approaching 25%–30%.[10,11]
Stroke mimics, though clinically unavoidable, generate significant costs from unnecessary imaging, laboratory tests, and emergency staff mobilisation. In India’s predominantly out-of-pocket payment system, these pseudo-activations impose a measurable financial and operational burden on both patients and institutions.[12,13] Beyond the cost, each activation diverts staff and scanners, potentially delaying other time-critical emergencies.
This audit evaluates the efficiency and financial implications of stroke code activations in a tertiary private hospital in South India, focusing on the Number needed to activate (NNA), number needed to treat (NNT), and the overall cost burden of stroke mimics.
Methods
Setting and Cohort
This was a retrospective audit of all patients with stroke code activation at Apollo Hospitals, Hyderabad, from January to June 2025. Data were obtained from emergency logs documenting activation time and presentation details, radiology timestamps for CT and MRI initiation (because MRI was available around the clock at our centre, most activations proceeded directly to MRI without a preceding CT),[13] treatment records including thrombolysis eligibility and delivery, and discharge summaries for the final diagnosis. All consecutive stroke code activations were included, while incomplete records and Leaving Against Medical Advice (LAMA) cases were excluded.
A case was considered a true stroke when the clinical features were consistent with an acute vascular event and the imaging (CT or MRI) supported this diagnosis. MRI was obtained when CT findings were inconclusive or when patients proceeded directly to MRI based on clinical suspicion and scanner availability. Haemorrhagic strokes were confirmed on CT, and an additional MRI was not routinely required.[13,14]
Audit Parameters
Audit parameters included diagnostic yield [true strokes, mimics, transient ischaemic attacks (TIAs) and other categories], efficiency metrics such as the NNA and literature-based NNT, adapted from Meretoja et al.[15] Timelines assessed included door-to-imaging and door-to-needle (DTN). Cost analysis utilised institutional tariffs (2025) for imaging, laboratory investigations and bed charges, with indirect costs captured qualitatively as staff and scanner utilisation time.
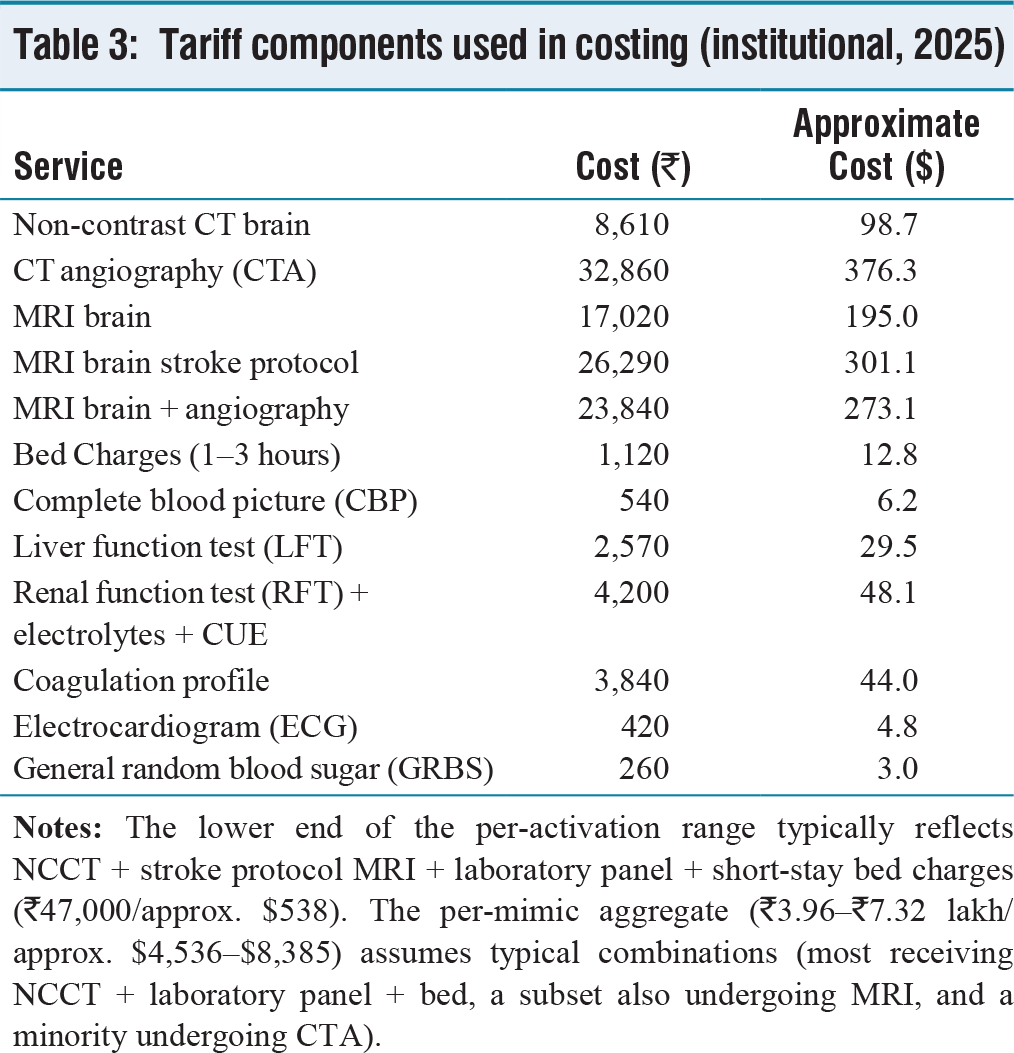
The costing scope reflected a typical mimic workup at our centre, which involved a Non-Contrast Computed Tomography (NCCT) of the brain (with or without MRI), a laboratory panel consisting of complete blood picture, liver function tests, renal function tests with electrolytes and Complete Urine Examination (CUE), coagulation profile and point-of-care tests, along with short-stay bed charges. Combinations of these components accounted for the per-case cost ranges reported.[12]
Results
Cohort Characteristics
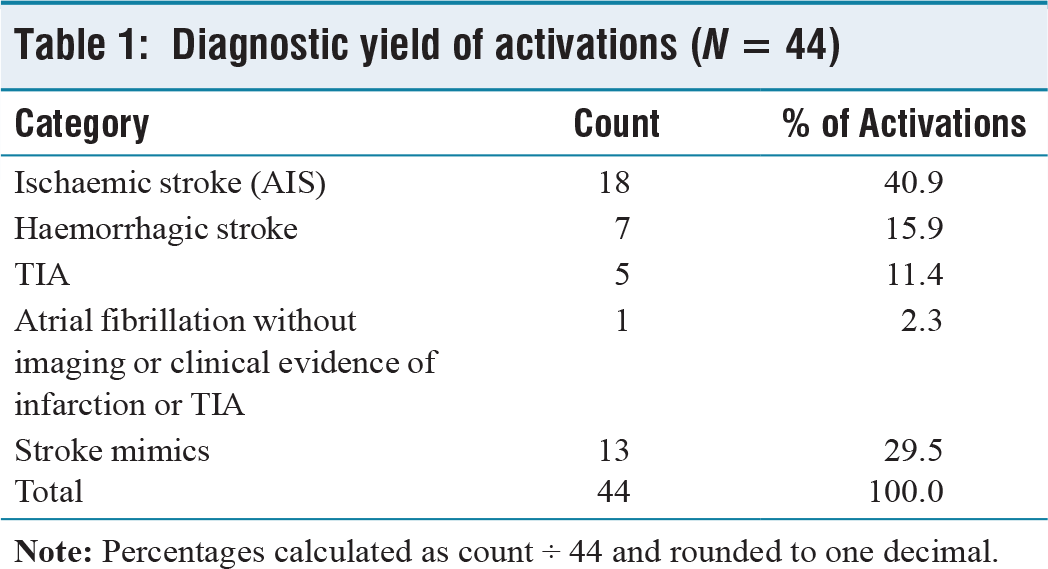
A total of 44 stroke code activations were included in the audit. Among these, 25 patients (56.8%) had true strokes, of which 18 were ischaemic, and seven were haemorrhagic. Stroke mimics accounted for 13 cases (29.5%), and five patients (11.4%) were diagnosed with TIAs. One patient (2.3%) presented with atrial fibrillation without imaging or clinical evidence of infarction or TIA; this case was kept as a separate category, as the activation was triggered by new-onset atrial fibrillation with brief transient weakness that had resolved before imaging. The diagnostic yield of stroke code activations is summarised in Table 1.
Diagnostic yield of activations (N = 44)
Efficiency Metrics and Resource Use
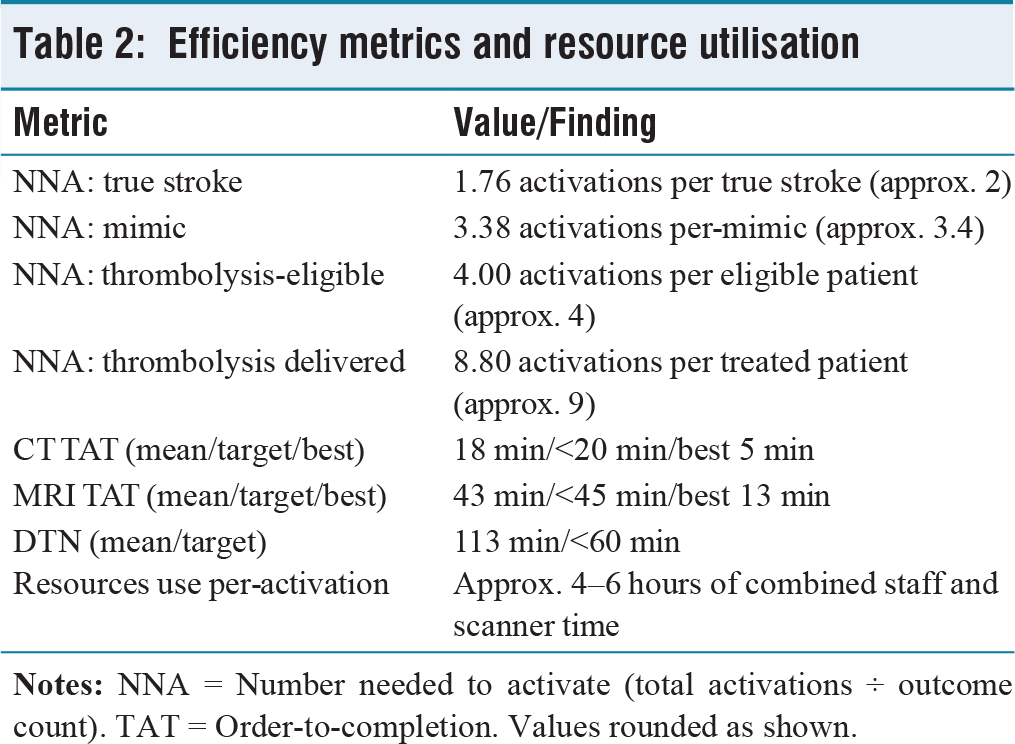
The NNA indicated that identifying one true stroke required approximately two activations (44 ÷ 25 = 1.76), while one mimic occurred for every 3.4 activations (44 ÷ 13 = 3.38). One thrombolysis-eligible patient was found for every four activations (44 ÷ 11 = 4.00), and one patient received thrombolysis for every nine activations (44 ÷ 5 = 8.80).
All 44 activations underwent imaging as part of the stroke code protocol. Five patients underwent both CT and MRI, seven underwent CT alone (all haemorrhagic strokes confirmed on CT), and 32 were evaluated directly with MRI as the first modality.[13]
Mean CT turnaround time (order-to-completion) was 18 minutes (target: <20; best: 5 minutes), while MRI turnaround time averaged 43 minutes (target: <45; best: 13 minutes). Eleven patients were eligible for thrombolysis, and five received treatment. Of the remaining six eligible patients, two had delayed consent, two experienced rapid improvement in symptoms, one had uncontrolled blood pressure and one had an uncertain onset time. The mean DTN time was 113 minutes (target: <60). Delays were attributed to MRI technician availability, consent issues, patient instability, and intra-hospital transfer times. Efficiency metrics and resource utilisation are shown in Table 2.
Efficiency metrics and resource utilisation
Literature-based NNT estimates were used for outcome interpretation, with alteplase demonstrating an NNT of about 8 for treatment within 3 hours and around 14–18 for the 3–4.5-hour window,[3] and tenecteplase demonstrating an NNT of around 6–8.[4,5] Based on these values, treatment of five patients in this cohort likely resulted in approximately one additional independent outcome.[15]
Cost Burden
The direct cost per-activation ranged from ₹47,000 to ₹69,000 (approx. $538–$790), depending on the protocol components used. The total expenditure over the six-month period was ₹14.1–₹17.5 lakh (approx. $16,151–$20,046), of which pseudo-activations accounted for ₹3.96–₹7.32 lakh (approx. $4,536–$8,385), representing 26%–40% of the total. Indirect costs included approximately 4–6 hours of combined staff and scanner utilisation per-activation.[12] The institutional tariff components used for costing are detailed in Table 3.
Tariff components used in costing (institutional, 2025)
Discussion
This audit demonstrates that nearly one-third of stroke code activations were ultimately stroke mimics, a finding consistent with both Indian and international series.[8–11,16,17] While such liberal activation captures the vast majority of true strokes, it also generates significant inefficiencies that merit structured evaluation. The calculated NNA of approximately two for identifying a true stroke underscores the sensitivity of the current pathway, but the NNA of around nine for delivered thrombolysis highlights a mismatch between activation frequency and reperfusion yield. Prior studies similarly suggest that only a minority of activations culminate in reperfusion therapy.[9,15] From a therapeutic perspective, assuming trial-like efficacy, literature-based NNT estimates for alteplase (approx. 8–18) and tenecteplase (approx. 6–8)[3–5,15] indicate that the five thrombolysed patients in this cohort may have achieved roughly one additional independent outcome, reinforcing the value of maintaining a high sensitivity for activation despite a relatively low reperfusion yield.
Efficiency metrics alone, however, do not capture the financial pressures imposed by pseudo-activations. In this cohort, mimics accounted for ₹3.96–₹7.32 lakh (26%–40%) of pathway expenditure over six months, a burden that is particularly acute in India’s out-of-pocket financing system, where patient-level affordability intersects with institutional sustainability. Prior Indian audits have similarly highlighted the combined impact of direct cost and indirect opportunity loss.[12] Each mimic case required an estimated ₹47,000–₹69,000 in direct costs while consuming 4–6 hours of scanner and staff time—delays with potential implications for parallel emergencies such as trauma and acute coronary syndromes.[12,13] These operational opportunity costs remain underappreciated in stroke systems literature but have tangible implications in resource-constrained environments.
Several clinical and operational strategies may improve specificity without compromising safety. At the clinical level, recognition of red-flag features for mimics—gradual onset, fluctuating deficits, or pre-existing migraine, seizure or vestibular syndromes—should be emphasised.[8,16] Operational refinements include tiered activation models (e.g., an initial ‘stroke alert’ followed by full ‘stroke code’ mobilisation) to calibrate response intensity.[17] Incorporation of decision-support tools, including AI-assisted triage and validated clinical scores, may further enhance diagnostic precision. Finally, structured education for emergency department teams on mimic recognition has been shown to reduce unnecessary activations.[17,18]
Ultimately, the central challenge lies in balancing efficiency gains against the risk of under-triage. While the financial and opportunity costs of mimics are considerable, the potential harm of missing a reperfusion-eligible stroke remains greater. Our findings therefore support maintaining a deliberately low threshold for activation while implementing system-level refinements to minimise full mobilisation for clear mimics. In resource-limited settings, the optimal strategy may not be to reduce activations per se, but to embed cost-conscious and tiered responses that preserve safety without overwhelming systems.
Post-audit Actions
Several interventions were introduced following this audit. Pathway refinement included the implementation of a Stroke Mimic Checklist at triage and the addition of Tissue plasminogen activator (tPA) decision-support for borderline National Institutes of Health Stroke Scale (NIHSS) scores below five. Imaging efficiency was addressed by introducing an emergency department (ED) dashboard displaying CT and MRI turnaround times, placing signage to prioritise stroke imaging, and ensuring the availability of a dedicated MRI technician during night hours. Improvements in education and clinical culture involved regular teaching sessions on stroke mimics, integrating pathway training into ED and radiology induction programmes, and instituting structured ED-radiology handovers. Standardisation efforts also included the introduction of a mandatory stroke education plan at discharge. These changes were implemented to maintain imaging priority while reducing unnecessary activations.
Strengths, Limitations, and Future Directions
This audit has several strengths, including detailed real-world tariff data, explicit NNA efficiency metrics and transparent costing assumptions. It also reflects routine clinical practice within a tertiary private hospital setting. However, the study is limited by its single-centre design, six-month retrospective timeframe and modest sample size, which may reduce generalisability to public hospitals. All haemorrhagic strokes were confirmed on CT, making under-detection in that subgroup unlikely. Nonetheless, early ischaemic changes can occasionally be missed on CT, and a few subtle infarcts may have been overlooked in patients imaged before MRI confirmation.[13,14] Additionally, outcome efficacy was inferred from trial NNTs rather than cohort follow-up, which introduces inherent limitations.[3–5,15] Re- audit will determine the sustainability of the implemented pathway measures, and broader adoption across neighbouring centres will help assess generalisability, particularly of the mimic checklist and imaging dashboard.
Conclusion
Pseudo-stroke code activations represented approximately 30% of our cohort, and contributed substantially to pathway costs and resource use, with each activation requiring several hours of scanner and staff time.[12] Liberal activation policies remain necessary to prevent missed treatment opportunities. However, structured triage, stroke mimic awareness and tiered activation protocols may improve cost-effectiveness without compromising safety.[8,16,17]
This audit highlights critical delays and inefficiencies within the acute stroke pathway, particularly in imaging turnaround and overactivation due to stroke mimics. By streamlining stroke code activation, prioritising CT for suspected cases, and strengthening ED-radiology communication, we initiated system-level changes that directly address these gaps. Although conducted in a single centre, the findings demonstrate that even modest process adjustments can reduce unnecessary resource use, improve access to time-sensitive interventions and embed a culture of urgency in acute stroke care. These measures have the potential to inform wider institutional policy and serve as a model for similar settings, with a re-audit planned to evaluate sustained impact.[18]
Footnotes
Acknowledgements
We thank the emergency department and radiology staff at Apollo Hospitals, Hyderguda, Hyderabad, for their support during data collection.
Declaration of conflicting interests
The authors declared no potential conflicts of interest with respect to the research, authorship and/or publication of this article.
Funding
The authors received no financial support for the research, authorship and/or publication of this article.
Institutional ethical committee approval number
This was a retrospective audit of anonymised records conducted as part of departmental quality improvement. Formal ethics approval was not required.
Informed consent
Not applicable (retrospective audit, anonymised data).
Credit author statement
Dr Deepika Vennavelli: data collection, analysis, manuscript drafting.
Dr Deepika Sirineni: conceptualisation, clinical supervision, manuscript review, final approval.
Data availability
Data supporting the findings of this study are available from the corresponding author upon reasonable request.
Use of artificial intelligence
The authors used AI-based tools to assist in word count adjustment of the manuscript. No AI tool was used for data generation, statistical analysis or interpretation of results. Final content and conclusions were entirely author-driven.