
Abstract
Gender inequality in employment remains high in India with women’s work participation rate at 22% compared to 54% for males. Drawing upon evidence from Young Lives panel data, this article explores factors affecting labour force participation and gender inequity, especially with reference to regular salaried jobs amongst young adults at age 22. Logistic regression analysis reveals that young women are 59% less likely to be in regular salaried jobs compared to their male counterparts with Fairlie decomposition analysis revealing that marital status alone contributes more than 98% of the gender gap in regular salaried employment. Vocational education, job-related training, early reading skills at age 8, frequent use of computer and high GRIT scores are other positive significant factors associated with regular salaried jobs. This article concludes with policy recommendations for promoting young women’s well-being, as well as their income-generation opportunities and participation in the formal labour market.
Introduction
For the first time equality in labour force participation has been included at a global level in the Sustainable Development Goals. Target 8.5 of Goal 8 iterates that ‘By 2030, achieve full and productive employment and decent work for all women and men, including for young people and persons with disabilities, and equal pay for work of equal value’, while Goal 5 focuses on achieving gender equality and empower all women and girls (United Nations, 2020). Disadvantages in education translate into lack of access to skills and limited opportunities in the labour market. Women’s and girls’ empowerment is essential to expand economic growth and promote social development.
The Indian Context
Despite an increase in per capita income, India has the second highest income inequality in the world among large countries, second to only South Africa (Dev, 2018). Inequality in India is about education, health, nutrition, sanitation and opportunities as much as it is about rising income inequality (Himanshu, 2019). The country also has a high level of horizontal inequalities (Stewart, 2002) based on caste, class, religion, race and location, with women being particularly excluded from services and opportunities due to prevailing social norms, patriarchal structure and rigid labour market conditions (Raveendran, 2016; Verick, 2018). As per ILO estimates (2019), India was at the 171 position out of 180 countries in terms of women labour force participation.
As a result, gender inequality in employment remains high in India, and the work participation rate for women is only 22% compared to 54% for males, with a mere 15% of women’s work participation in urban areas (Ghose, 2016). Women in India take on more unpaid work (Oxfam India, 2019), such as the care of children and those who are ill or elderly and those who go out to work contend with obstacles such as lower pay, no childcare services and less job security due to participation largely in the informal sector.
The Indian labour market is also characterised by an important feature related to the nature of the employers and the type of jobs that are offered. Employers are categorised into two types: the organised sector and the unorganised sector. A large share of the workforce is employed in agriculture (nearly 50%) and the unorganised sector (93%) in 2011–2012 (Himanshu, 2019). This gets compounded by the fact that only 2.4% of the workforce of age 15–59 years has received vocational/technical training from formal sources and another 8.9% received training through informal sources (Department of Economic Affairs, 2021).
India has also been witness to the puzzling phenomenon of a declining female labour force participation rate at a time of high economic growth. Between 2004–2005 and 2011–2012, while the GDP grew at 8% per annum, the female labour force participation rate declined even further from an already low 35%. Though some attribute this to longer retention of girls in education (Vinoj, 2013) as well as rising household income (Kapsos et al., 2014) others have raised questions about this explanation (Chandrasekhar & Ghosh 2014; Sanghi et al., 2015).
Longitudinal analysis of labour outcomes in four Young Lives study countries (Peru, Ethiopia, Vietnam and India) shows that young population in India is characterised by the highest inactivity rate (29%), and the reason is mainly attributed to a high level of inactivity among young women at age 22. In 2016, only 57% of young women in India were either employed or unemployed looking for job (4%), whereas 43% were found to be inactive (Favara et al., 2018). In other words, the youth labour market in India is characterised by the low participation of women, high unemployment rates, particularly in urban areas, and high level of informality.
Objective/Research Question
The broad objective of this article is to explore the factors affecting labour force participation, types of activities they were involved in, especially engagement in regular salaried jobs among young adults at age 22 in two southern states of India, that is, Andhra Pradesh and Telangana 1 in India. Furthermore, this article aims to explore gender gaps in labour force participation at age 22, and the factors facilitating or inhabiting their employment in regular salaried jobs.
Data and Methods
Data
Young Lives is designed as a cohort study following the lives of 12,000 children in four low- and middle-income countries—Ethiopia, India (then unified Andhra Pradesh, now bifurcated into the states of Andhra Pradesh and Telangana), Peru and Vietnam—since the first round in 2002. The sample in each country consists of two age groups: a younger cohort of 2,000 children who were aged one when the first round of the survey was carried out, and an older cohort of 1,000 children then aged eight. These two cohorts of children aged one year old and eight years old in 2002 have been followed since 2002, and the survey has conducted five rounds of field survey, 2 collecting information related to index children, households and communities in 2002, 2005, 2009, 2013 and 2016 and focuses on many aspects of childhood poverty that includes education, time-use, and labour force participation etc. The five rounds of survey data, supplemented by four rounds of nested qualitative case studies, afford Young Lives a unique cross-country longitudinal dataset exploring causes and consequences of poverty in childhood (Young Lives, 2017).
For this article, we have drawn upon the Young Lives data from the two state/s of Telangana and Andhra Pradesh in India and utilised four rounds (1, 2, 4 and 5) of longitudinal survey data related to Young Lives ‘Older Cohort children’ born in 1994–1995. The rationale for choosing the Older Cohort for the paper is because the Older Cohort children turned 22 years in 2016 (Round 5) and most of them had entered into the labour force by this time. The initial sample size for Older Cohort children in Round 1 was 1,008, which reduced to 906 in Round 5 with an attrition rate of 10.1%. For this article, we only focus on the young adults who were not in full-time education at age 22 and would have had the option to transition to the labour market comprising both employed and unemployed 3 young adults (N = 656).
Dependent Variable
The main labour market indicators are computed using information from the Older Cohort child questionnaire, which comprises of three main sections: (i) labour market participation, (ii) list and characteristics of all economic activities the young people are involved in and (iii) information on the main activity (e.g. working arrangements and quality of work), defined as the activity the respondent had spent most time on, in the last 12 months. The labour market participation section is answered by all 22-year-old young men and women and refers to whether or not the young person has been involved in any paid and/or unpaid work activity for at least an hour over the last seven days as well as the last 12 months, and if not, whether they were searching for work. If the respondent reports that they have worked, they are asked about the characteristics of all economic activities and the main activity they have been involved in.
On the basis of the above information, we categorise labour market jobs into four categories: wage employment, self-employed, entrepreneur and regular salaried employment. 4 We choose ‘regular salaried employment’ as the primary dependent variable in the paper since amongst all the job categories, this was found to be most stable with higher monthly wages, compared to other job categories. This occupation category was also associated with the highest job satisfaction among young adults.
Since the authors were keen to explore the factors predicting the likelihood of being engaged in the regular salaried jobs, we created a binary dependent variable ‘whether in regular salaried jobs?’ resulting into ‘yes’ and ‘no’ responses. We found that 162 young adults (34.8%) out of 466 employed Older Cohort were found to be engaged in regular salaried jobs. Gender distribution of this category reveals that 41.6% were young men and 24.7% were young women, highlighting the gender inequality persisting within labour force participation in the Young Lives sample.
Independent Variable
To examine factors affecting engagement in regular salaried jobs at age 22, three types of independent variables (1) socio-demographic, (2) households and (3) individual characteristics were taken.
Socio-demographic variables: Research literature provides evidence of the influence of certain socio-demographic factors on better labour outcomes. Caste is a persistent determinant of power, economic inequality and poverty in contemporary India (Zacharias & Vakulabharanam, 2011). Outcomes for growth and human development are not only determined by the existing state of income distribution but are also determined by where an individual is born and to which caste (Himanshu, 2019). Gender-based labour segmentation builds on the culturally determined social reproduction responsibilities of female workers and other sociocultural factors (Srivastava, 2019). We have taken two socio-demographic variables in this category caste 5 and marital status 6 of the young adults. Data on caste and marital status are obtained from Round 1 and Round 5 respectively.
Household variables: India, which has a high level of horizontal inequalities based on location (Himanshu, 2019). To understand the role of certain household variables in determining the labour outcomes, we explore the effects of location, that is, rural and urban as well as the wealth index. Household baseline wealth index 7 is used as a proxy of household’s economic prosperity and obtained from Round 1 (2002).
Individual variables: We have considered seven variables under this category. They are (i) reading ability at the age of 8 as a measure of early literacy (Round 1), since research evidence shows that inequalities in early life may perpetuate intergenerational differences in income (Mitchell et al., 2020). (ii) Higher levels of education are associated with greater labour market success, enhancing the opportunities for individuals to enter the labour market in a better position and protect them from unemployment—therefore we consider the highest educational level completed by age 22. (iii) Mathematics score at age 19 (Round 4) since skills such as clarity in expressions, logical reasoning and inference are associated with mathematical scores (Joensen & Nielsen, 2006). (iv) Hours spent on domestic chores 8 at age 12 (Round 2) since earlier analysis revealed that children who spent more hours of time in domestic chores are less likely to complete secondary education (Singh & Mukherjee, 2017), and we explore the significance of the variable further in relation to labour outcomes. (v) Job-related training based on information on different skill-training reported by the 22-year-olds (Round 5). (vi) Use of computer at least once in a month (as reported in Round 5) since regular salaried job may demand proficiency in computer applications (Cueto et al., 2018). (vii) GRIT 9 scores at age 22 from Round 5, which is a combination of perseverance and passion (Duckworth et al., 2007) and is known to have a positive effect on transitions to the labour market (Blom & Saeki, 2011).
Analytical Methods
The first step of the analysis is to highlight the percentage of adults who are employed at age 22 vis-à-vis who are not working for pay at the same age by gender and various socio-demographic, households and individual variables and examine any significant gender gaps that emerge in each background variables.
Logit regression
In order to investigate the factors associated with the engagement in regular salaried jobs amongst 22-year-old adults, we utilise logit regression, 10 since the dependent variable is binary rather than being continuous. For ease of interpretation, the results from logit analysis are presented in the form of odds ratio.
Decomposition method
Since the logit model only establishes whether the difference in the dependent variable is significant after controlling for socio-economic characteristics, we employ Fairlie’s (2005) non-linear decomposition technique 11 which is particularly suited to calculating gaps for binary variables as an extension of Blinder–Oaxaca decomposition technique to logit and probit models. The procedure computes the difference in the probability of an outcome between two groups and quantifies the contribution of group differences (male/female) in the independent variables to the outcome differential (Costa-Font et al., 2008).
Fairlie’s (2005) decomposition method provides gender difference that is due to group differences in the distribution of characteristics of the independent variables, also known as ‘the explained part’ as well as the gender difference due to differences in coefficients to the exogenous covariates. Besides this, it also captures differences in immeasurable or unobserved endowments—commonly accepted as a measure of discrimination in literature (Costa-Font et al., 2008; Hussain, 2010; Pal, 2004).
Results
Employment status at age 22
Figure 1 shows the employment status of young adults at age 22. As mentioned earlier, the percentage is calculated after removing young adults who were studying at the time of the survey. Figure 1 shows that 71% of the adults were found to be employed full-time compared to 29% who were not working for pay, that is, neither working nor studying at the time of the survey.
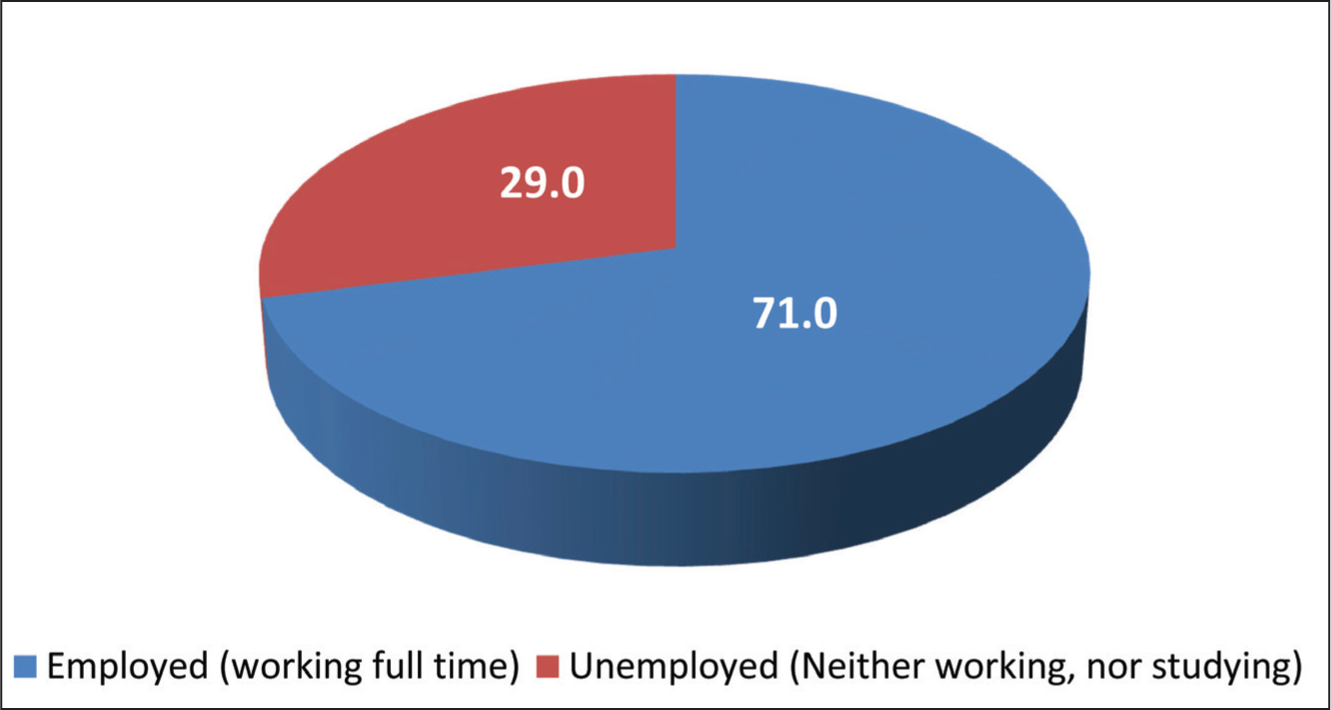
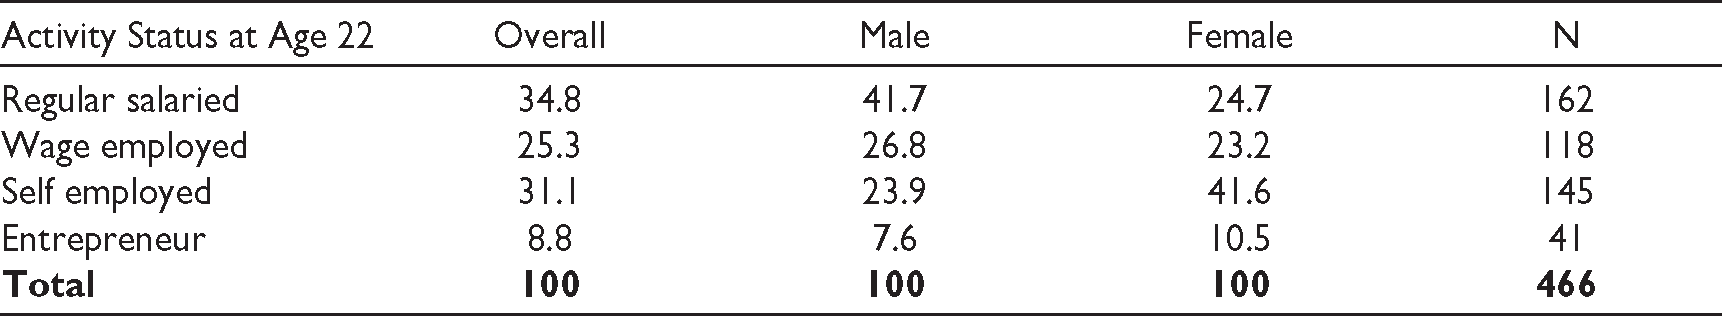
Table 1 provides further information on different types of activities 12 those employed were engaged in (also see Table A1 in the Appendix). Results show that 34.8% of the young adults were engaged in regular salaried jobs, whereas 25.3%, 31.1% and 8.8% of the adults were engaged in wage employment, self-employment and entrepreneurial activities respectively.
Activity Status at Age 22.
Who Are Not Working for Pay?
We also explore the characteristics of young adults who were not working for pay at age 22. Findings show that young women constitute the largest proportion of this category, that is, 84%. Further analysis by marital status reveals that 73% of these young women were married and 78% were found to be engaged in domestic chores for more than three hours daily (see Table A2 in the Appendix). The share of those not working for pay is found least amongst those who had pursued vocational education.
Occupational Status at Age 22
Table 2 gives the characteristics of the four main categories of occupation that young adults are engaged in at age 22.
Definition of Occupational Categories.
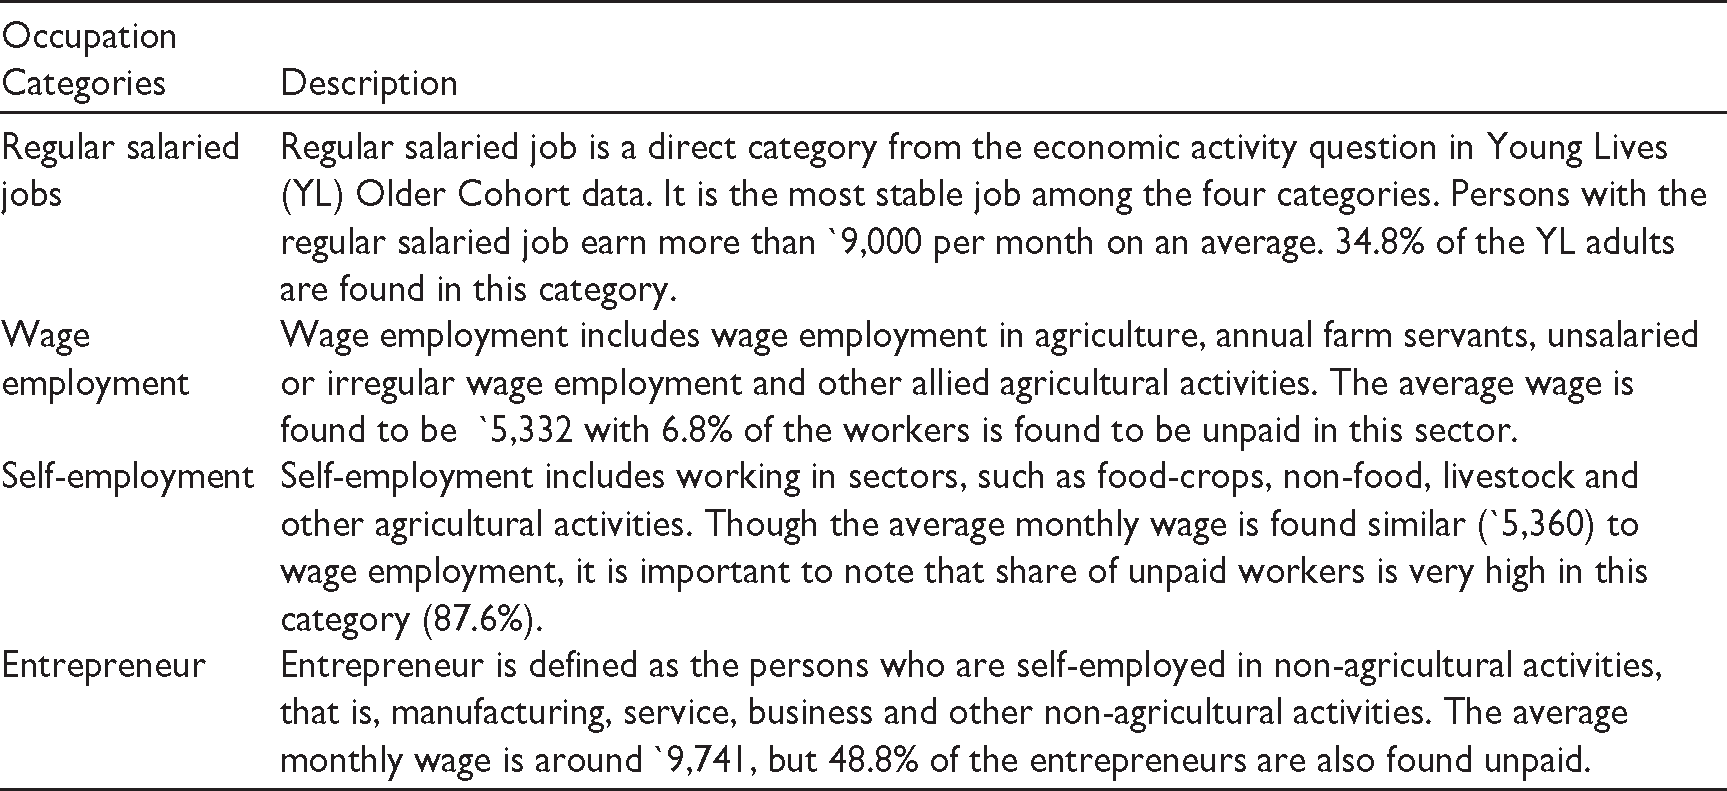
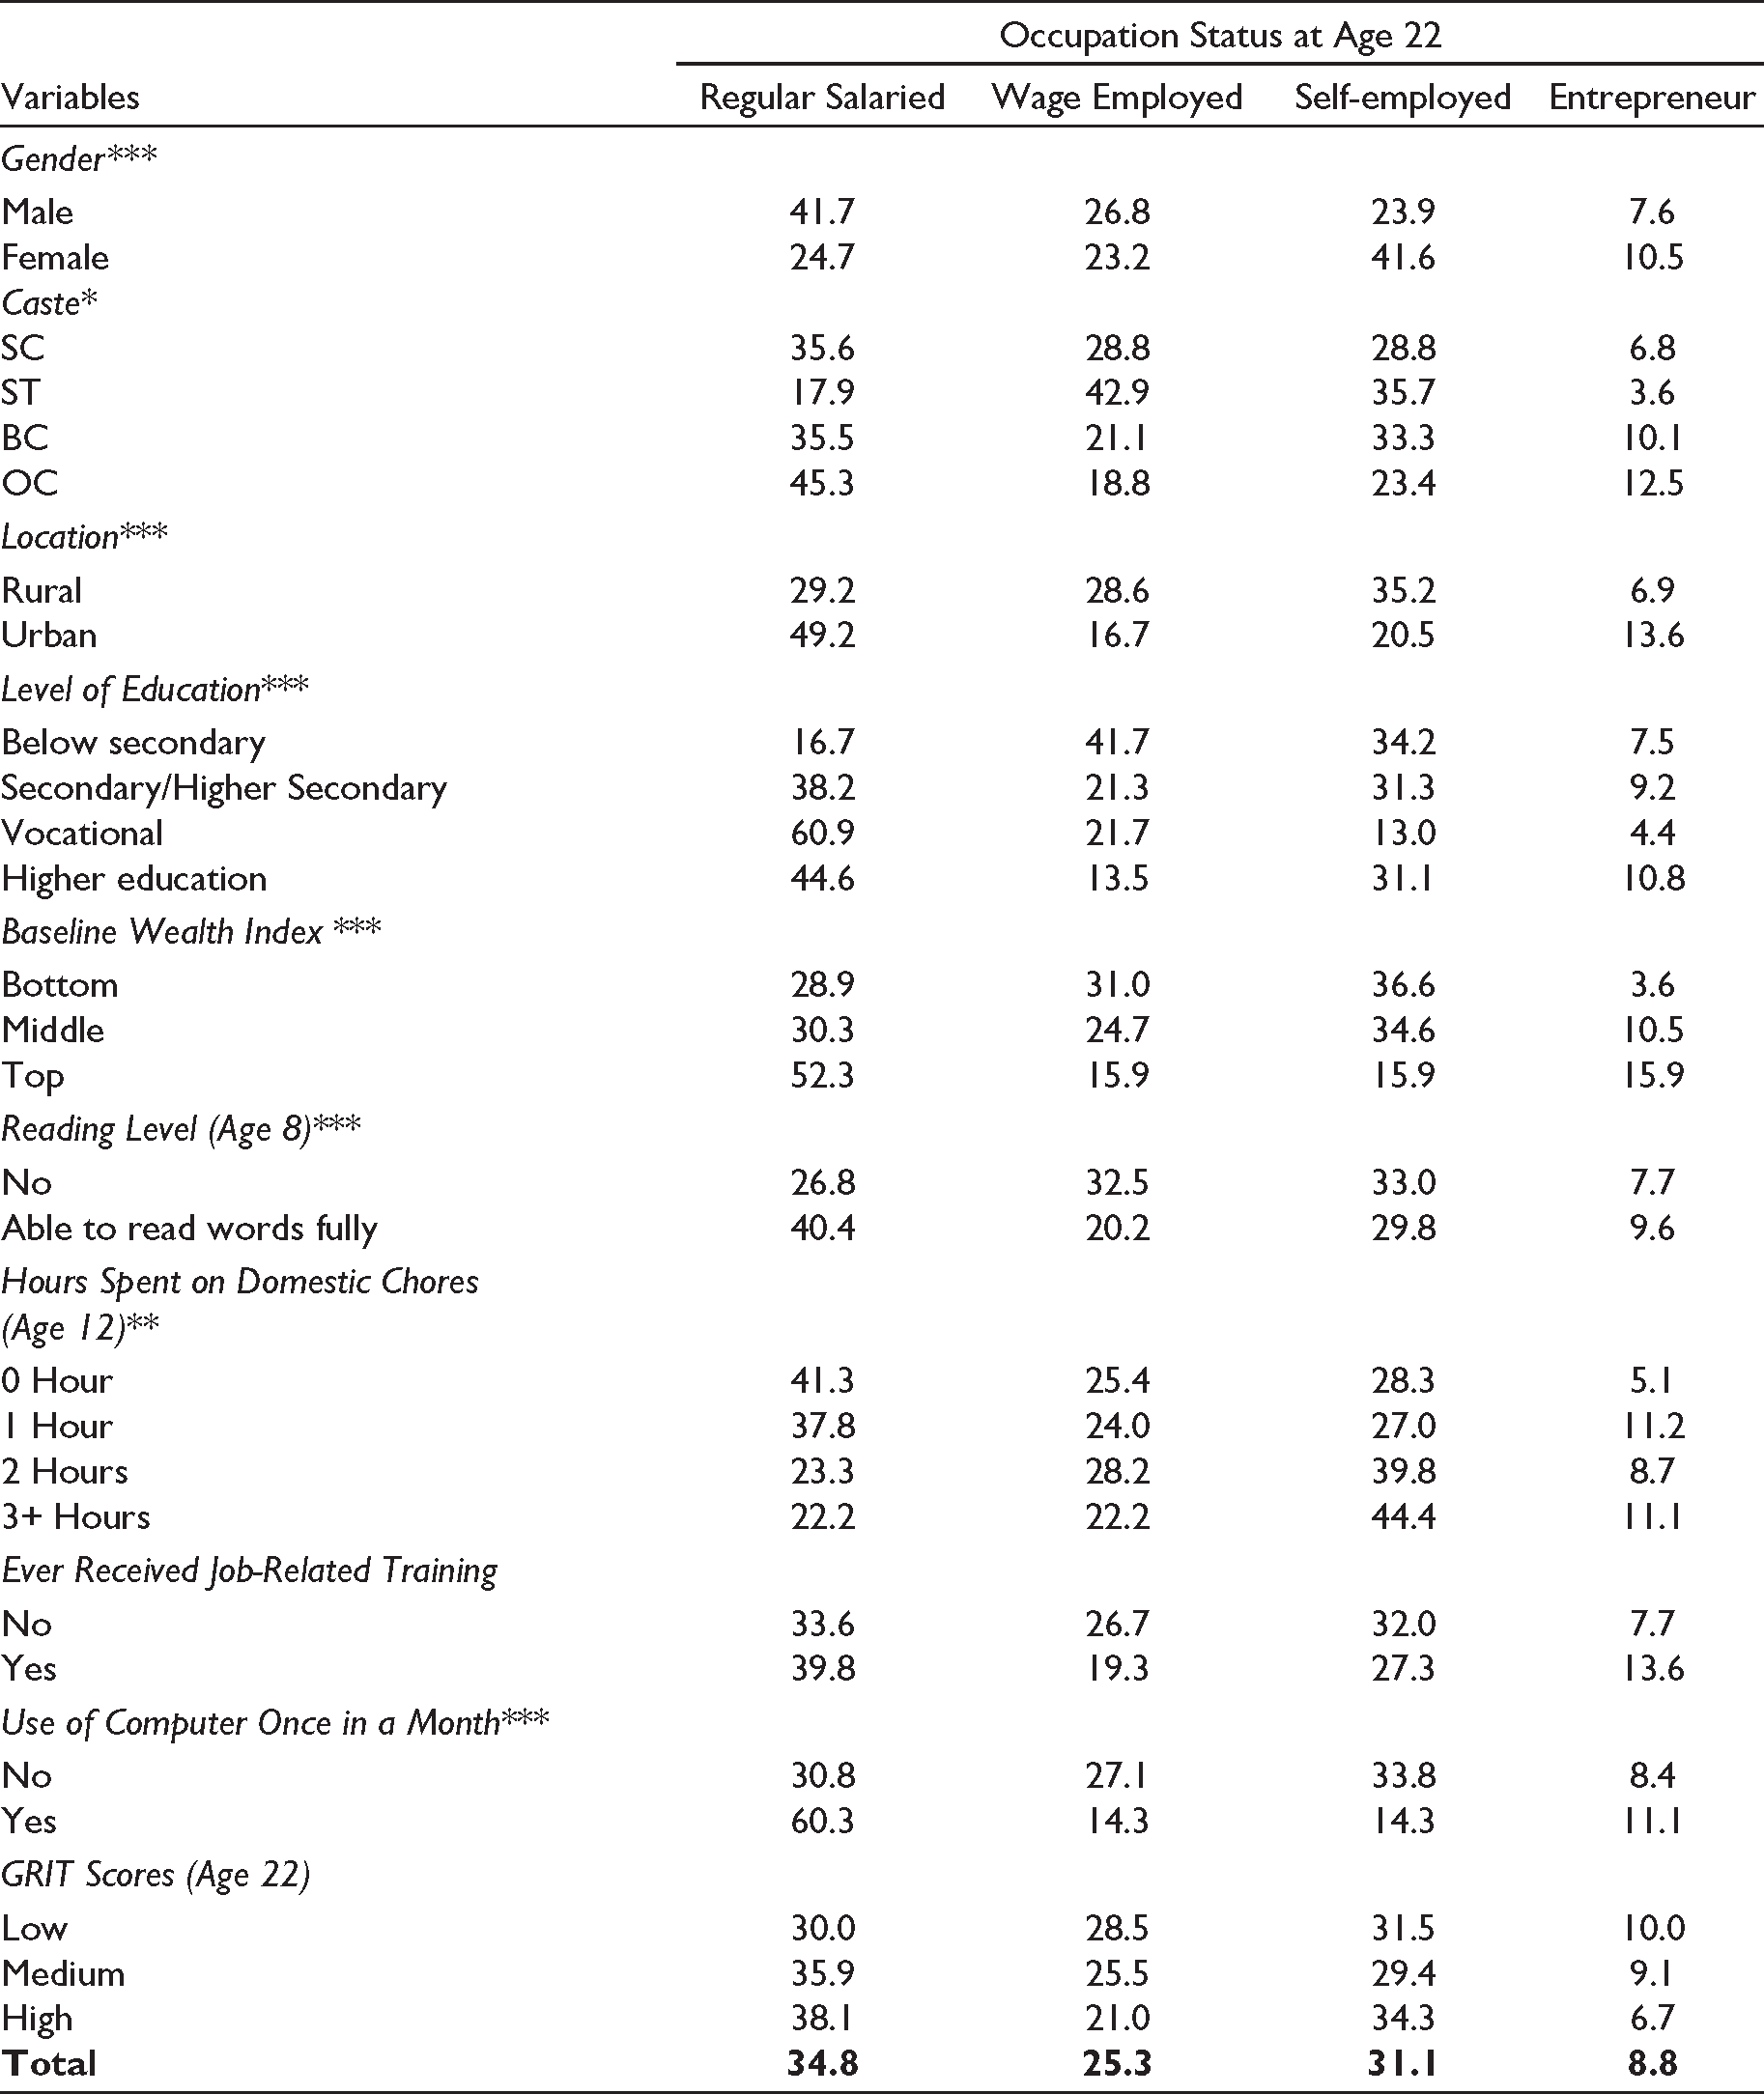
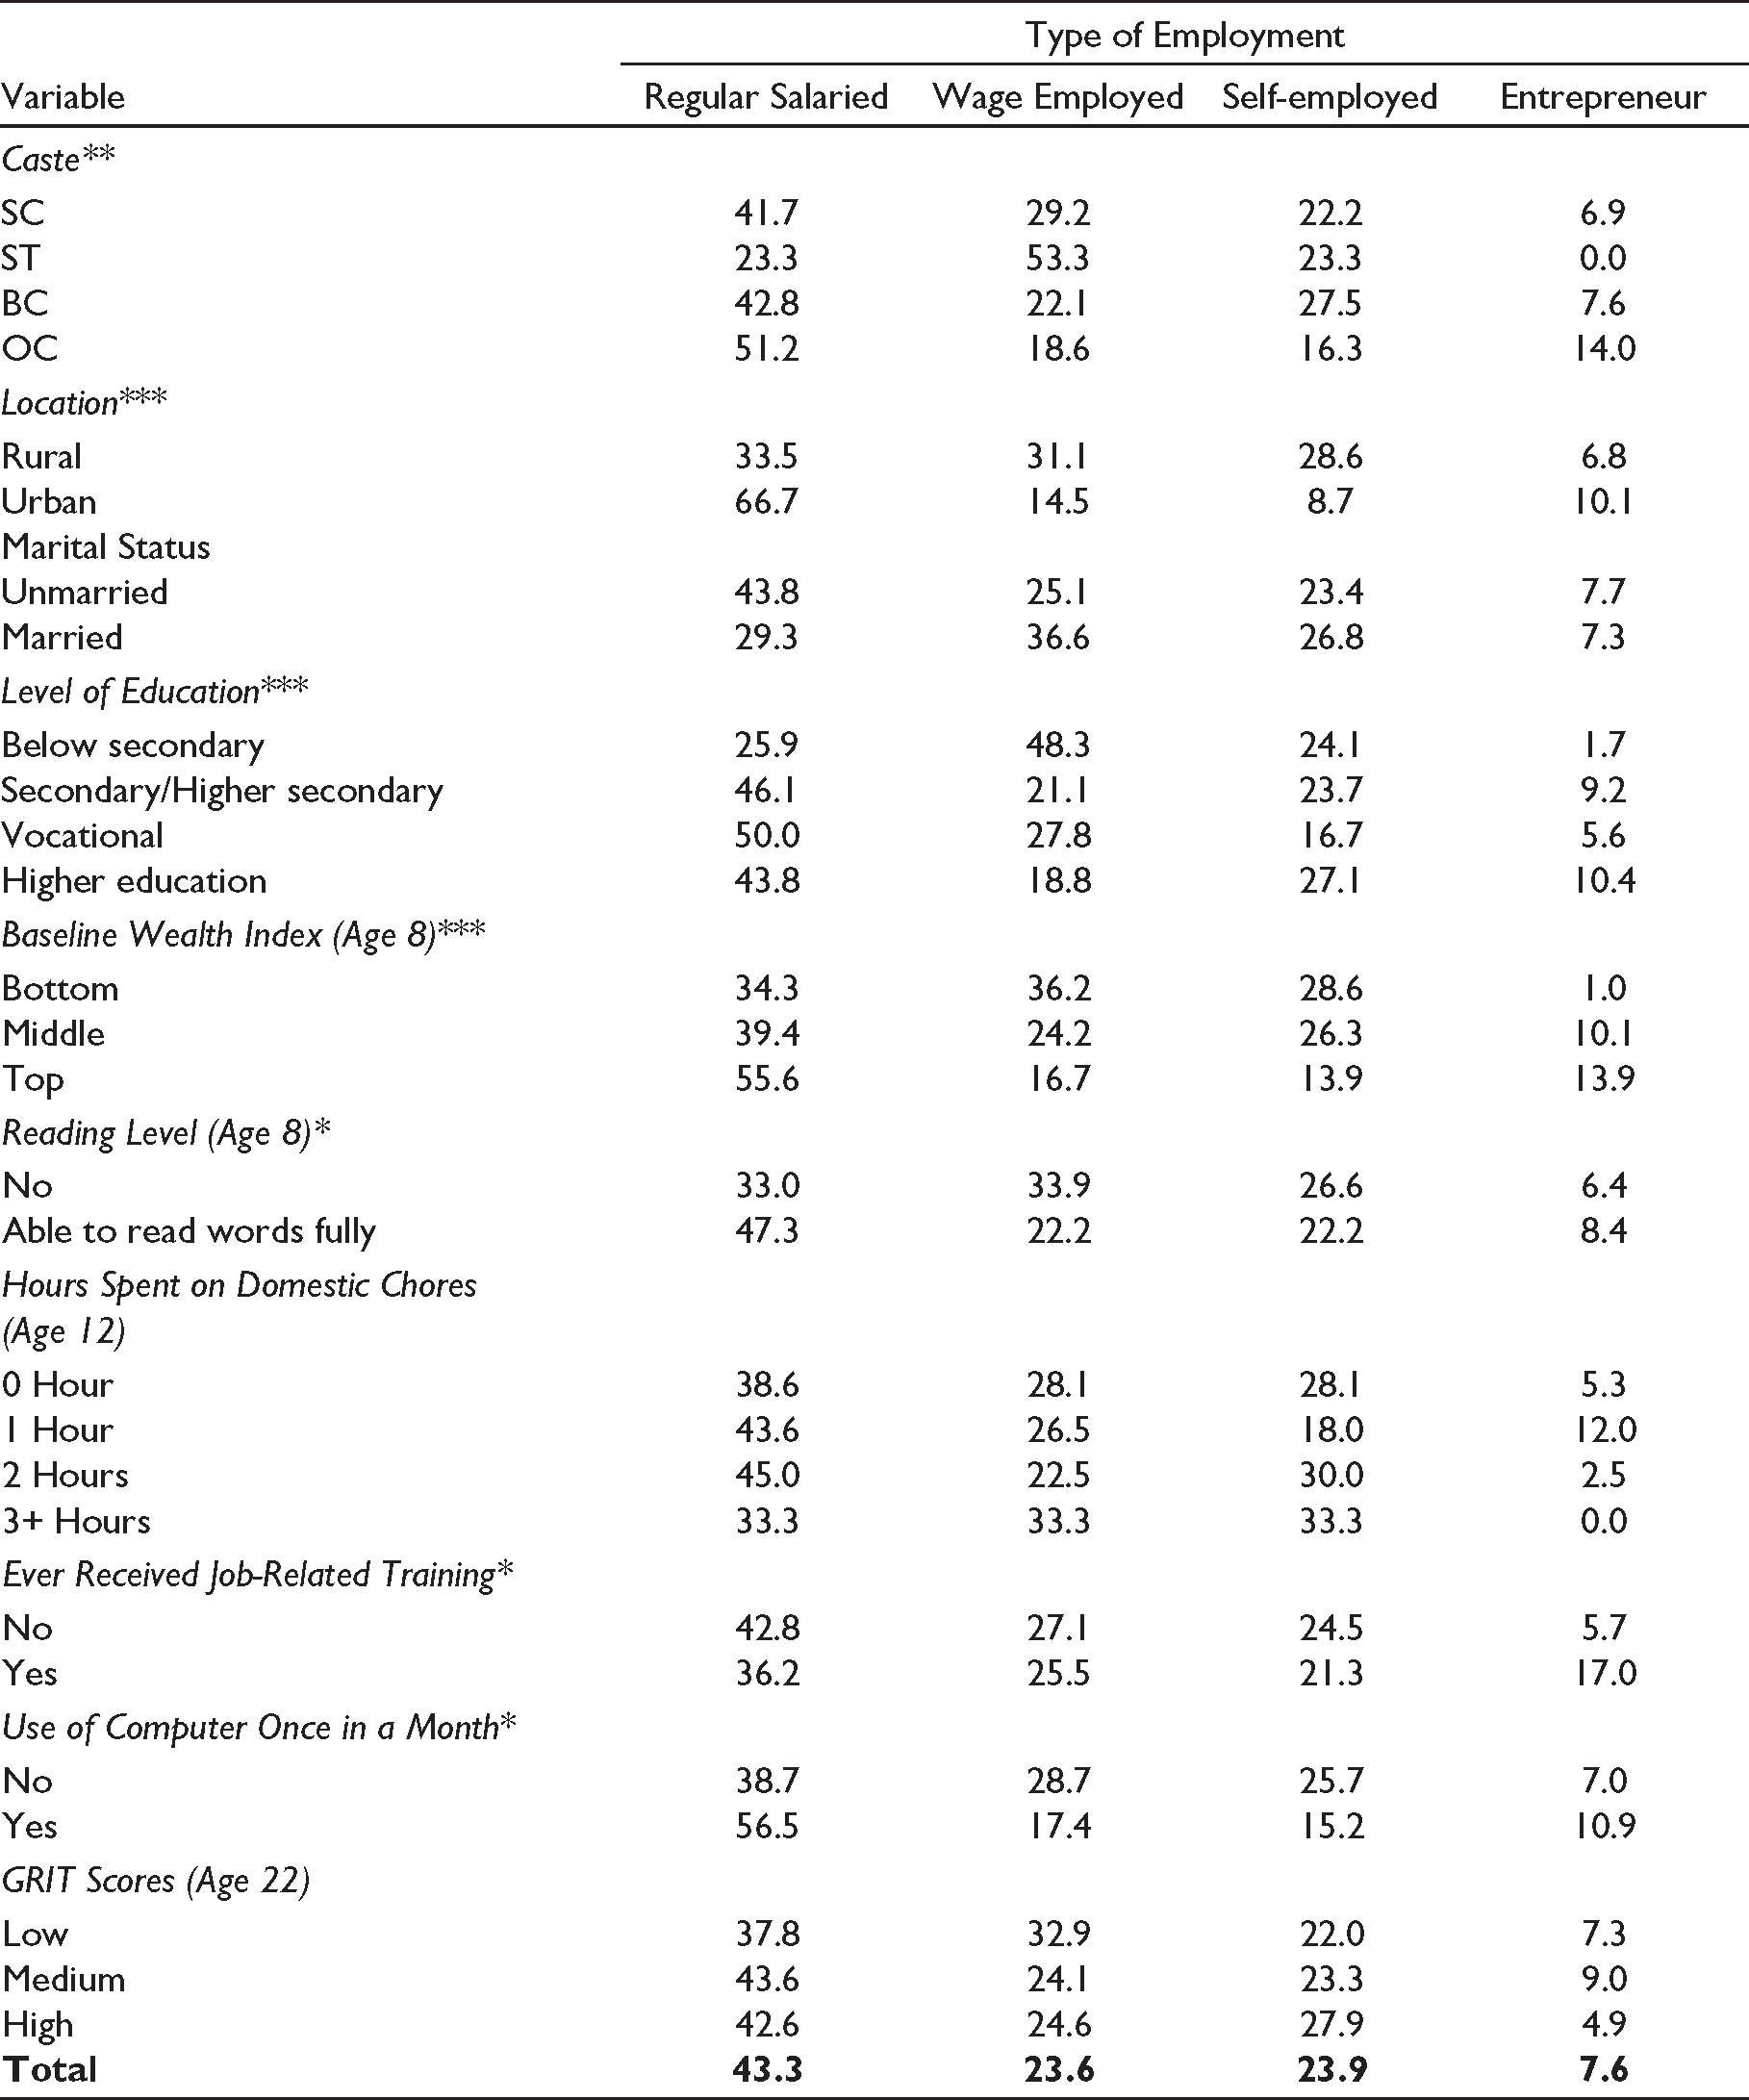
Table 3 further reveals the occupational status of working young adults by select background variables. The largest proportion of youth men (41.7%) were engaged in regular salaried employment, whereas majority of women were engaged in self-employed activities (41.6%). Caste-wise analysis reveals that 45.3% of the OC category children are found doing regular jobs, followed by 35.6% from SC youth while more than two-fifths of ST youth were engaged in wage employment. Location is found to be significantly associated with occupational status, and it shows that youth in urban areas (49.2%) were mostly regular salaried jobs whereas youth in rural areas (35.2%) were primarily engaged in self-employed job activities. Level of education was also found to be significantly associated with occupational status at age 22. The analysis also reveals an important finding, that is, more than 60% of the adults who had a vocational course ended up having regular salaried jobs which is even higher than those who had completed higher education (44%).
Occupational Status at Age 22 by Background Variables.
***P < 0.01, ** P < 0.05 and * P < 0.1.
The baseline wealth index shows significant linkage with the occupational status with more adults from well-off households in regular salaried jobs whereas more than one-third of youth from middle and bottom tercile households were in self-employment.
Across gender, early literacy as measured by good reading ability at age 8 and less than spending two hours in domestic chores at age 12 are significantly associated with being engaged in regular salaried jobs at age 22. In addition to that, young adults who use computer at least once in a month are found more likely to be in regular salaried jobs. h
Gender differences in occupational status at age 22
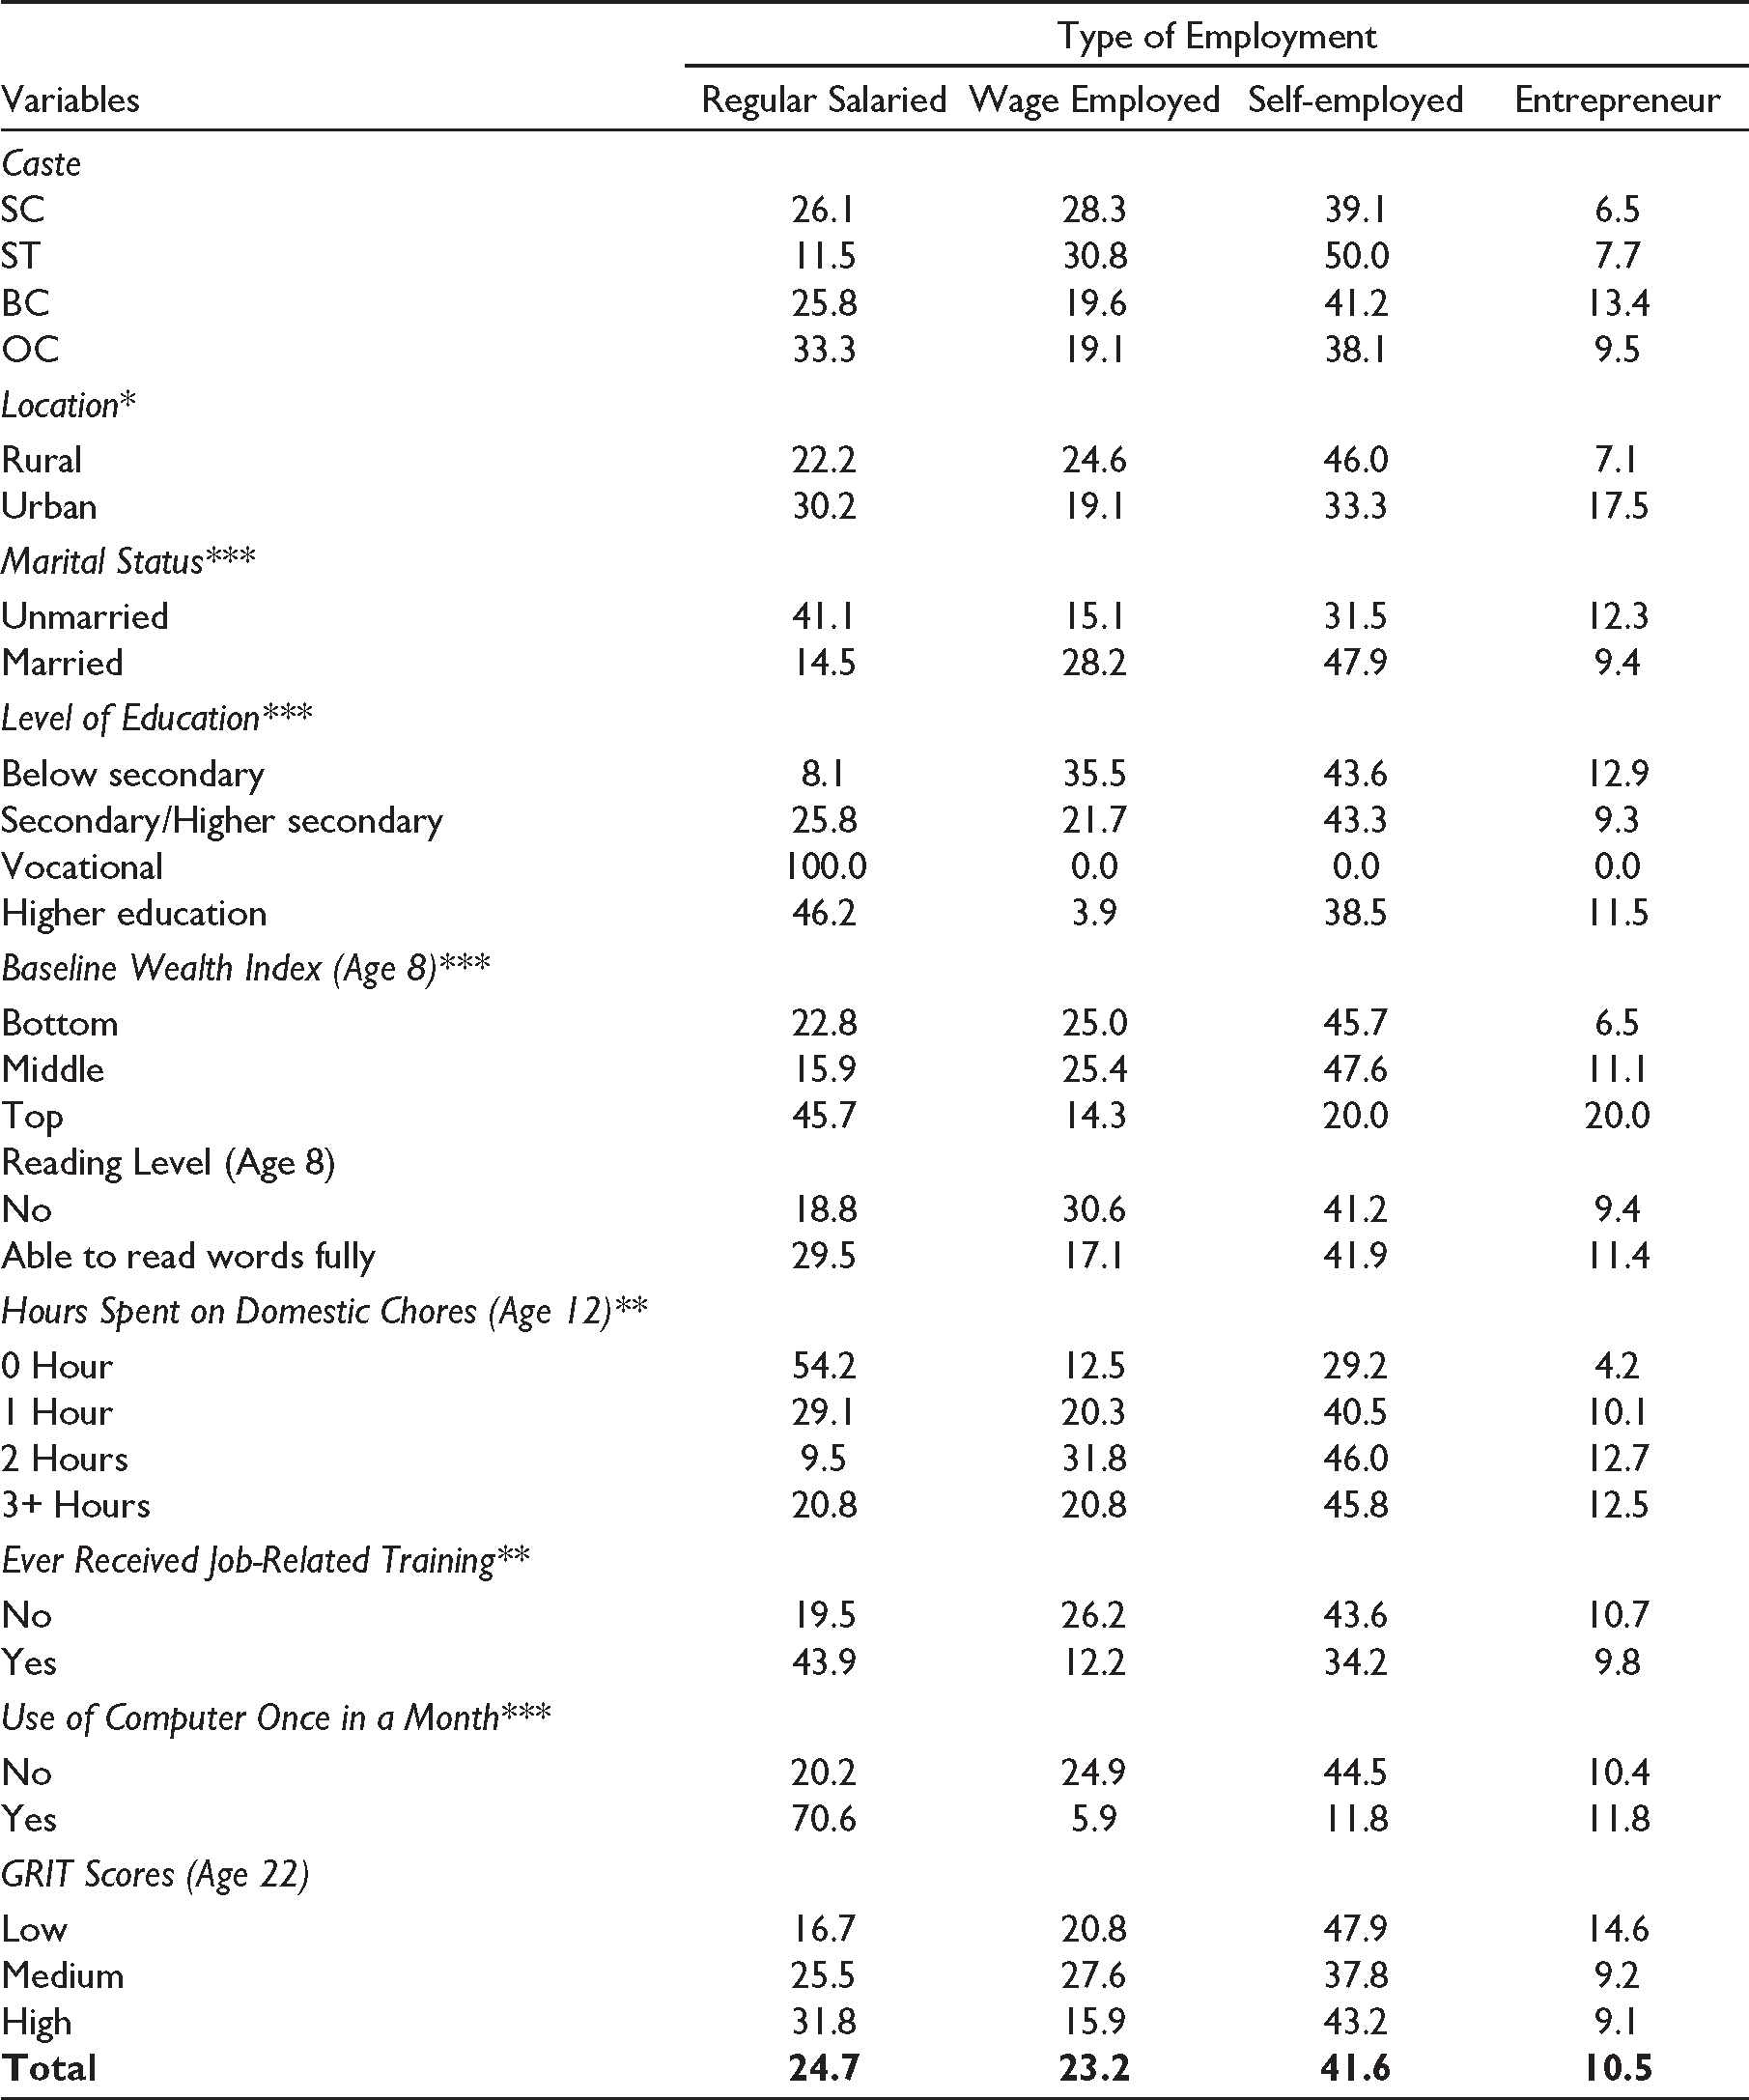
Tables 4 and 5 show gender differences in different occupational categories by select background variables. Further gender analysis reveals that significantly more young men were found to be in regular salaried jobs whereas young women were engaged more in self-employed activities. It is also interesting to note that more females are found in entrepreneurial activities than male adults. More than two-thirds of young men from urban areas were engaged in regular salaried jobs compared to only 30% urban women. Marital status by gender analysis reveals an interesting pattern; an almost similar percentage of unmarried young men (43.8%) and women (41.1%) was found in regular salaried jobs, highlighting the critical role of age of marriage and labour market transition. On the other hand, a majority of married young men at age 22 were engaged in wage employment while married women were largely in self-employment, that is, working on their family farms and other economic activities, mostly without pay.
Level of education by gender reveals that vocational education is significantly associated with regular salaried jobs for both young men and women, and this relationship is found stronger amongst young women. Fifty per cent of the male with vocational education were found to be engaged in regular salaried jobs compared to 100% of the female adults with a similar education. The importance of vocational education in pro-poor setting for young adults is clearly highlighted by this result. India is currently in a unique position where both the employers requiring skilled workers and the employment-seeking population are facing issues (Kumar et al., 2019). It is expected that the Indian manufacturing sector would require labour force of 20 million, which in turn would necessitate the training of 1.5 million technicians every year (McKinsey, 2004). Considering those who had pursued higher education, more young women (46.2%) than men (43.8%) with higher education were found in regular salaried jobs. We note that gender differences amongst youth in regular salaried jobs diminish with increasing levels of education with gender inequity titling in favour of women with higher educational qualifications. Though there is a marked gender difference in favour of men amongst the bottom wealth tercile, it is less marked amongst youth from top wealth tercile households. Results show that 56% and 46% of young men and women respectively from top wealth tercile households are engaged in regular salaried jobs. This is a very important finding with important policy implications in relation to the roll-out of the New Education Policy which aims to increase the Gross Enrolment Ratio in higher education (including vocational education) from 26.3% (2018) to 50% by 2035.
Occupational Status of 22-year-old Men by Background Variables.
***P < 0.01, ** P < 0.05 and * P < 0.1.
Occupational Status of 22-year-old Women by Background Variables.
***P < 0.01, **P < 0.05 and *P < 0.1.
Hours spent in domestic chores at early ages by gender have revealed some interesting patterns related to regular salaried jobs. If no time was spent on domestic chores at age 12, young women (54.2%) are more likely to be in regular salaried jobs compared to their male counterparts (38.6%). But as time spent in domestic chores increases at age 12, young women are most likely to be engaged in self-employed activities, that is, working in family-based economic activities.
Findings also reveal that more women who received job training were found in regular salaried jobs (43.9%) compared to men (36.2%). Similar findings are also observed related to the use of technology (computer); more young women (70.6%) with access to technology were found in doing regular salaried jobs as compared to young men (56.5%).
Multivariate Analysis
This segment consists of two parts, the first part deals with the interpretation of the results as obtained from logit regression analysis to examine how gender differences in regular salaried jobs interact with various socio-demographic, households and individual characteristics, followed by Fairlie’s method of decomposition analysis.
Logistic Regression
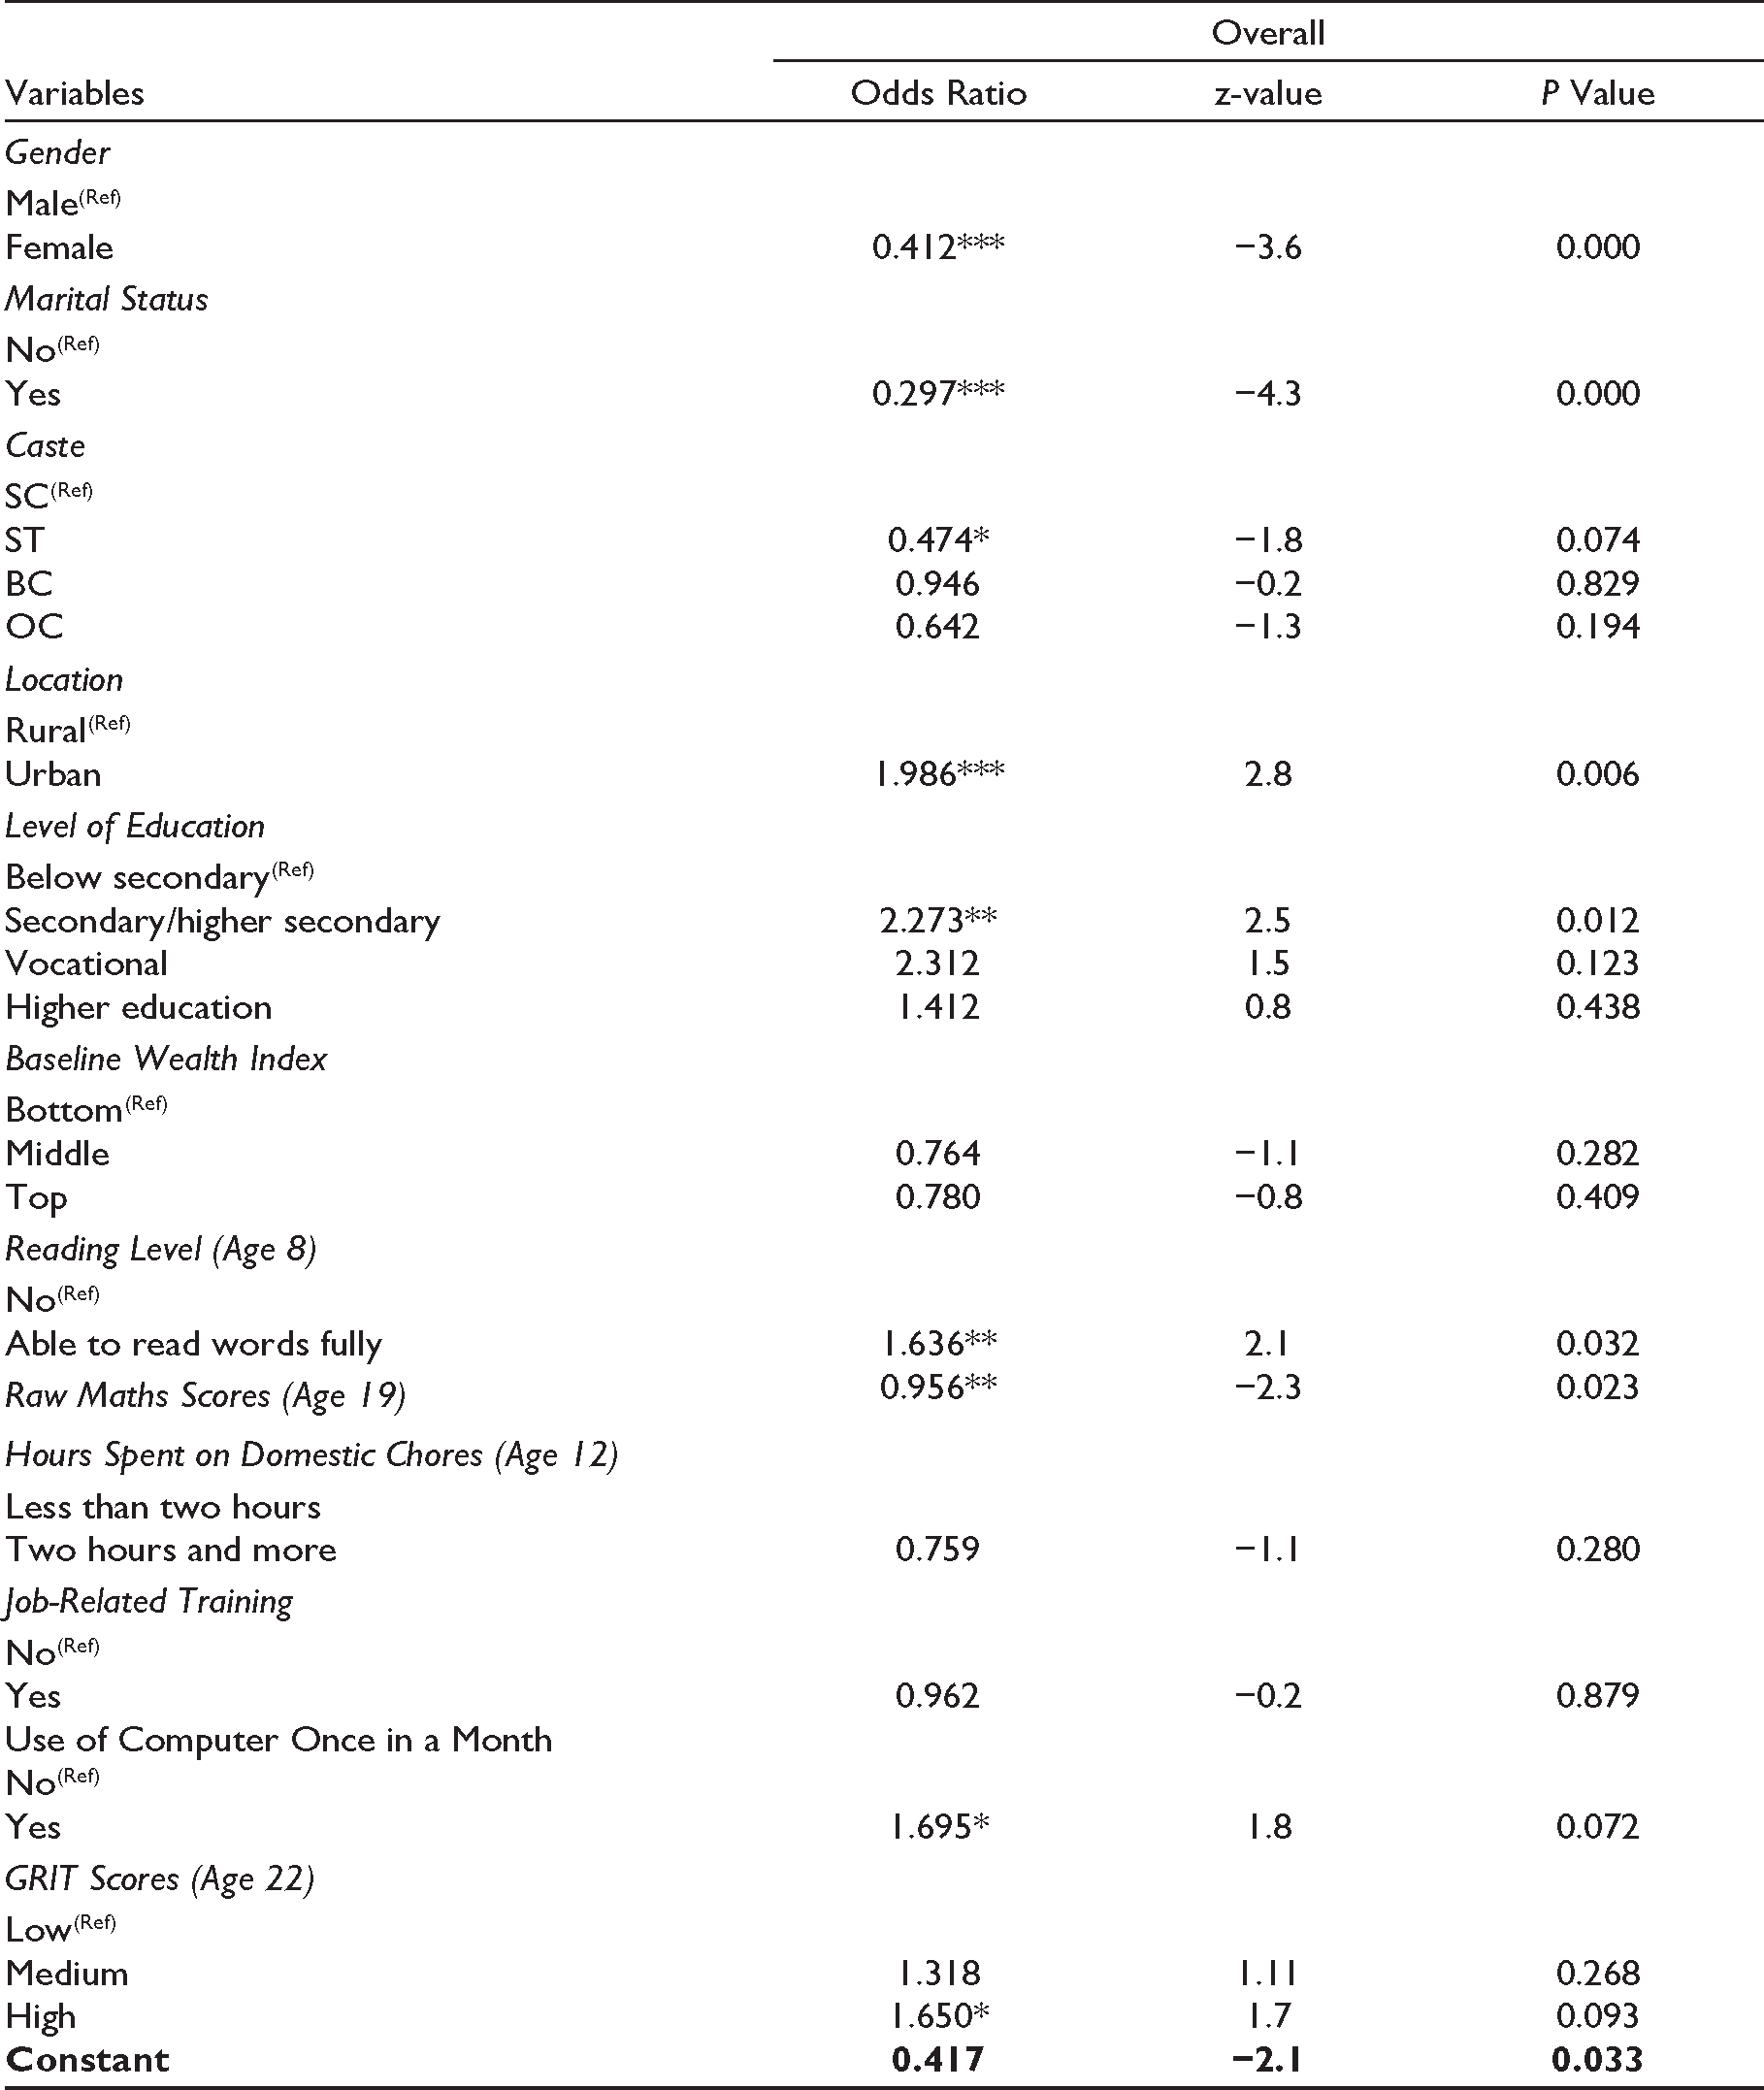
Table 6 shows the odds ratio from logistic regression analysis. The results are obtained after controlling for select background variables.
Odds Ratio Showing Likelihood of Being Engaged in Regular Salaried Activities Among 22-year-old Adults.
*** P < 0.01, **P < 0.05, *P < 0.1.
(Ref): reference category.
Results show that young women were 59% less likely to be in regular salaried jobs compared to their male counterparts after controlling for all other background variables in the model. Furthermore, marital status is significantly associated with the regular salaried job outcomes with married youth 70% less likely to be found in regular salaried jobs as opposed to those unmarried at age 22.
Youth belonging to Scheduled Tribes were also found 53% less likely to be in regular salaried jobs as compared to Scheduled Castes. On the other hand, urban youth were almost twice more likely to be in regular salaried jobs compared to their rural counterparts.
Findings show that adults with secondary/higher secondary education were 2.3 times more likely to be in regular salaried jobs than those without any formal education. Although not statistically significant after controlling for background variables, youth with vocational education were found 2.3 times more likely to be in regular salaried jobs as compared to those without any formal education.
The results further reveal that early reading abilities have a significant association with later labour outcomes, since young adults who had better reading abilities at age 8 were 1.6 times more likely to be engaged in regular salaried employment as compared to those who had poor reading skills. Mathematics scores at the age 19 was also found to be statistically significant though the association appears to be negative. The reasons for this are observed in additional analysis which shows that youth with better mathematics score at age 19 were positively significantly associated with self-employment and entrepreneur categories but not with regular salaried jobs.
Young adults who use computers regularly were also found to be 1.7 times significantly more likely to be in regular salaried jobs compared to those who do not use computers frequently. Results also reveal that higher GRIT scores at age 22 were significantly and positively associated with regular salaried jobs. Youth with high GRIT scores were 1.7 times more likely to be engaged in regular salaried jobs compared to those with low levels of GRIT scores.
Decomposition Analysis
Fairlie’s method of decomposition analysis was carried out to understand the factors explaining the gender gap in labour outcomes for the Young Lives sample at age 22. Though the explained part of the gap can be explained by the differences in the distribution of observable variables (Costa-Font et al., 2008) and often regarded as ‘endowment’ (Fairlie, 2005), it is difficult to look for any direct explanation for this unexplained gap from the decomposition analysis itself. This unexplained part may be attributed to the contribution by unobservable variables, such as social norms, culture and patriarchy to the gender gap, and can be labelled as ‘discrimination’ (Pal, 2004) accounting for gender differences in labour force participation.
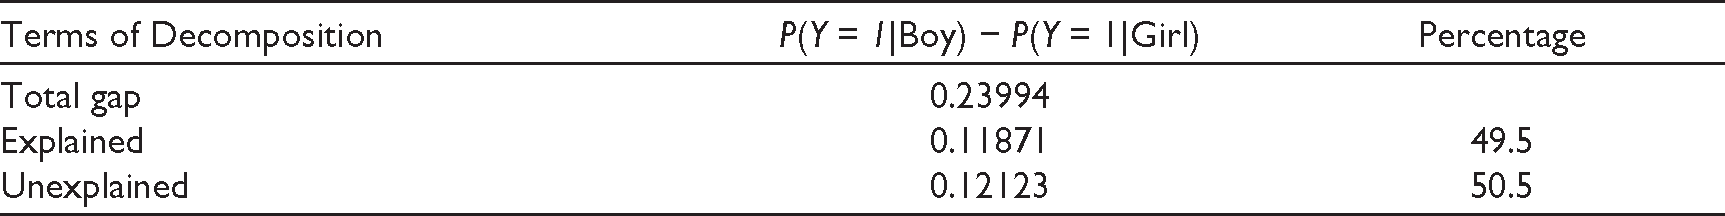
Table 7 shows the aggregate Fairlie’s decomposition results which divide the total gender gap into two parts: explained and unexplained. The model is able to explain 49.5% of the gender gap based on the set of independent variables, that is, endowment factors. However, we can also observe that 50.5% gender gap in regular salaried jobs remains unexplained in the decomposition analysis and could be attributed to factors, such as prevalent sociocultural norms and social norms, that expect married women in particular to not participate in labour market activities.
Aggregate Fairlie Decomposition Result.
The decomposition analysis (Table 8) further highlights the contribution of each independent variable (observables) to the gender gap. It is both interesting and alarming to find that marital status (46.5%) alone contributes more than 98% of the gender gap in employment and appears to be the largest significant contributor. Other contributors to the gender gap in regular salaried jobs are reading level at age 8 (1.9%), job-related training (5.4%), use of computer (3.5%), location (3.3%) and mathematics scores at age 19 (4.6%). These findings highlight how the gender differences in regular salaried jobs could be minimised with quality interventions related to early childhood education, knowledge of computers, job-specific training, building mathematics skills as well as delaying age of marriage.
Fairlie’s Decomposition of Gender Gap in Regular Salaried Job.
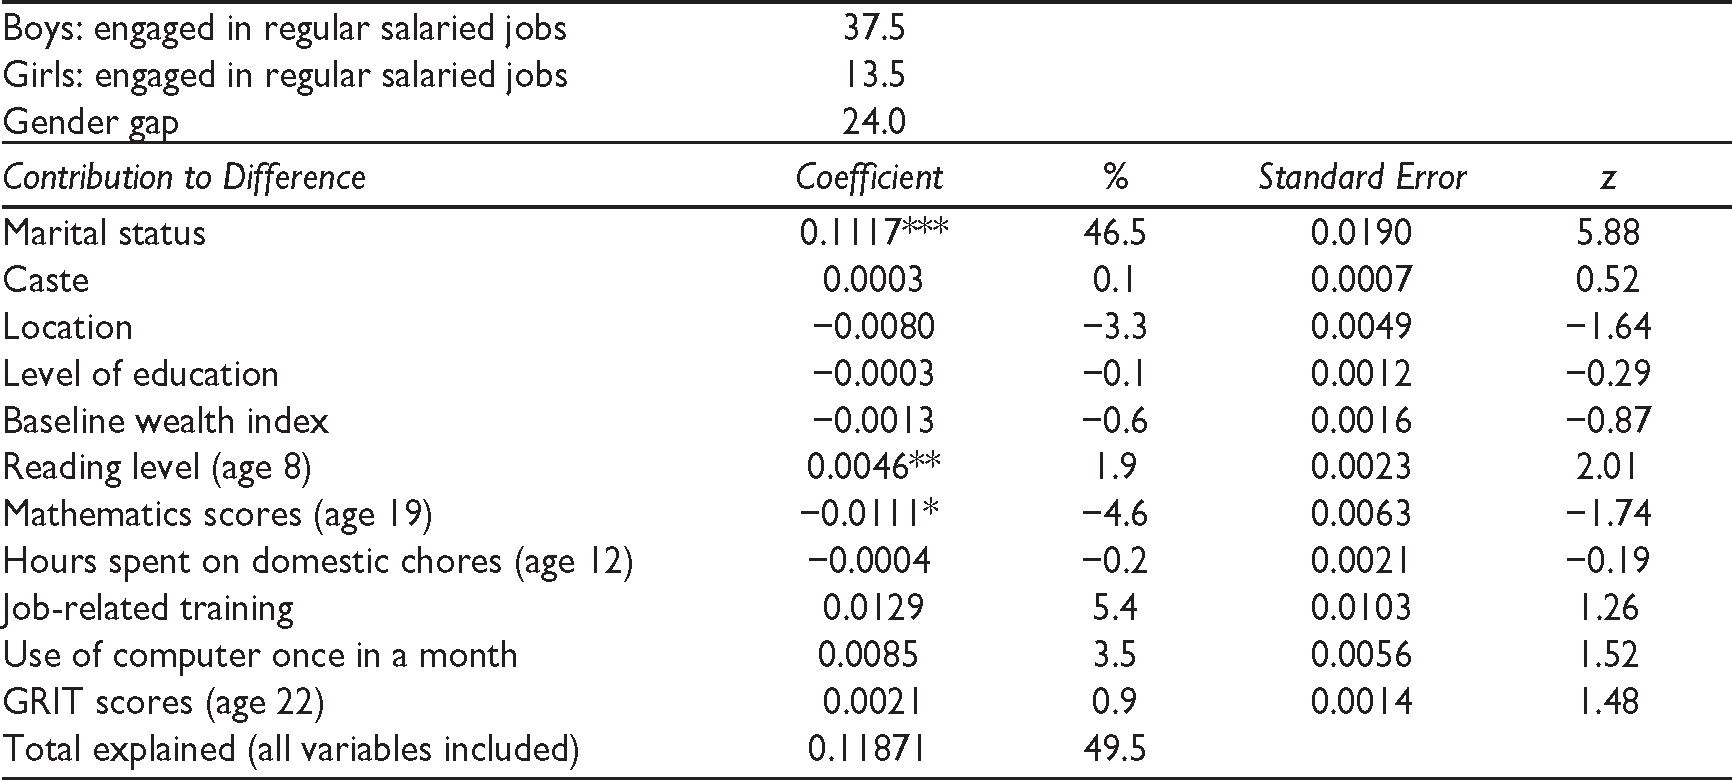
*** P < 0.01, **P < 0.05 and *P < 0.1.
Conclusion
Using Young Lives panel data, this article highlights that at age 22 while 71% of the young adults were engaged in full-time employment, a majority of them were found in regular salaried jobs (34.8%), followed by self-employment (31.1%) and wage employment (25.3%), with least percentage engaged in entrepreneurial activities (8.8%). Further gender analysis highlights a wide gender gap in regular salaried jobs which is significantly biased towards men. Findings also reveal that a large percentage of the young women (43.8%) were married by age 22 and found to be engaged in either self-employed activities, that is, participating in family economic activities or worked for no pay. The latter category of young women is largely occupied in domestic chores and 54.4% are not accounted for in the conventional workforce.
Bivariate analysis reveals that female participation in regular salaried jobs was significantly higher than their male counterparts amongst the unmarried youth as well as those who received job-related training had completed vocational courses or higher education and amongst those who used computers regularly. These findings have huge policy implications as any improvement in educational quality both at the foundational and secondary stage as well as delay in age of marriage and transitions to vocational/higher education may reduce the gender gap in regular salaried jobs.
Logistic regression analysis confirms the gender gap after controlling for background variables that female adults are 59% less likely to be in regular salaried jobs compared to their male counterparts. The positive significant predictors are found to be secondary/higher secondary education level, urban location, better reading ability at age 8, frequent use of computer and high GRIT scores at age 22, while marital status and Scheduled Tribes emerged as significant negative factors in the analysis.
Fairlie’s decomposition analysis further confirms that 49.5% of the gender gap in regular salaried jobs can be explained by the set of predictors used in the logistic regression model, among which marital status alone appears to be the largest contributor to the gap in the labour outcomes. According to a recent UN Women paper, marriage is one of the most crucial life cycle events and has a significant impact on labour force participation (Raveendran, 2016). Other important contributors are reading competency at age 8, job-related training and frequent use of computers.
Policy Implications
These findings have huge policy implications since delay in age of marriage of women emerges as the most significant factor explaining gender inequality in labour market outcomes. Despite the Prevention and Prohibition of Child Marriage Act 2016 being in place, according to the NFHS-4, 62.6% of women got married before 21 years of age (reported by women in the age group of 21–30 years), a third of these women got married before they were 18 years old, 28.3% were married after turning 18 years and before 21 years of age and only 21.2% got married after 21 years of age. A recent analysis by Young Lives of the NFHS-4 data revealed that women who got married after the age of 21 years are seen to have a better job, earn in-cash as compared to women who got married before the age of 21 years (Young Lives, 2021). The Government of India is considering increasing the age of marriage for the girl child to 21 years and had in 2020 constituted the Jaitley Task Force and on 21 December 2021, an amendment to the existing legislation was passed by the Cabinet and presented before the Parliament to examine raising the legal age of marriage of girls to 21 years. We hope evidence, such as this paper will inform the decision-making process, since women’s labour market participation is vital to give them economic independence which is a key factor that contributes to both agency and empowerment.
Given that early reading skills too have a critical role to play in explaining gender gaps, it is important for initiatives under the New Education Policy, 2020, such as Nipun Bharat, while focus on foundational learning to ensure that all children particularly girls from low resource households are provided quality instruction to develop adequate reading skills by age 8. This has implications for both in-service and pre-service teacher training, which currently does not focus on building capacities of teachers to foster early literacy skills including reading.
For young women who are about to enter the labour force, vocational and skills training becomes very important, so that they can be better equipped to enter the labour market. It is important particularly during the pandemic to address the existing digital divide. Twenty-first-century skills including digital literacy must also be given policy attention, so that young women are able to keep pace with the rapid technological transformation affecting the labour market and explore better employment opportunities.
Undoubtedly, it is extremely difficult to tackle gender inequity which is further impacted by caste, location and poverty. In order to achieve more equitable labour market outcomes, we need to provide the most vulnerable population marginalised by gender, caste, poverty and location, a social protection mechanism that can ensure more regulated wages as well as services, such as creches to enable young mothers to enter the labour market. Better regulation of wages to remove gender discrimination across sectors is also the need of the hour as is the need to provide enhanced job security through written contracts.
Education, upskilling and reskilling over the life course—especially to keep pace with rapid technological and digital transformations affecting jobs—are critical for women’s and girl’s health and well-being as well as their income-generation opportunities and participation in the formal labour market.
The unexplained part of the Fairlie’s analysis may well be explained by existing sociocultural norms and entrenched patriarchy that may be correlated to girls not completing their secondary education and getting married early, in turn leading to low female participation in regular salaried activities. Early marriage, teenage pregnancy and greater burden of care that is the fate of many young girls need policy attention and a campaign to address these age-old prejudices using print and social media are urgently required (to change parental prejudice and aspirations towards their daughters), if we wish to take advantage of our demographic dividend comprising of 50% young women.
Footnotes
Declaration of Conflicting Interests
The authors declared no potential conflicts of interest with respect to the research, authorship and/or publication of this article.
Funding
The authors received no financial support for the research, authorship and/or publication of this article.