
Abstract
This article examines the effects of parents’ educational backgrounds and career preferences on their children’s educational and employment opportunities in India’s various socio-religious groupings. Using information from India’s several National Sample Survey Rounds (2000–2012) and the Periodic Labour Force Survey Round 2018–2019, the article analyses co-resident father–son relationships. This study investigates the impact of a father’s occupational–educational status on the probability of their sons’ getting decent jobs. Additionally, the likelihood of completing a senior secondary and above level of education in relation to the educational backgrounds of the mother and father has been examined. For both occupational and educational attainments, this study uses the discrete choice model along with the logit equation. The findings indicate that the probability of getting jobs in the three mentioned occupations is restricted to sons whose fathers are already employed in similar occupations. In addition, there is a wide spectrum of inequity in access to jobs in these occupations among Socio religious communities. The father’s education has a significant impact on the possibility of receiving the senior secondary and above level of education. This study demonstrates a strong hierarchy across the father’s level of education, occupation, and socio-religious communities. This calls for conscious policy intervention to destabilize such a hierarchy. Communities must get a big push through their own resolve and timely and adequate interventions from the state and non-state actors.
Keywords
Introduction
A much-researched subject has been the question of how and to what extent parental characteristics affect children’s educational mobility and occupational choices (Cordeiro et al., 2018; Erola et al., 2016; Urbina, 2018). Parental occupational status is strongly associated with children’s future occupational outcomes, indicating that children are more likely to follow similar career paths as their parents (Breen & Jonsson, 2005; Erikson & Goldthorpe, 1992; Haas, 2006). Furthermore, parental education has a major impact on the educational attainment of their children, with the offspring of more educated parents more likely to acquire higher levels of education (Checchi et al., 2008; Hertz & Wiemers, 2010; Jackson, 2010). These findings highlight the importance of intergenerational effects in a variety of contexts as well as the cross-cultural relevance of understanding how parents’ educational and occupational backgrounds influence their children’s prospects. This study investigates the role of parental attributes in concretizing their children’s career choices and educational attainment across various socio-religious communities (SRCs) in India. 1
It should be emphasized that the post-1980 structural transition transformed India’s economy from one that was mostly centred on agriculture and the rural sector to one where the urban and non-agrarian sectors are progressively starting to play a key role. The rise of medium- and high-tech industries increased the need for a highly qualified workforce as these industries underwent fast technological change (Chamarbagwala, 2006; Chowdhury, 2011; Goel, 2017; Thomas, 2012). Furthermore, the proportion of employment in three occupations has changed dramatically over time: officials and managers (1), professionals (2), and associate professionals (3). Other than the growth in high-skill-based jobs, another important factor is that these jobs are responsible for critical decision-making, execution, and policy formulation. Professionals and associate professionals are knowledge-based occupations that require a minimum of tertiary education, vocational training, and experience (Evetts, 2003).
We analyse the distribution of jobs across India’s major socio-religious groups as the status of professionals, associate professionals, officials, and managers rises. The analysis of success in these three professions is conducted using a logit framework, taking into account the individuals who hold these jobs and the significance of their family background. The extant literature suggests that a higher level of education is essential for success in these domains and is significantly correlated with progress in securing decent employment (Bardhan, 2019, p. 30). This analysis also tracks attainment toward higher education (here, Senior Secondary and above). 2
The key contribution of this work is the argument that higher occupational attainment in India is strictly limited to those who have parents who work in highly skilled occupations. As a consequence, immobility rather than mobility makes up a larger sample in this case. Upward mobility only accounts for those who migrate from low-paying jobs to high-paying jobs. To account for both immobility and mobility, we looked at the probability of sons pursuing professional careers. The probability is calculated based on whether or not the son works in one of the three occupations: officials and managers, professionals, and associate professionals.
It should be noted that in developing countries, occupational attainment studies frequently overlook the discussion of occupational classes and their boundaries. Some notable work on occupational attainment classifies occupations into four to six broader categories (Azam, 2015; Deshpande & Ramachandran, 2019; Hnatkovska et al., 2013; Majumder, 2010; Motiram & Singh, 2012). In the Indian context, economists may not include debates around the occupational classes in their intergenerational (IG) mobility research, but the literature on political economy and sociology is rich in this case. Some notable mentions in the list include the identification of three dominant classes in India (businessmen, farmers, and professionals) by Bardhan (1984, as cited in Chatterjee & McCartney, 2019) and four classes (dominant classes, petty bourgeoisie, formal proletariat, and informal proletariat) by Agarwala (2006). Professionals have received considerable attention in the studies of structure and class formation. In the context of Latin America, Portes and Hoffman (2003) characterize capitalists, executives, and professionals as the prevailing classes endowed with an outsized share of authority and resources. Nonetheless, in developing countries, such groups account for only a small proportion of the labour force. But over time and across different cross-sections, the size, makeup, and nature of such employment are prone to change. Bardhan’s professionals, for instance, are members of the government-employed urban elite. Rudra (1989) used the term ‘intelligentsia’ to describe a similar concept. The study of Bardhan and Rudra reflected contemporary Indian society prior to the pre-economic reform era. During that period, professionals’ sources of dominance were their scarce ‘property’ in the form of education, skills, and technical expertise. Their privilege was allegedly bolstered by restricted upper-caste networks and cultural characteristics, and they were supposedly selling their mental labour to the public and commercial sectors and earning rentals (Bardhan, 1984; Rudra, 1989).
The composition of class structures is susceptible to change, especially when economic reforms are put into place and transition occurs in developing nations (Agarwala, 2006). Accelerated economic growth and structural change have resulted in a shift in the form and magnitude of occupational class structure. For example, a burgeoning middle class is celebrated in the post-reform era as evidence of expanded prospects (Herring & Agarwala, 2006). The role of the public sector has shrunk, and many attributes that used to be associated with government jobs, like making decisions, getting paid, having skills, having power, and making connections, are now found in the private sector.
In the post-liberalization era, the premium based on the professional’s assets (expertise, information, and networks) has proven to be relatively stable. Those having access to the best technical education and professional networks are nevertheless typically drawn from affluent and well-connected groups (Jeffrey et al., 2008) and are in high demand (Cain et al., 2010). Given the enrolment surge in the past two decades, however, professionals no longer hold a monopoly on higher education (Chatterjee & McCartney, 2019, p. 165). Along with the professionals, there is a junior class with tertiary education, skills, and networks: the associate professionals. They are the upcoming professionals who have also seen formalization, wage growth, and increasing employment and are closely involved in decision-making and execution.
The discussed workforce in the preceding paragraphs comprises the first three divisions of the national classification of occupations (NCO-2004) scheme: officials and managers, professionals, and associate professionals. This study has adopted a novel strategy that combines both dimensions: human capital and decision-making authority. Who gets what is one of the main developmental questions brought up by the two-sector occupational class analysis in this study.
The significance of the two-sector occupational class analysis in the current work is also understandable in light of the complexities surrounding the upward and downward mobility analysis. The upward or downward mobility analysis is more appropriate when the data is available on a continuous scale, such as wages, income, and years of schooling. In the absence of theoretical and empirical foundations, it is difficult to construct a clear occupational class schema for occupational attainment, especially when several occupations are lumped together. Several attempts have been made in India to classify clerks alongside professionals or associate professionals (Deshpande & Ramachandran, 2019; Hnatkovska et al., 2013; Sinha, 2018). Conversely, some classifications place clerks alongside service workers, shop and market salespeople, craft and related trade workers, plant and machine operators, and assemblers (Azam, 2015; Majumder, 2010; Reddy, 2015). Farmers and agricultural labourers were merged in certain studies, mainly those that utilized the National Classification of Occupation, 1968. The research of Iversen et al. (2017) and Kundu and Sen (2022) probably resulted in some refinement of this scenario. Nevertheless, the aforementioned studies have grouped all farmers together, regardless of the extent of their landholdings. In this case, it remains unclear if this situation involves moving upward or downhill. This type of common agricultural occupational group is the focus of all relevant studies (Azam, 2015; Deshpande & Ramachandran, 2019; Majumder, 2010; Motiram & Singh, 2012; Reddy, 2015). Larger occupational groupings can be utilized to establish a separate occupational hierarchy, though the fundamental problem in this instance is the sample size, and having too many occupational groups may make things complicated. Thus, we have chosen to develop a two-sector classification with distinct limits. Additionally, we are now more concerned with attainment than mobility. The sons who remained in the respectable positions held by their fathers and the sons who assumed these places. Section I discusses, from a conceptual point of view, how classes are built and where their limits are.
The estimation of the job distributions among the SRCs in absolute terms is also another contribution of this work on the empirical front. This study demonstrates the representation of diverse groups in these highly skilled decision-making authorities. This study contributes to the growing body of literature on intergenerational mobility analysis that focuses on higher educational achievement (Andreou & Koutsampelas, 2015; Torche, 2018). In this regard, the mother’s education and the son’s higher educational attainment have also been probed. Majumder (2010) explored the impact of a mother’s education on a child’s years of educational attainment. In addition to updating this account, the new work contextualizes the mother’s education within the framework of her sons’ post-secondary or higher (11 years or more) educational achievement. The current analysis also draws attention to a critical flaw in the Indian Human Development Survey (IHDS) based estimates, notably the omission of the key distinction between part-time and full-time workers. This omission may have an effect on occupational mobility dynamics and mobility estimates. Specifically, the examination of increased educational and professional movement and achievement, along with the author’s focus on data-related matters, brings together issues that have traditionally been addressed independently.
This study is divided into four sections. Section I summarizes the demographic and occupational characteristics of the sample population. This section examines the distribution of jobs by organized and unorganized sectors, as well as formal and informal employees, and maps the earnings, income, and wages of various occupations using the recently released PLFS-2018-19 data. This illustrates the relative significance of different occupations in the labour market. The second section examines data, techniques, and empirical requirements. Section III tackles the logit equation results and subsequent discussion. The conclusion is summarized in Section IV.
Section I
Labour Force Profile of the Sample Population
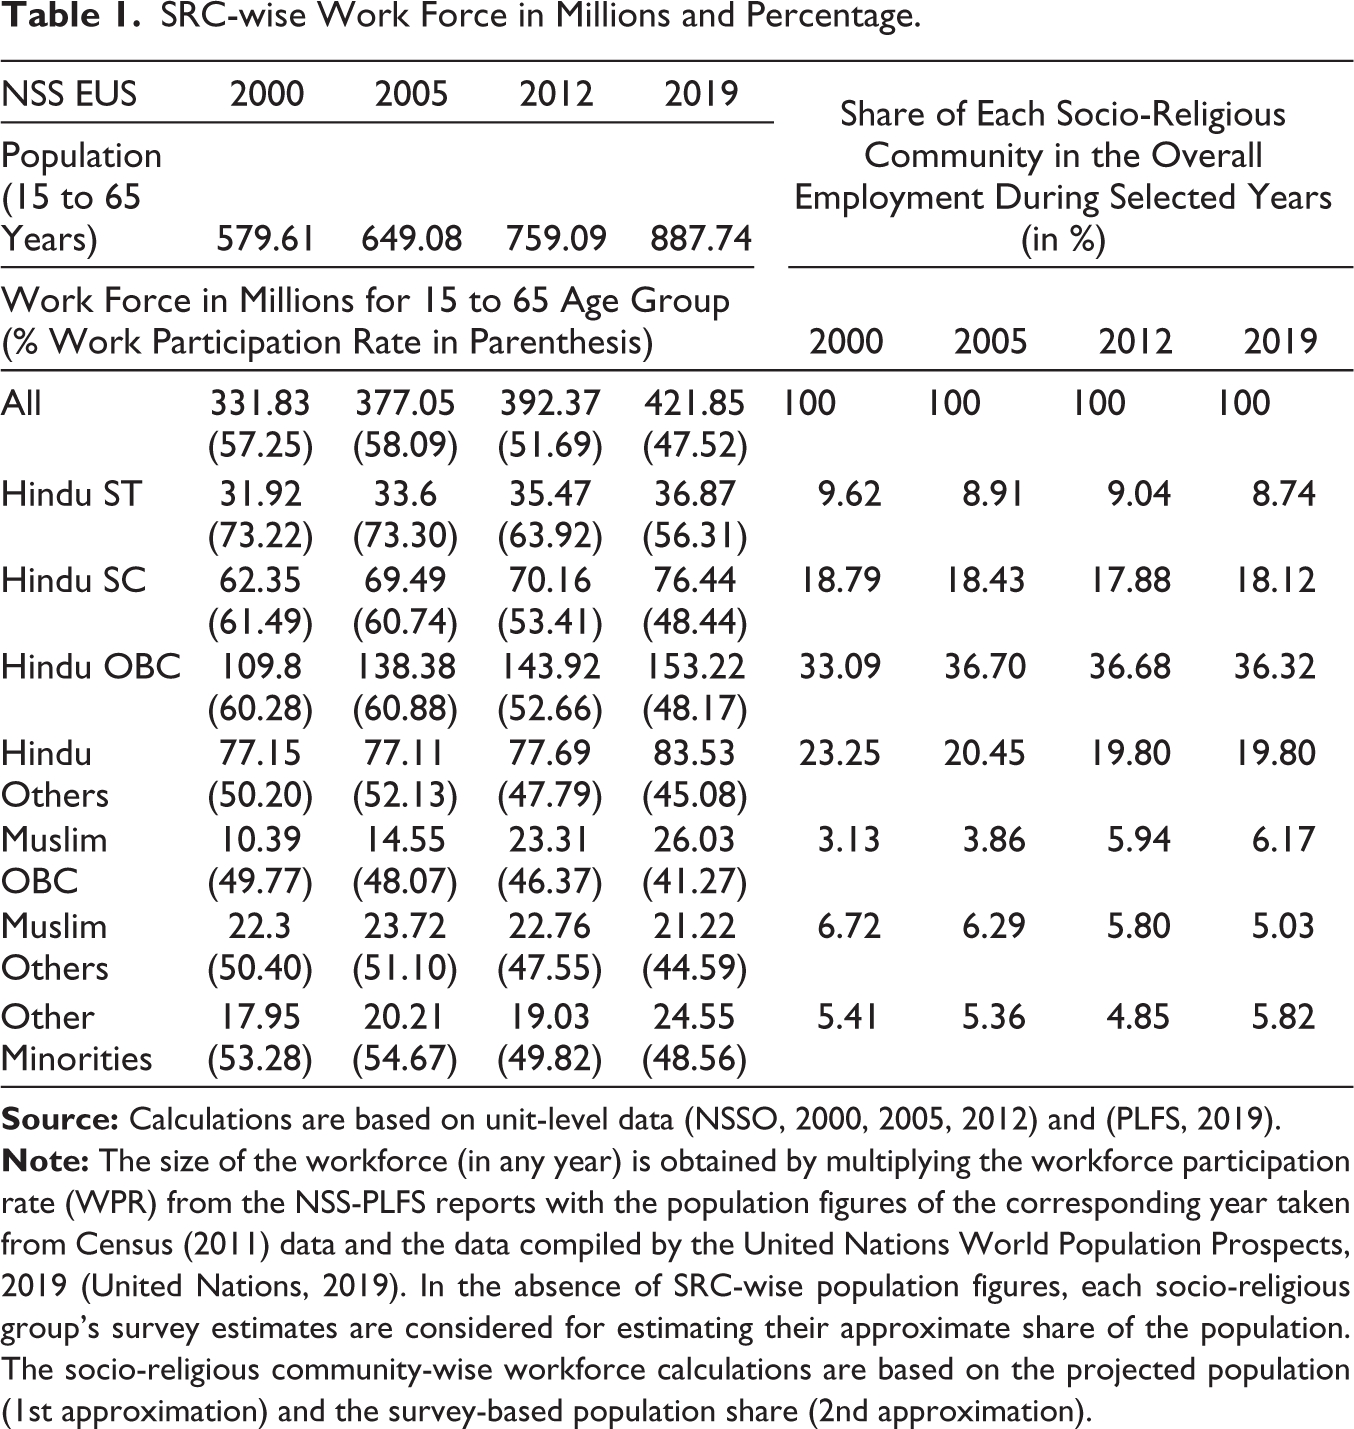
Table 1 shows that more than 420 million people work in the Indian economy on the usual principal status (UPS). There is a 10% reduction in the work participation rate in 2019 compared to 2000. While the workforce is expanding due to an increase in the working population (aged 15–65), participation is declining. The decline in workforce participation rate (WPR) is associated with a variety of factors, such as the withdrawal of women from the workforce, an increment in the educational level, the shrinkage of agriculture, and increased household income. These mentioned factors are not mutually exclusive, and there are overlapping. The majority of the labour force supply is made up of OBCs, distantly followed by Hindu Others. Examining the individual shares of various socio-religious groups, Table 1 reveals that Hindu OBCs account for 36.32% of overall job claims in 2019. Muslim OBCs and Hindu SCs have seen an increase in their percentage share of overall employment, whereas Muslim Others and Hindu STs have registered a fall. Hindu OBCs and Hindu Others continued to hold steady percentages of about 36% and 19%, respectively. The increased absolute numbers of the workforce between 2000 and 2019 got absorbed in different occupational activities. There is a tremendous change in the occupational structure of the economy. In the upcoming sections, it has been discussed where job creation is taking place and how different SRCs are represented in it.
SRC-wise Work Force in Millions and Percentage.
Occupational Classification
Examining the occupational structure through the lenses of three occupational categories—officials and managers, professionals, and associate professionals—this research offers a perspective on the occupational structure. This enables us to evaluate society from the viewpoints of two distinct groups: those in positions of authority, such as managers and professionals, and those without such positions. As a result of the significance and growth of certain professions over time, this strategy has resulted in a migration towards them. The reference to a list of professionals’ domains offered by Olgiati et al. (1998) and cited by Evetts (2003) is significant here: Professionals are involved in birth, survival, physical and emotional health, conflict resolution and law-based social order, finance and credit information, educational attainment and socialization, physical constructs and the built environment, military engagement, peacekeeping and security, entertainment and leisure, religion, and negotiations. In line with the reasoning presented above, the first strata reflect an overall rank in the social hierarchy. This stratum represents the investments in education, qualifications, and capacities, as well as the hurdles that must be overcome to achieve social positions (Domański & Sawinski, 1987).
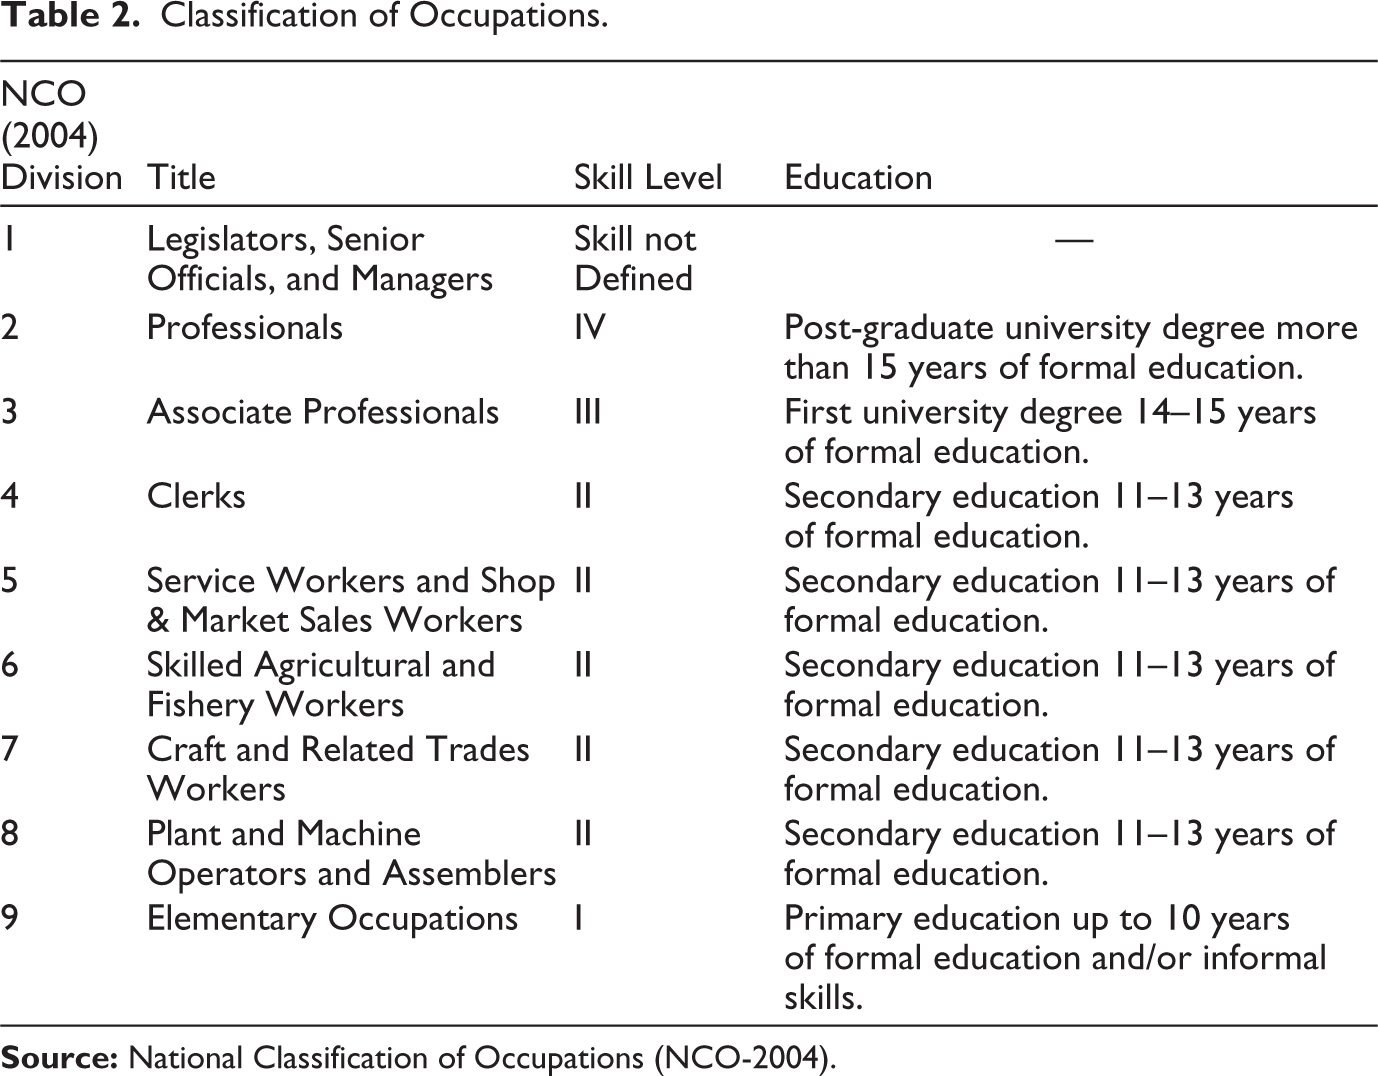
The NCO-2004 (Government of India, 2004) classifies a variety of occupations according to their varying skill requirements. As shown in Table 2, we have followed nine occupational structure divisions. Accessible occupational data for the 2000 and 2005 surveys is based on the NCO-1968 methodology, on the other hand, the 2012 and 2019 occupational data are based on the NCO-2004 scheme. A comparison of all four rounds has been facilitated by establishing a correspondence between NCO-1968 and NCO-2004.
Classification of Occupations.
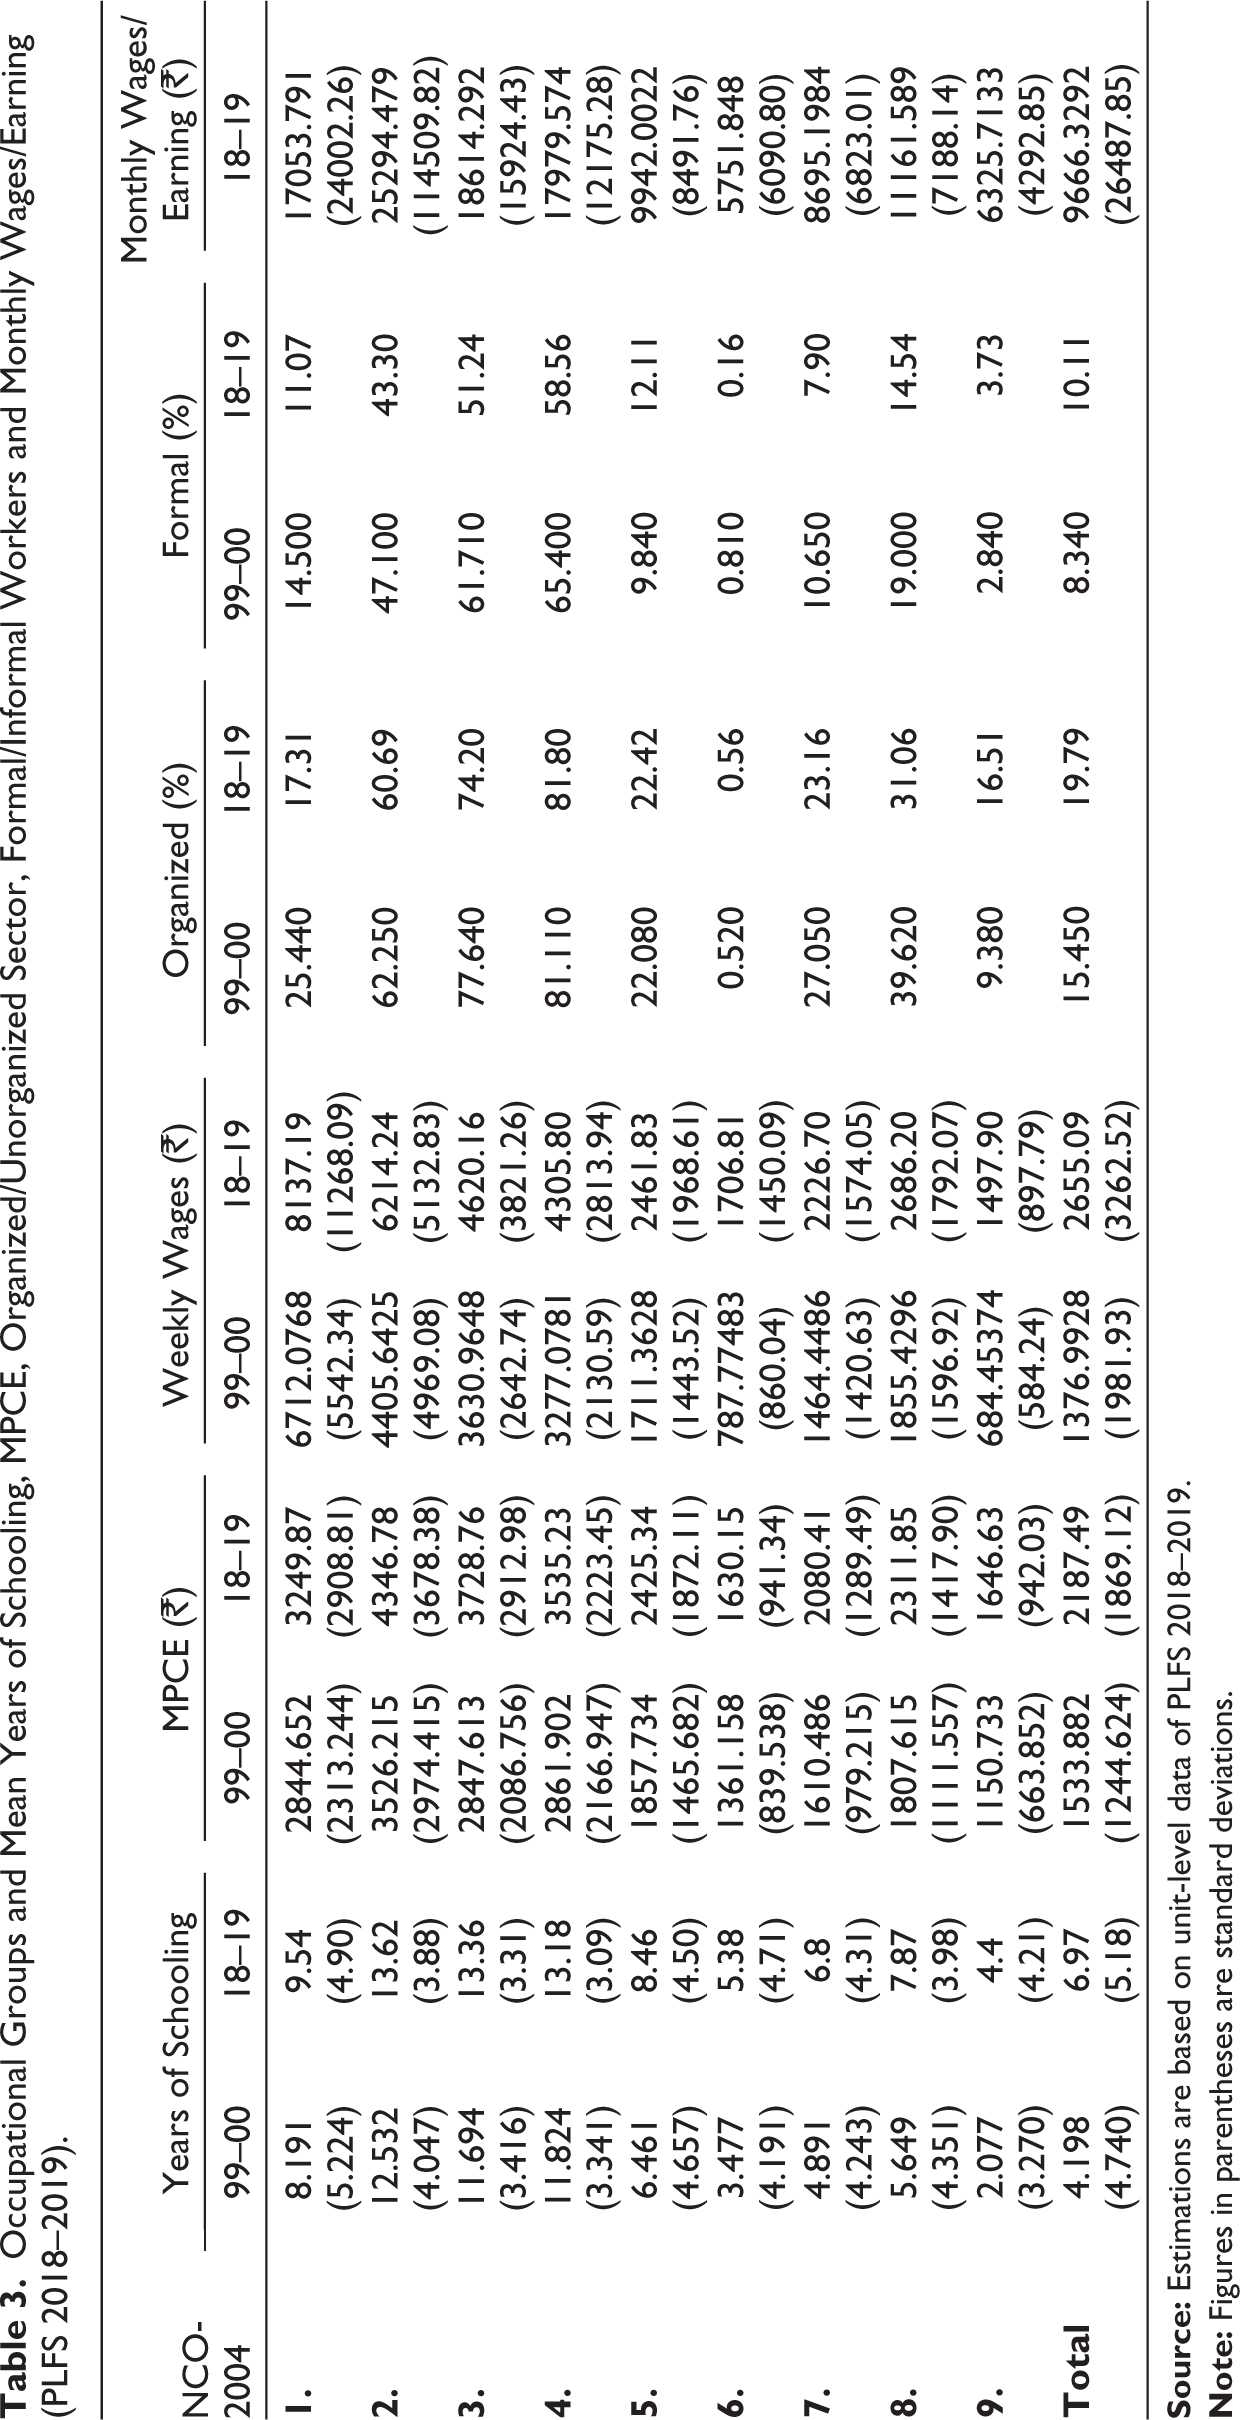
In addition to the provided educational qualifications, supplementary data has been collected regarding the nine-category occupational classification. This information encompasses various factors such as the actual educational achievements within each occupational group, the monthly per capita consumption expenditures of individuals in different occupations, the monthly wages and earnings, the categorization of enterprises as either organized or unorganized, and the proportion of formal and informal workers within each occupational group (Table 3). The National Commission on Enterprises in the Unorganized Sector (NCEUS) system, which the Government of India established in 2008, determines whether a job is formal or informal. 3 The first three occupations clearly outperform all other NCO divisions on all the compared indicators.
Occupational Groups and Mean Years of Schooling, MPCE, Organized/Unorganized Sector, Formal/Informal Workers and Monthly Wages/Earning (PLFS 2018–2019).
Occupational Distribution of Various Socio-religious Communities
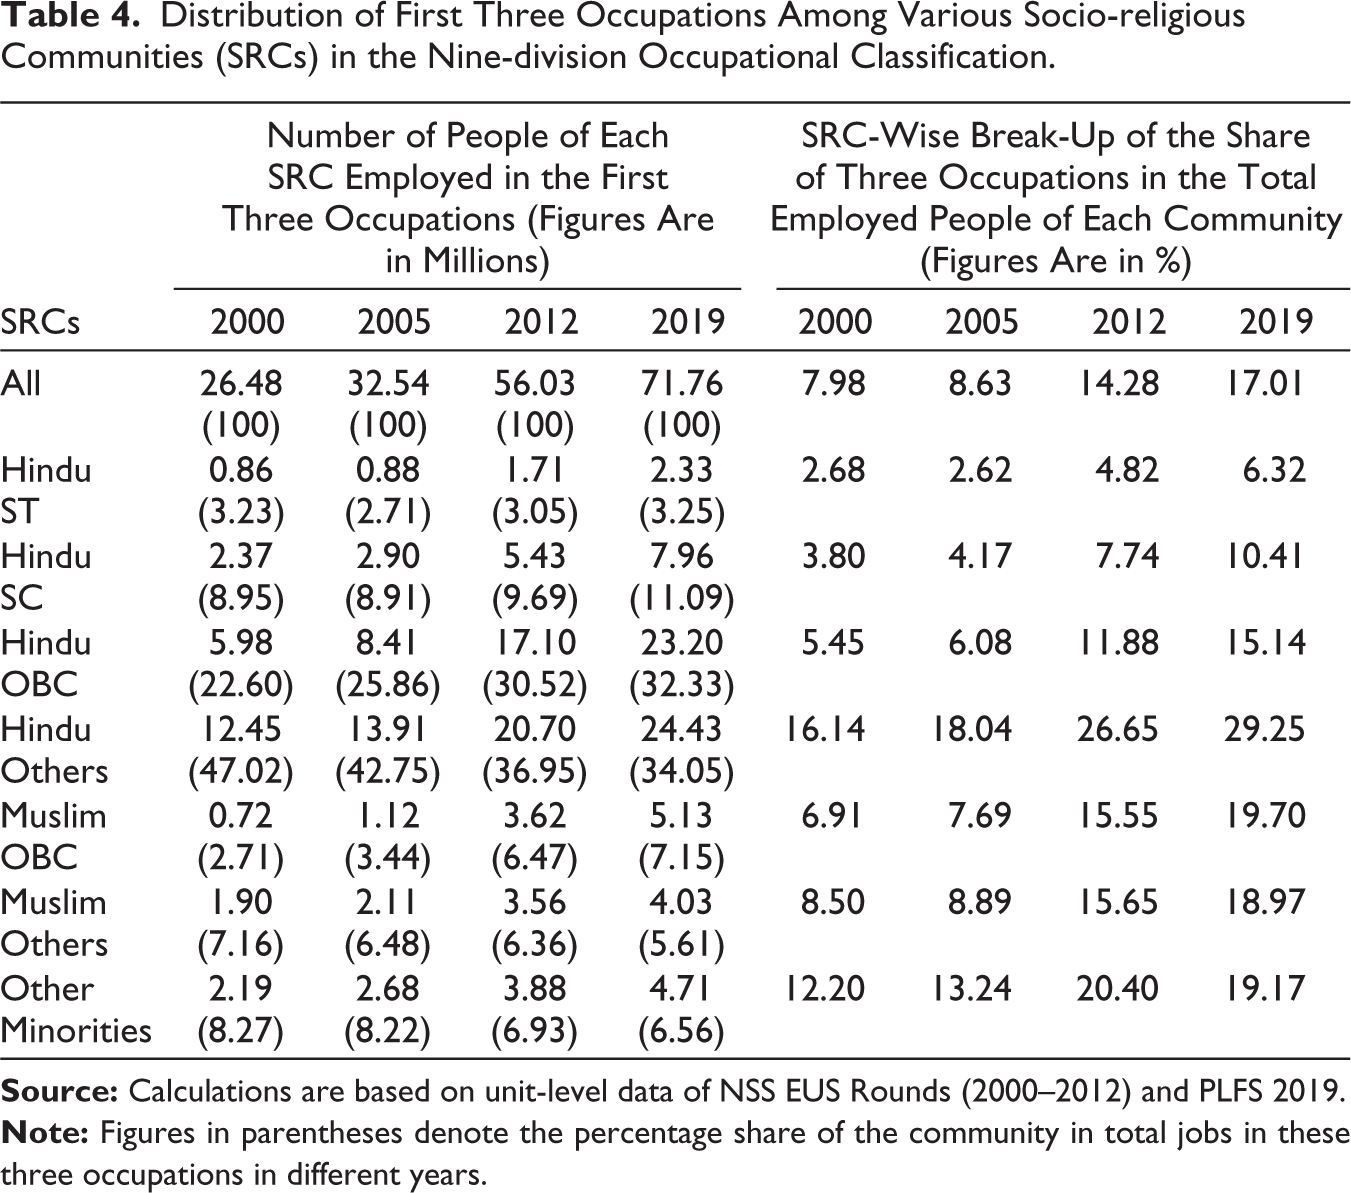
The first three jobs in the nine-division occupational classification are distributed among different SRCs, as shown in Table 4. Despite making up a small portion of all employment, these three occupational groups—which are regarded as being education- and skill-intensive—have shown sustained increases across the research period. For instance, the percentage of these three jobs climbed from 7.98% in 2000 to 17.01% by 2019. Additionally, even though there was not a great deal of job growth overall between 2012 and 2019, there was a slight increase in employment in these three occupational groupings. It should be noted that during the course of several years, the percentage of employment in these three professions—officials and managers (1); professionals (2); and associate professionals (3)—has changed dramatically. When we examine the three occupations as a group, we discover that the bulk of these jobs are shared by Hindu OBCs and Hindu Others. In 2019, they held 66.38% of the positions in these three occupations, down from 69.62% in 2000. Muslims OBCs are the other significant winners, increasing from 2.71% in 2000 to 7.15% in 2019, followed by Hindu SCs (from 8.95% in 2000 to 11.09% in 2019). The STs have also slightly improved, but Muslim Others have suffered. Every third individual in the Hindu Others group is employed in the first three occupations, as is evident from the information in Table 4 on those three jobs (29.25% share in 2019). People from the ST community are underrepresented in these fields, followed by SCs. Table 6 also demonstrates that all the communities have made inroads into these three occupations over the period of time. It is worth noting that other communities have advanced quickly even as Hindu Others continue to lead.
Distribution of First Three Occupations Among Various Socio-religious Communities (SRCs) in the Nine-division Occupational Classification.
The data on the remaining six occupations 4 reveal that in absolute and percentage terms, the skilled agriculture and allied (division 6) employ the largest workforce in the Indian labour market, followed by the elementary occupations (division 9). The percentage share of employment in both of these divisions decreased in 2019 compared to 2000. The largest decline in elementary occupations was reported by Hindu SCs (25.35%), followed by Hindu STs (16.85%), and Hindu OBCs (11.19%). If the question is asked, ‘If there are 100 workers employed in elementary occupations, what is the SRC-wise composition of them?’ Then the answer is that 31.48% of the labour supply in Division 9 comes from the OBC community, followed by 29.99% from the SC community, and 11.47% from the ST community. A considerable growth was observed in the cases of craft and related trades (57.38), plant and machine operators, service shop and market sales, and clerical jobs. A handful of ‘Hindu Other’ continued to work in skilled agriculture and fishing as their primary occupations from 2000 to 2019. Compared to manual labour employment, which was the second-most popular occupation in 2000, official and manager jobs, service jobs, and market sales are now the most popular occupations. The primary occupation of Muslim OBCs in every survey year was manual labour, which was followed by crafts and related trades. In a similar vein, Muslim Others continued to work as manual labourers in 2000. Regarding occupational distribution, the ‘Other minorities’ appear to outperform everyone else. About 27.74% of them work in agriculture and fishing, while 24.68% are employed in manual labour. However, when compared to 2000, both the overall percentage and the absolute share of manual labour significantly decreased in 2019. It suggests that people are shifting away from low-skilled manual labour jobs to middle-skilled jobs.
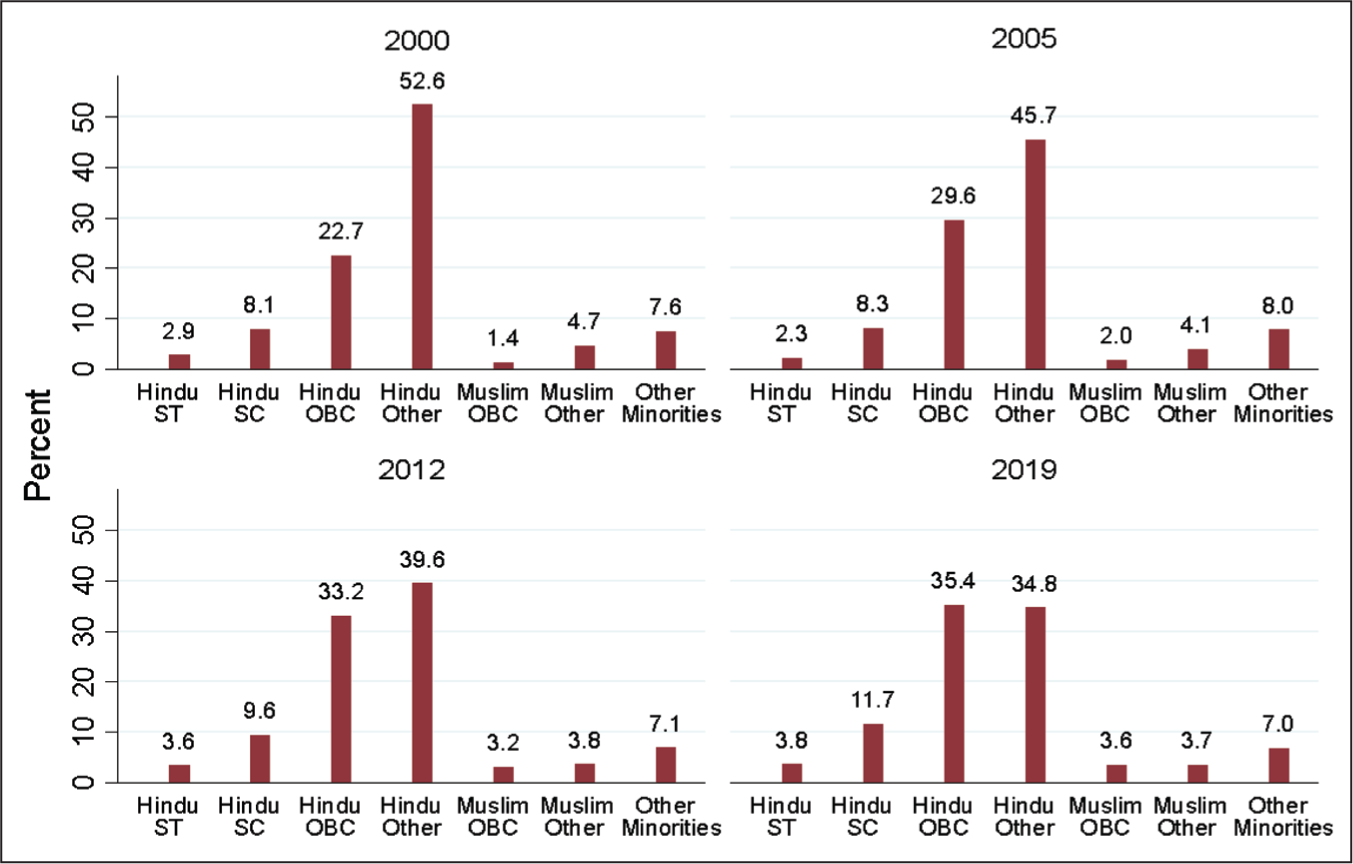
Figure 1 depicts the distribution of SRCs among the pool of workers who have completed 11 or more years of education. According to the data, 52.6% of 100 workers with 11 or more years of schooling are from the Hindu Other category, with Hindu OBC coming in second with 22.7% in the year 2000. However, by 2019, the numbers for Hindu OBCs and Hindu Others were nearly comparable. With the exception of these two SRCs, all other SRCs are underrepresented in the educated labour force. Surprisingly, SCs surpassed the 10% mark in 2019, comprising 11.7% of all workers with 11 or more years of school.
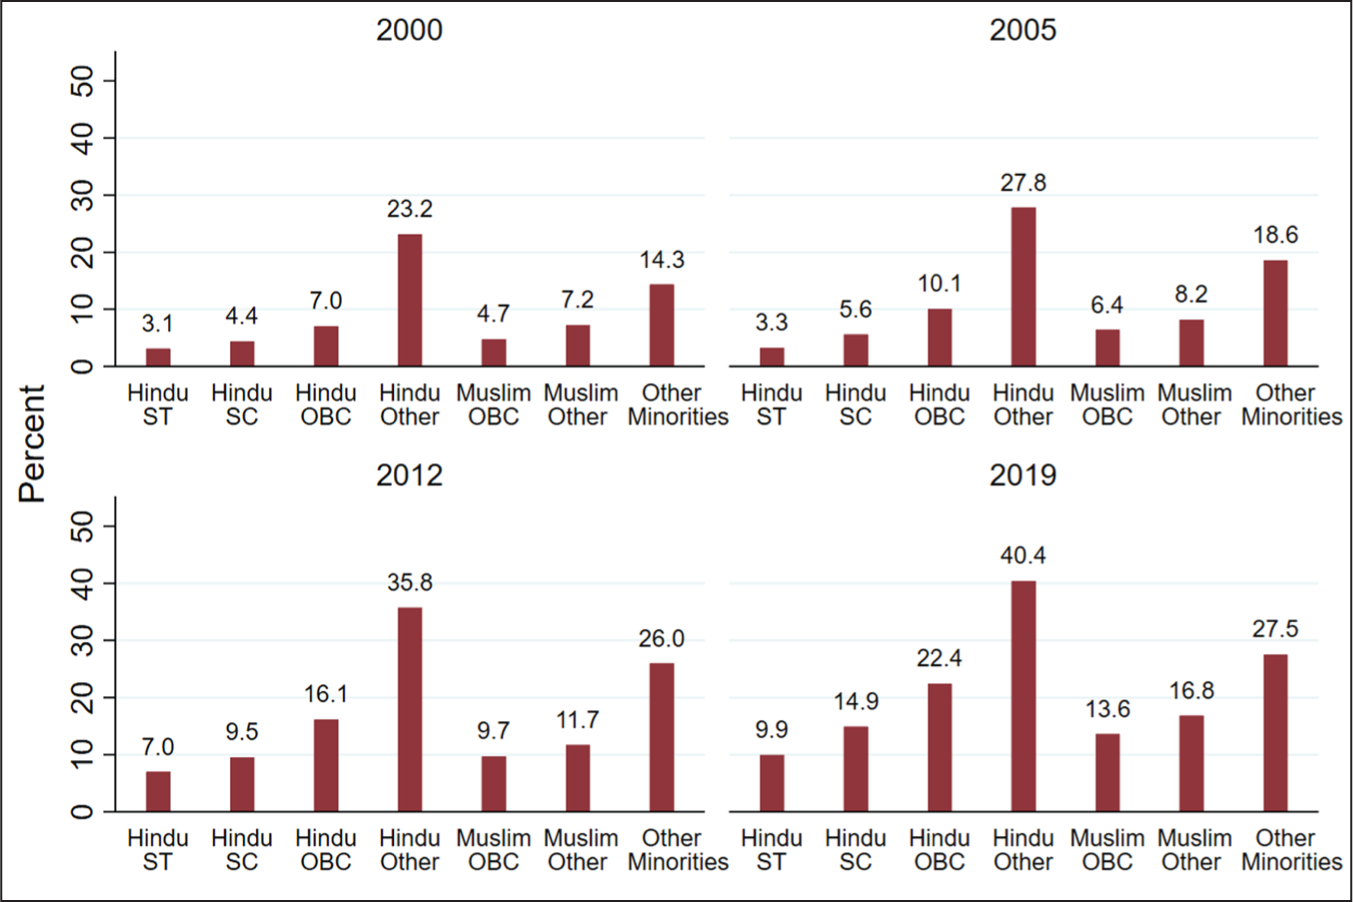
Figure 2 shows the distribution of workers with 11 or more years of schooling within each SRC. This graph depicts the proportion of workers with at least 11 years of education in each community out of a total of 100 workers in each community. The two largest communities in this area are Hindu Others and Other Minorities. The Hindu OBCs have improved as of 2019, with 22.04% of workers having completed post-secondary education or above. Nonetheless, the Hindu Others have made significant progress in improving their skills by 2019. At present, more than 40% of the workforce has completed postsecondary or higher education. Other groups, such as Muslims (OBC and Others) and SCs, have grown by about 10%. The ST community has reaped the least benefits; formerly, 3.1% of their workforce had a post-secondary degree; today, that percentage is 9.9%.
Section II
The Data and Empirical Specification
Data
The data for this study were derived from the National Sample Employment-Unemployment Survey (NSS EUS) quinquennial rounds 1999–2000 (55th), 2004–2005 (61st), 2011–2012 (68th), and 2018–2019 (PLFS), which are referred to as 2000, 2005, 2012, and 2019. The standard weight procedure has been applied in conjunction with the NSS estimation strategy (NSSO Sixty-Eighth Round Report, 2012, pp. 394–400). The employment status of individuals between the ages of 15 and 65 is determined using the concept of ‘Usual Principal Status’. This indicates the person’s level of engagement in work for the majority of the year prior to the survey date (NSS Sixty-Eighth Round Report 2012, p. 11). The entire population has been subdivided into religious and caste groups. Hindus have been subcategorized as Hindu STs, Hindu SCs, Hindu OBCs and Others. Similarly, Muslims are classified as Muslim OBCs and Muslim Others. Due to their limited numbers, Muslim SCs and STs are merged with Muslim OBCs. Christian, Buddhist, Sikh, and Jain are among the remaining groups listed as ‘Other Minorities’.
Data from multiple NSS rounds (55th in 2000, 61st in 2005 and 68th in 2012) and the PLFS (2019) were collected for the parental background analysis. This data includes sons between the ages of 15 and 45 who live and work alongside their fathers. A significant number of female family members were not included in this analysis as they had left their parents’ households after getting married and residing with their husbands (Azam, 2015). For each cross-section, there are the following numbers of father–son couples: NSS-2000 (34,794), NSS-2005 (37,853), NSS-2012 (25,704) and PLFS-2019 (19845). The descriptive statistics can be found in Table B1 of the online Appendix B.
Several researchers have utilized various surveys, including the IHDS, the National Family Health Survey (NFHS), and electoral data from the Centre for the Study of Developing Societies (CSDS), for father–son correlation analysis. Some studies employ co-resident samples such as NSS and NFHS (Emran & Shilpi, 2015; Jalan & Murgai, 2008; Reddy, 2015); others use IHDS, which combines co-resident and non-co-resident father–son pairs. Sons who do not live with their parents are more likely to have missing estimates due to co-resident bias. Estimates of father–son mobility, for example, are often low because a son with a strong education and a great deal of mobility are very likely to live away from home. Consequently, several researchers choose IHDS over NSS for mobility analyses (Asher et al., 2021; Azam, 2015). The second bias in the sample could result from problems with the life cycle. It is important to compare the occupational attainment of fathers and sons at the same stage of their respective life cycles. Due to the fact that the NSS records the father and son’s occupation information concurrently, it is conceivable that the father is nearing retirement age while the youth is just beginning his career. However, many part-timers make up the IHDS father–son sample used by various researchers (see Table A1). To investigate the occupational consequences of one generation relative to another, the occupation must be permanent and steady. The IHDS sample lacks information on this part, which in many cases has information on the son’s (and, in some situations, the father’s) employment on a part-time basis. A large portion of employment in developing nations is agriculture-related, and millions of employees switch seasonal jobs. The reported part-time employment may not be the actual labour market outcome for the son; he may possess or aspire to acquire other occupational skills that could reshape his occupational choice. This problem arises in the IHDS data due its data capturing process of part-time and full-time workers. Employees who put in more than 2000 hours and 150 days a year are regarded as full-time employees in the IHDS. On the other hand, part-time workers are defined as those who work more than 240 hours per year but less than 1800 hours per year (India Human Development Survey-II User Guide, 2011–2012, p. 19). In the case of part-time workers, we would never know whether it is their actual labour market outcome. Is that the primary skill and task he carries out for a longer period of time?
The one advantage of NSS data is its majority time criterion. The NSS’s UPS considers a person employed if they have spent the majority of the last 365 days in employment-related activities. Similarly, subsidiary status (USS) tracks work activity over the previous 30 days. In NSS, the same individual can be employed either on UPS or USS or on both statuses (if they pursue more than one working activity). In this case, we can easily focus on the UPS status reported by the person while excluding their USS status. If a person reports their UPS status, it means they are explicit in saying that it is their main activity. 5 In IHDS, if we focus only on full-time, we will be left with a small sample size.
Several IHDS-I- and IHDS-II-based studies on the occupational outcomes of sons in relation to their fathers failed to distinguish between full-time and part-time workers (Azam, 2015; Iversen et al., 2017; Motiram & Singh, 2012). These studies considered all those who worked over 240 hours. Notably, the success of neoclassical labour supply theory was attributable to the clear distinction it made between two decisions: the decision to enter the labour market and the decision to supply hours in the labour market. Consequently, the distinction between part-time and full-time employees is critical and must not be overlooked. This issue is exacerbated in surveys collected for different purposes, such as the CSDS’ election response survey. Only occupational information is recorded in such surveys, with no additional information such as working hours or wages or earnings. Vaid (2018) produces statistics on structural occupational mobility based on CSDS’ electoral choice data. However, structural mobility in developing countries is closely associated with the exodus of workers from agriculture. Many agricultural labourers work on a seasonal or part-time basis. These workers may have acquired other skills and spent time doing different jobs. In the absence of various employment-related information, such as time spent on each activity, estimating people’s actual labour market outcomes is challenging. Thus, the CSDS-based estimates are not ideal for labour market outcomes.
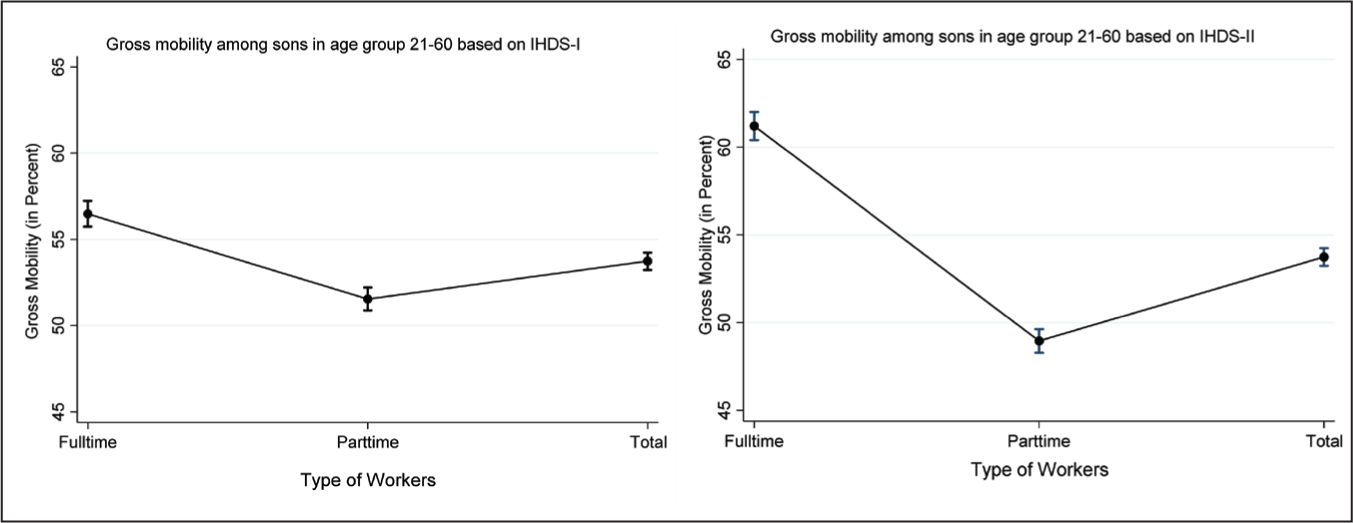
Coming back to the IHDS, Figure 3 illustrates the gross mobility rates 6 based on the IHDS-I for the age group (21–60) and occupational categorization used in Azam (2015). The gross mobility rates for part-time and full-time workers were estimated separately. It can be observed that the mobility estimates for part-time and full-time workers differ, with a four-point difference. Azam’s (2015) gross mobility estimates barely cross the three-percentage-point threshold for all cohorts considered in the study. As a result, what Azam (2015) found in terms of mobility progress is easy to understand if one divides workers into two groups: those who work part-time and those who work full-time. Similarly, we have produced mobility estimates for the age group 21–60 based on IHDS-II data using categorization applied by a couple of studies (Iversen et al., 2017; Iversen, 2021; Kundu & Sen, 2022). In this case, the full-time and part-time classifications result in a difference of more than 10 points (Figure 3a and 3b).
Regarding co-residency bias, all major studies are based on IHDS, NFHS and NSS have either a partial or complete co-resident sample. Household survey-based estimates show no clear evidence of the magnitude of co-resident bias (Emran & Shilpi, 2019). Emran and Shilpi (2015) find that the impact of co-resident bias in leading to underestimation of educational mobility depends on mobility measures. On the other hand, Shariq Mohammed (2019) reported that in rural areas, grown-up children are more likely to stay in their parental homes if the economic conditions are good. The work of Doruk et al. (2022) for developing countries like Panama and Brazil demonstrated that the co-resident bias has little impact on mobility estimates. The question now is how similar the father–son mobility sample is to the overall sample (all male employees in the age range of 15–45), given that there is mixed evidence about the co-residency bias. For this, we have compared the mobility samples’ occupational–educational attainment, average age, and rural–urban distribution with the full samples’ figures on similar indicators in the same age group (15–45) (see Figures A1–A4). Looking at the frequencies of the full sample and father–son sample, there is overlapping in multiple cases and almost no difference between the two samples. However, as mentioned earlier, IHDS estimates based on cutting between full-time and part-time workers vary widely.
Sons in the age group 15–45 who are working and not in school at the time of the survey on the principal’s status are part of the mobility sample. This justifies the minimum age of 15 for the sample. If the son has already graduated from high school and is working full-time, he should be included in the sample regardless of his age. For example, between the ages of 15 and 19, there is a labour-force participation rate in the range of 4% to 5% (Dev & Venkatanarayana, 2011). As a result, early labour force participation and school dropout are common, especially among rural and Muslim households (Sanghi & Srija, 2014). Excluding these individuals who dropped out and selecting a different minimum age (such as individuals aged 21 and above) would introduce bias. In this scenario, we would overlook a substantial and representative subset of the sample. By excluding dropouts from the analysis, we also miss out on a potential contributor to occupational immobility (Ahmed & Nauriyal, 2023). The age requirement of at least 15 years old does not pose an issue in the context of educational mobility, as the focus is solely on individuals who are employed and have finished their education (Brunetti & Fiaschi, 2023). To counteract the influence of the life cycle, the selection of fathers and sons was limited to a maximum age of 45 years (Anti et al., 2012). Nevertheless, potential biases related to age are of lesser significance since occupations that are broadly defined are less likely to change significantly throughout a person’s lifetime compared to income (Blanden, 2013).
Empirical Specification
The discrete choice model is applied here to examine the factors influencing the sons’ occupational and educational achievements. This study also accounts for various socio-religious groups in order to strengthen our understanding of the difference in outcomes among different SRCs. One way is to estimate the logit equation for each SRC separately and compare the results. Another way is to introduce an interaction term of SRC with the variable of interest. This study accounts for the binary choice of the variable on the left-hand side of the equation. In the case of occupation, the binary choice is whether the son entered the first three occupations, which can be termed ‘decent jobs’ (officials and managers, professionals, and associate professionals) or not. 7 In the case of educational attainment, the binary choice is whether the son has attained at least senior secondary level education or greater than secondary education (equivalent to 11 years of education) or not. The predicted probabilities have been calculated from the logit equations 1, 2 and 3.
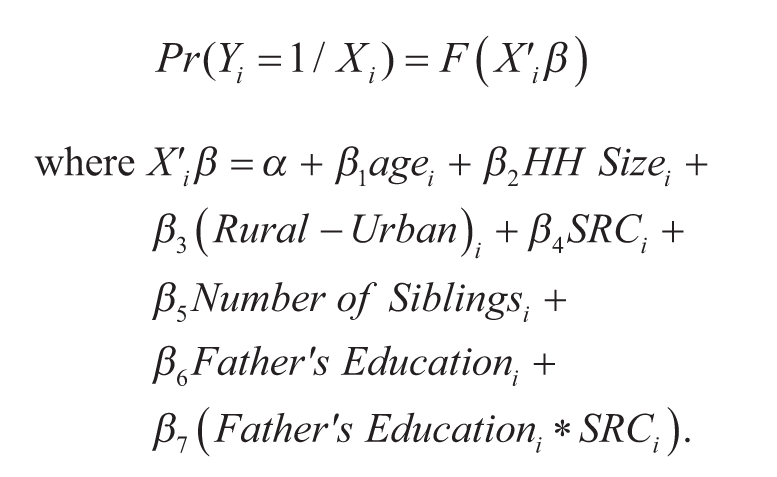
For occupational attainment, the construct given below is followed:
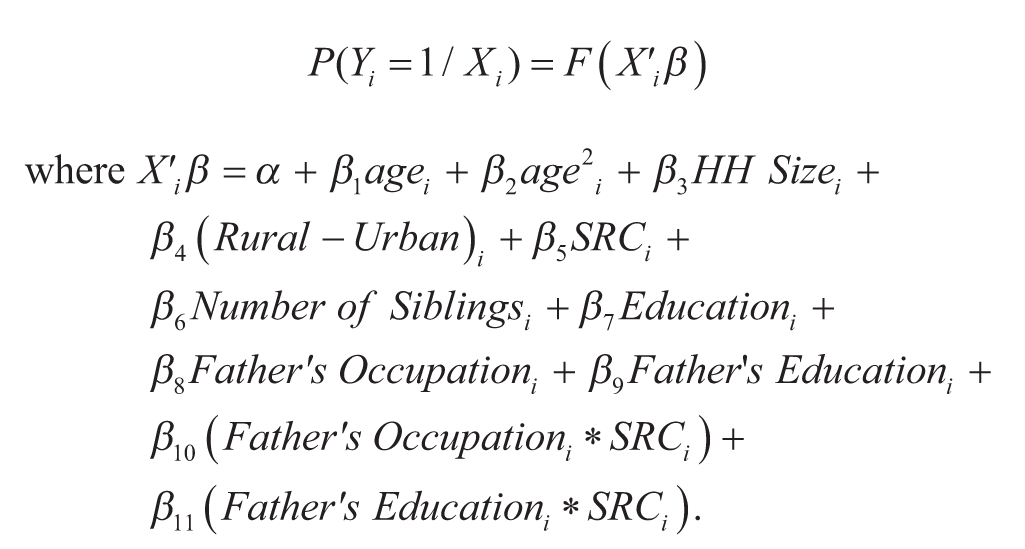
Here, Yi is the nominal dependent variable where 1 stands for the son employed in the decent jobs (first three occupations, namely Officials and Managers, Professionals, Associate Professionals), and 0 otherwise.
xi represents variables such as age, age-squared, education of individual i, father’s occupation, father’s education, household size, SRCs, number of siblings and a dummy variable for rural–urban.
Two interaction terms have been added to capture variation in the impact of the father’s education and occupation among different SRCs. To make the logit equation more understandable, Fathers’ nine-division occupational categories were further subdivided into the following six categories: category I (divisions 1–3); category II (division 4); category III (division 5); category IV (division 6); category V (divisions 7–8); and category VI (division 9). The father’s and son’s educational attainment is clubbed into six educational categories: no formal education, up to and including primary, middle, secondary, senior secondary, graduation, and above. In the logit equation, the SCs and STs, which are two categories in the NSS data, have been merged to form one to improve the sample size. For the same reason, ‘Muslims OBC’ and ‘Muslim Others’ are all grouped as ‘Muslims’. Hence, in the regression analysis term, SRC includes the following groups: ST/SC, Hindu OBC, Hindu Other, Muslims, and Other Minorities.
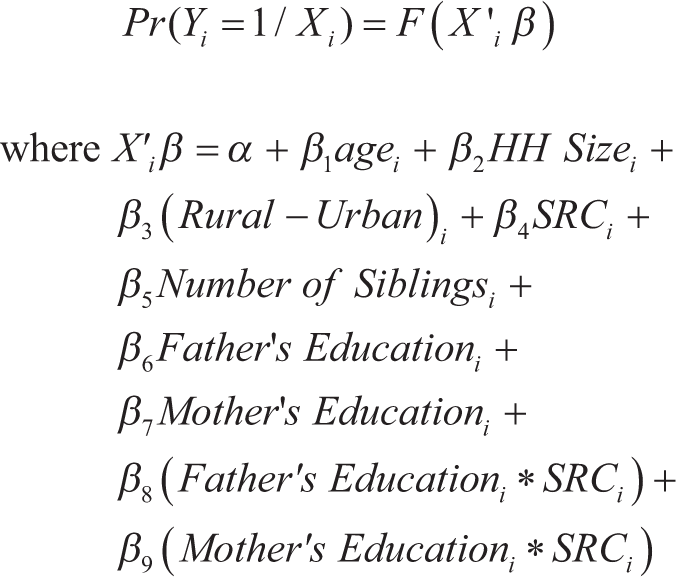
For educational attainment, we obtain the following:
Here, Yi is the nominal dependent variable where 1 represents if the son has moved or stayed in higher education (greater than secondary education), 0 otherwise.
xi represents variables, namely age, fathers’ education, household size, SRCs, number of siblings and a dummy for the rural–urban. An interaction term has been added to capture variation in the impact of fathers’ education among different SRCs.
The mother’s education is an important variable in the educational attainment of her sons. However, this variable is uncommon in the scientific literature due to sample size issues and assortative marriages. The average education of parents, the maximum education of either parent, and the father’s education have been frequently used as proxies for parental education rather than the mother’s education (Funjika & Getachew, 2022). In the present analysis, we estimate a separate equation (3) that includes the mother’s education and the father’s levels of education, with the son’s educational attainment serving as the outcome variable. Despite reservations, a good number of studies put father and mother’s education in a single equation. Following the logit equation, the mother’s education and interaction with SRC have been added. There are the same six educational categories for mothers as there were for fathers.
Section III
Logit Results
Occupational Attainment and Father’s Occupation
The impact of the father’s occupation on the son’s occupational attainment is presented in Figure 4 in the form of predicted probabilities with 95% confidence intervals based on logit equation 1. In the estimation of all three equations, the error terms are clustered at the district level to avoid the correlation of error terms. This finding suggests that the SC/ST has the least predicted probability of attaining the first three occupations (officials and managers; professionals and associate professionals) even if the father works in a similar group of occupations. In this case, Hindu Others have the highest probabilities. These results hold true throughout all survey years. In the years 2000 and 2005, Muslims had better predicted probabilities of attaining jobs in the first three occupations (with fathers working in similar occupations) compared to Hindu OBCs. However, in 2012, Hindu OBCs outpaced Muslims, as the latter experienced a significant decline in the predicted likelihood of securing employment in the first three occupations. In 2012 and 2019, the predicted probabilities for Muslims were marginally better than those for SC and ST.
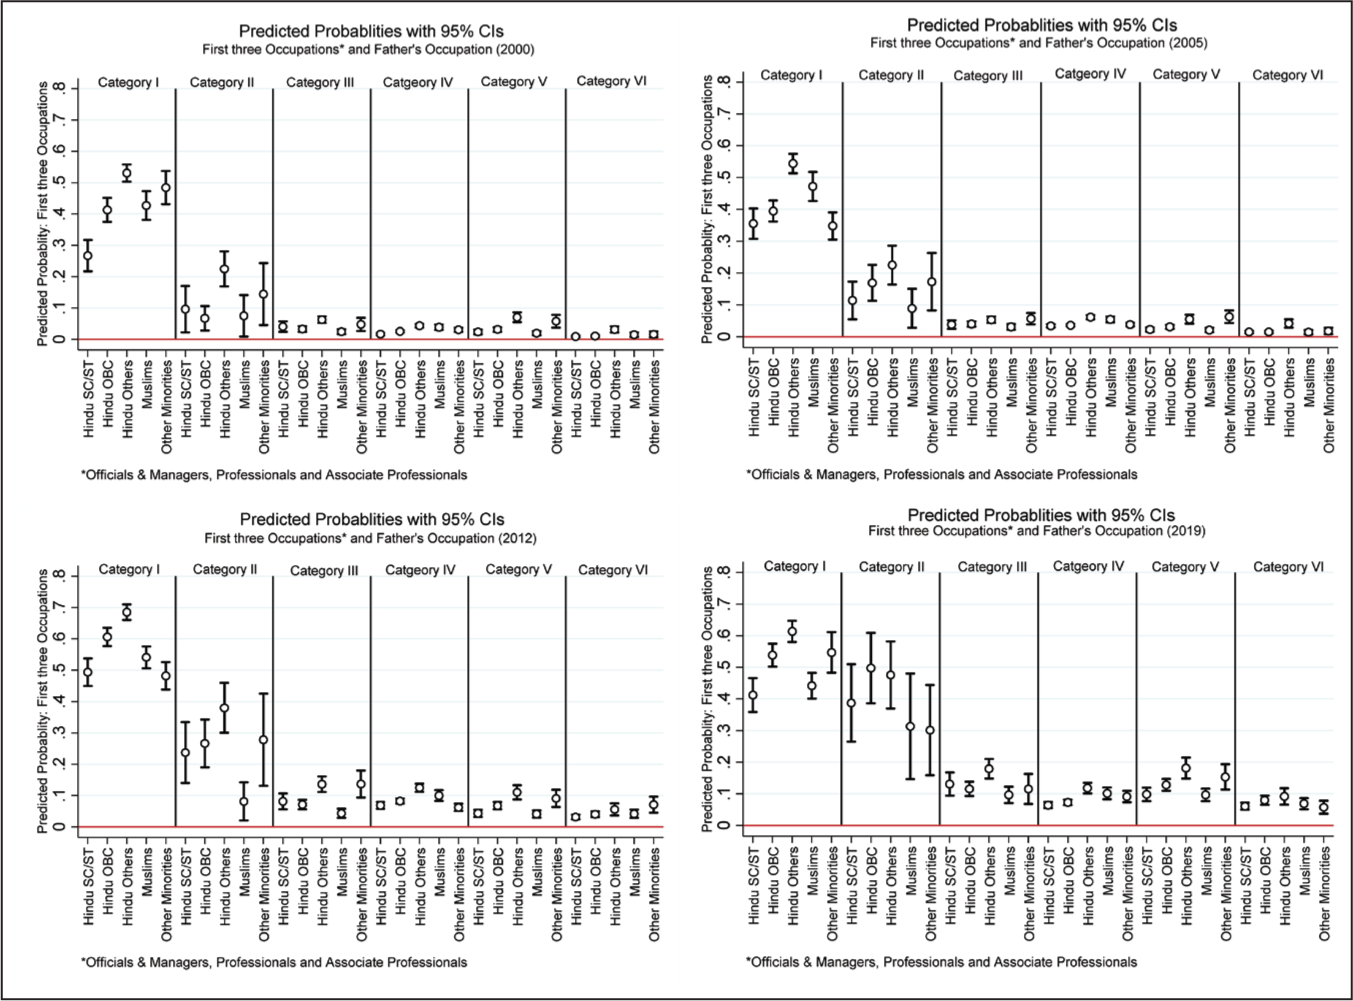
For all survey years and all SRCs, the highest chance of entering these occupations remains with the sons whose fathers are already employed in these occupations. The sons of clerks provide the second highest labour supply in the first three occupations. In this case, Hindu OBCs and Hindu Others have further advantages compared to other SRCs. There is limited access to the first three occupations for the sons of fathers who are employed in Category III, IV, V, and VI occupations. This fact applies more to the sons of SC/ST, OBC, Muslims, and Other Minorities. Still, the advantage of Hindu Others, in this case, is minimal. These findings speak volumes about the persisting inequality in society. The sons entirely access decision-making and well-paid jobs with parental backgrounds in similar occupations. A large working population who belonged to families in trade and market sales, agriculture, craft and related work, plant and machine operators, and labourers remained outside. To go even further, Muslim and Hindu Other sons are more likely to work in the first three jobs than members of other SRCs when the father’s occupation is considered in category IV. Hindu OBC sons and Hindu Others had a higher likelihood of working in the first three jobs than other SRCs when the father’s profession is taken into account in category V. Specifically, along with Hindu Others, Muslims have an advantage in father’s category IV, and Hindu OBCs have an advantage in father’s category V. While SC/STs do not share the same advantages in this context.
Occupational Attainment and Father’s Education
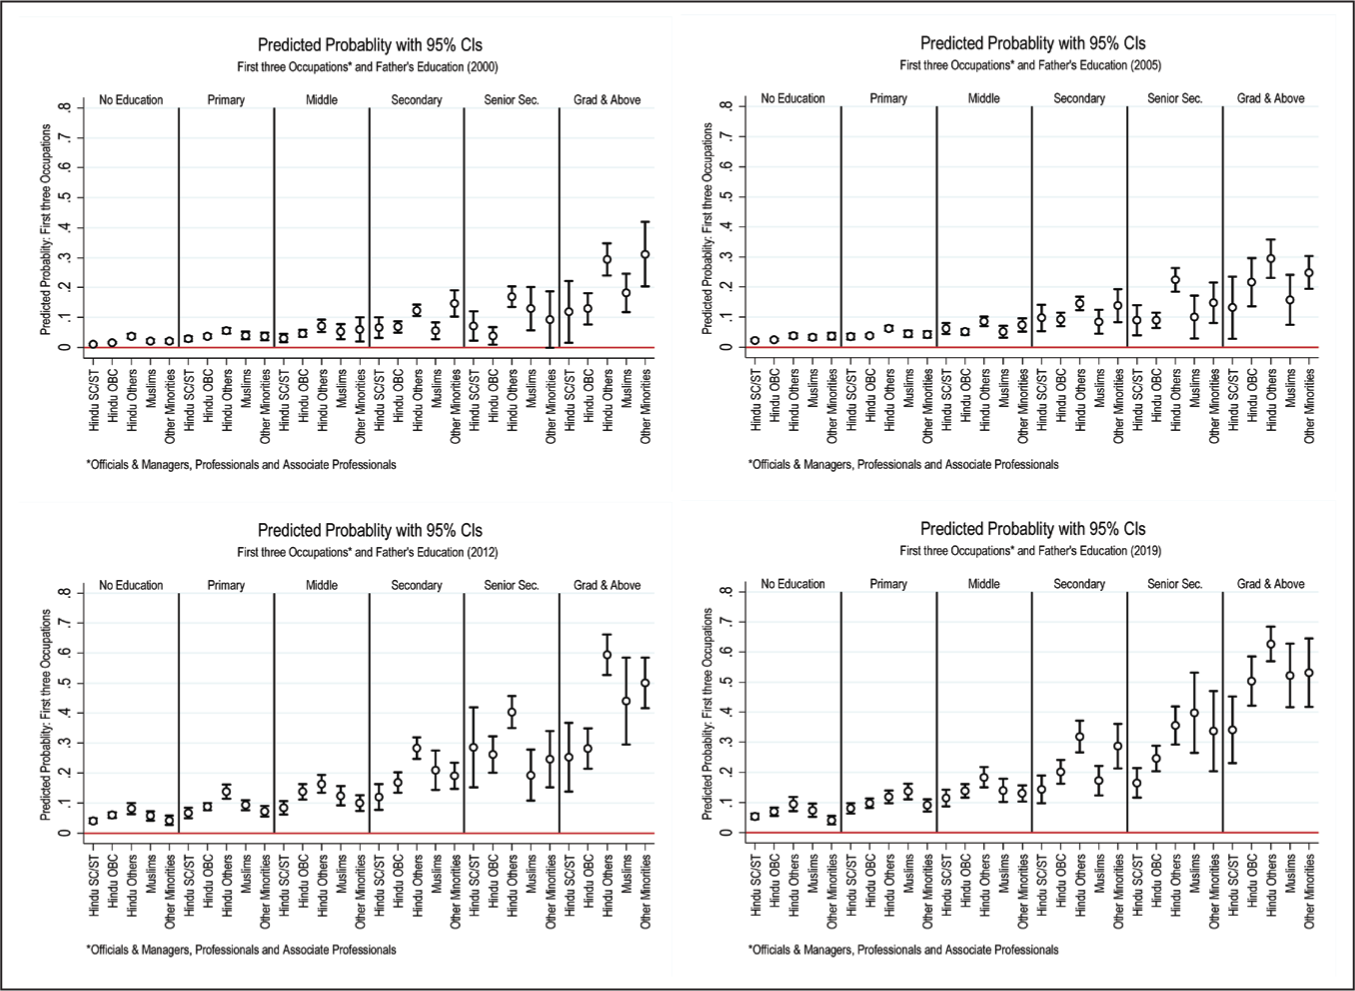
The co-resident son’s chance of entering three occupations (Official and Managers, Professionals, Associate Professionals) increases with the father’s educational attainment (Figure 5). Between 2000 and 2005, however, the advantage of being the son of a secondary, senior secondary, graduate, or above-graduate father was limited to Hindus and other minorities. By 2012 and 2019, the sons of up-to-middle-level educated fathers had improved their chances of entering the three occupations. Within the community, inequality can also be traced from Figure 5, as there is a difference between a son of Hindu Others where the father is with up to senior secondary education and a son of Hindu Others where the father is with graduation and above education. Between 2012 and 2019, the gap between these two groups widened. In 2000 and 2005, there were no major variations in the probabilities across all levels of a father’s education and all SRCs. The divergence became evident in 2012; however, there has been limited progress in enhancing the prospects of sons whose fathers have no formal education or possess primary, middle, and secondary education. This disparity serves as a stark reminder of the prevailing inequality within our society.
Educational Attainment and Father’s Education
Estimates based on equation 2 (see Figure 6) indicate how the son’s higher educational attainment is directly related to the father’s higher educational attainment. The disparities in educational achievement, here at the senior secondary level and beyond, can be examined through two distinct lenses. Firstly, there is a persistent overarching inequality across various socio-religious backgrounds (SRCs). Secondly, the disparities between these SRCs continue to persist, further exacerbating the overall inequality in educational attainment. The overall inequality is so high that it can be understood from Figure 6 that the attainment of 11 or more years of education is strictly limited to the sons who have fathers with a similar level of education. There is some decline in this type of inequality, but the reduction is not so impressive. Only sons of fathers with senior secondary and graduate, and higher education had the opportunity to receive 11 or more years of education in 2000. By 2019, the likelihood of sons of fathers with up to a middle and secondary education had increased. This could be interpreted as a result of societal educational expansion. Still, the sons of illiterate and up-to-primary-education fathers have relatively lower access to 11 or more years of education compared to other educational categories of fathers. These findings show that educational expansion is not benefiting society equally. The gap between sons with fathers with graduate and above levels of education and sons with fathers who are either illiterate or have only obtained primary or middle-level education remains large.
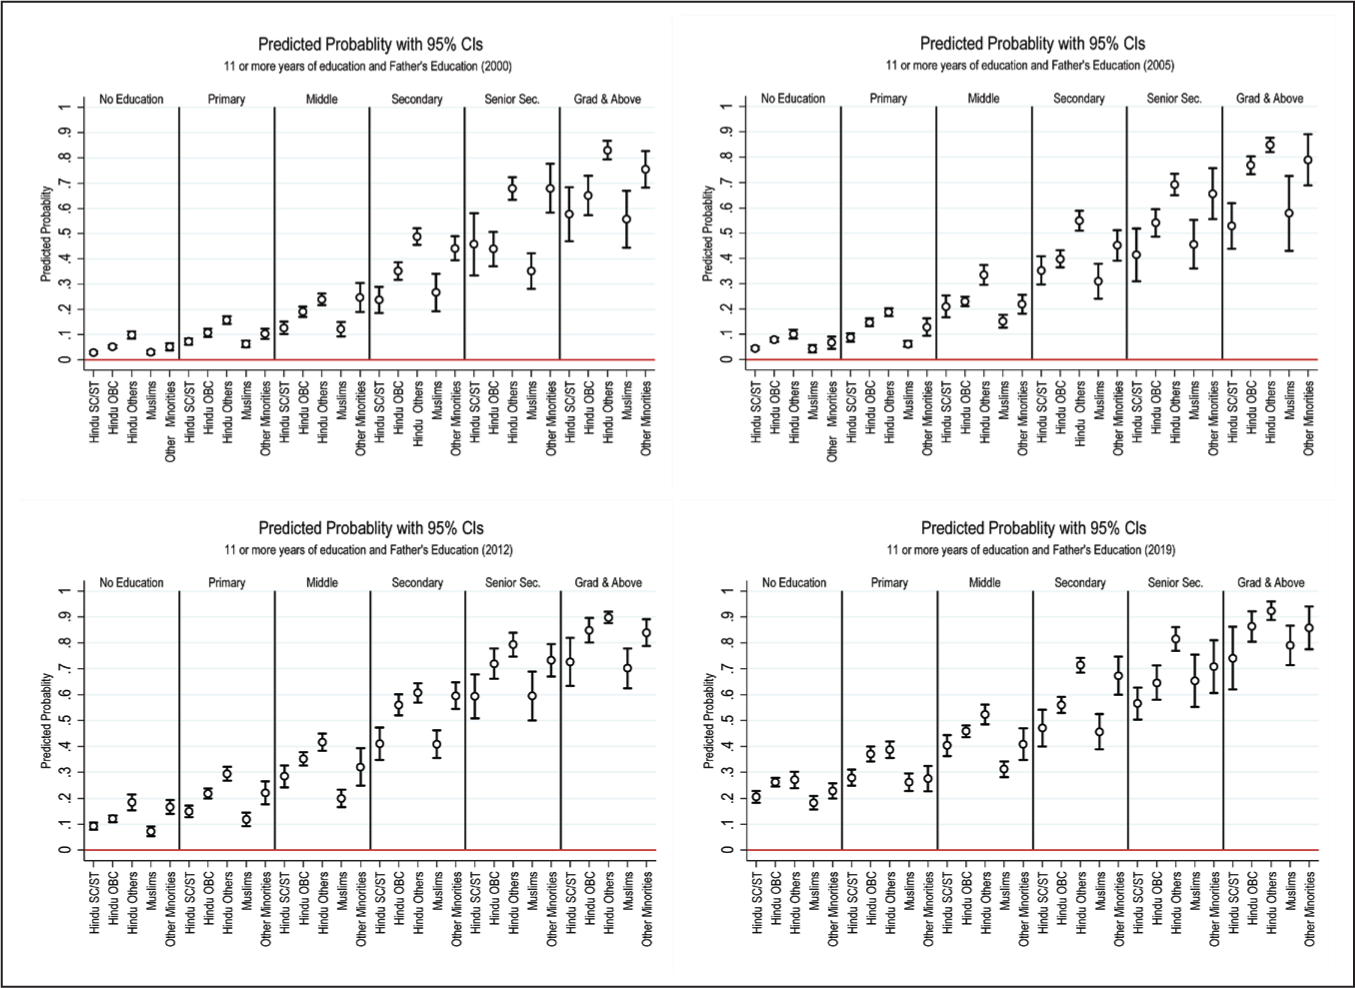
Among the SRCs, the inequality is evident in the fact that Hindu Other sons can achieve 11 or more years of education with fathers who have up to a middle-level education, while SC/ST sons struggle to achieve the same, even if their fathers have up to a secondary-level education. In the case of Muslims, the probability of attaining 11 or more years of education with an educated father up to senior secondary level is lower compared to Hindu Others with an educated father up to secondary level. These findings confirm earlier conclusions by Sinha (2018) regarding STs and SCs and Asher et al. (2021) regarding Muslims. From 2000 to 2019, all communities have made progress, with increased chances of obtaining 11 or more years of education. However, the hierarchical pattern remains largely intact, with Hindu Others at the top and SCs and STs at the bottom. Hindu OBCs have made remarkable gains and closely follow Hindu Others for each level of their father’s education, particularly up to secondary school, up to senior secondary school, and graduate and above.
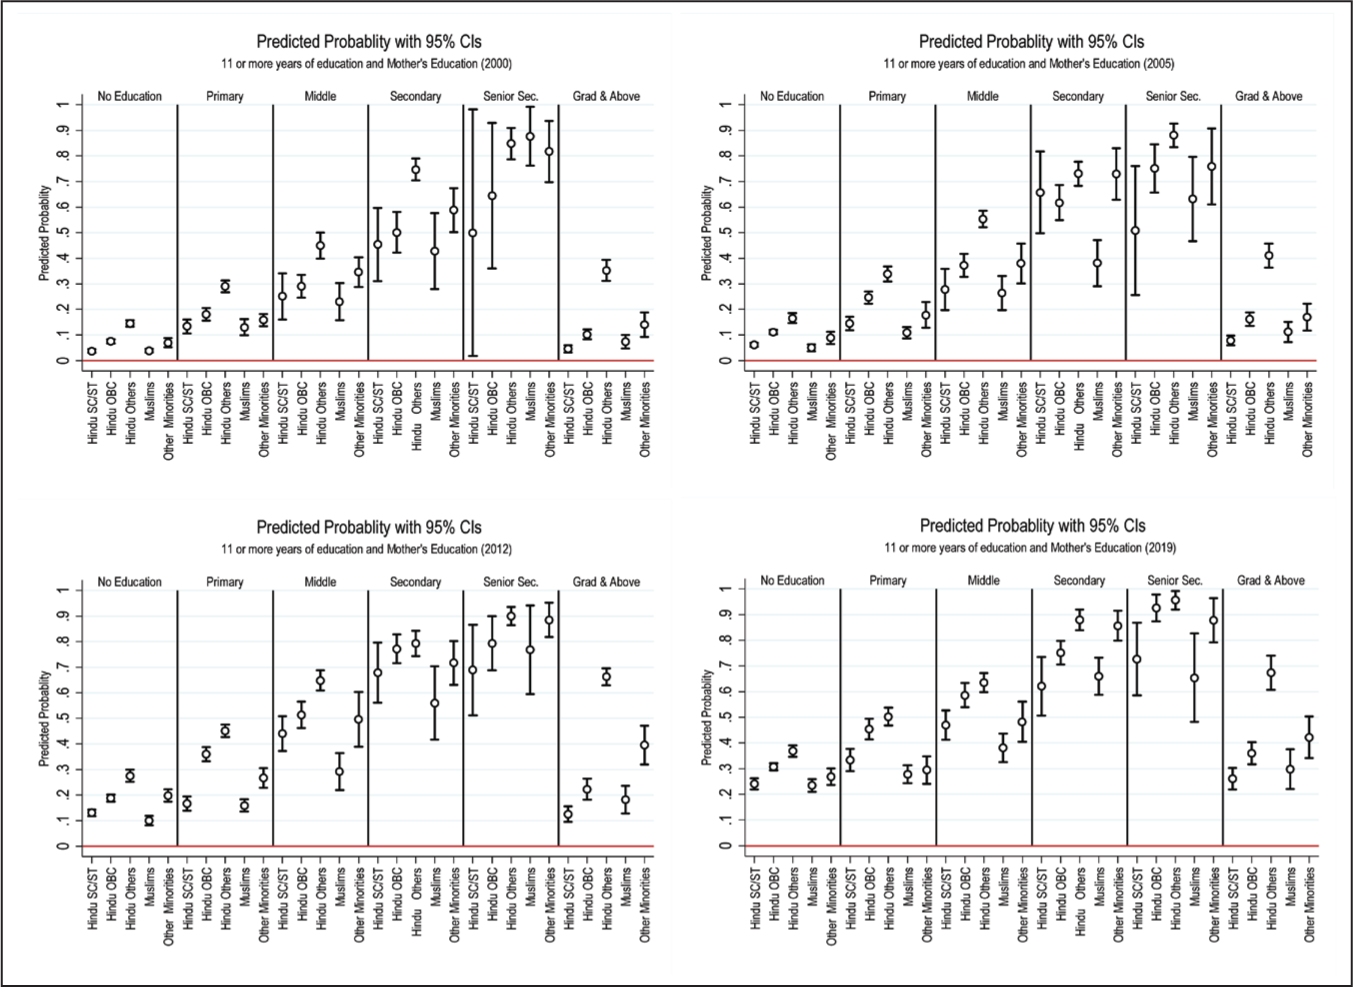
Educational Attainment and Mother’s Education
Based on equation 3, Figure 7 depicts the predicted probabilities of the co-residing son’s educational attainment given the different levels of the mother’s education. Compared to the father, the mother’s education in categories up to secondary, up to senior secondary, and graduate and above are low. As a result, the son’s educational attainment in these categories of his mother’s schooling appears with higher confidence intervals. Figure 7 indicates that, up to senior secondary education, a son is more likely to receive 11 or more years of schooling if his mother has a higher level of education. In this case, also Hindu Others have the advantage compared to other SRCs. Figure 7 demonstrates that the predicted probabilities in the mother’s education category of graduate and above are low compared to up to the middle, up to secondary, and up to senior secondary. Since there are not many women in the category of graduates and above, estimations for this group should be treated with caution.
Tables B9 to B11 of the online repository linked to this publication list the specific results for occupational attainment (based on logit equation 1) and educational attainment (based on logit equations 2 and 3).
Discussion
The occupational structure of economies changes at different stages of economic growth. These significant changes also have an impact on occupational distribution, wage structures, and the demand for and supply of various types of labour (Banerjee & Newman, 1993). Similarly, extensive restructuring of the labour market and industrial processes alters asset and wealth distribution. The findings of the present study indicate that there is a severe disparity between the levels of a father’s occupation and securing of jobs in three occupations (officials and managers, professionals, and associate professionals). Furthermore, access to employment in these occupations inside SRCs has remained consistently unequal throughout the research period. As was already noted, the assets a family acquires and accumulates over time are governed by uneven engagement in advantageous positions. This asset imbalance further impacts social networks, residence preferences, and financial support for the next generation’s education. Little to no investment in the next generation’s education is guaranteed by the lack of assets and easily accessible credit due to an imperfect credit market (Banerjee & Newman, 1993).
Especially when credit is unavailable, land inheritance becomes more important to the intergenerational transmission of inequality (Huang, 2013). The selection of economic activity and the diversification strategy into non-farm jobs depends on land availability and size (Ahmed & Nauriyal, 2023; Lambert et al., 2014). The challenges faced by the landless class and marginal farmers hinder their ability to invest in quality education and transition to more respectable occupations due to financial constraints (Bauder, 2002; Corcoran et al., 1989; Jencks & Mayer, 1990). As a result, these circumstances foster residential segregation, perpetuate poverty, and hinder the development of strong social connections. This absence of positive role models further exacerbates the issue by lacking individuals who can inspire and motivate children (Anderberg & Andersson, 2007). Furthermore, a peer group effect emerges where the educational underachievement of some students negatively impacts the learning environment for others (Solon et al., 2000). Individuals’ life objectives, educational outcomes, and level of skill development are impacted by the social capital they obtain as a result of their family’s reputation and connections (Becker & Tomes, 1979). Chetty et al. (2014) aptly summarized all such factors and argued that intergenerational mobility is strongly correlated with the following factors: (a) residential segregation; (b) income inequality; (c) school quality; and (d) family structure. The hypotheses discussed above might be used to explain why STs, SCs, and Muslims, in particular, endure occupational and educational disparities in India. Certain findings, particularly those concerning education, are noteworthy. That, even in well-educated families with graduates and above level of parental education, Muslim and ST/SC boys have a lower likelihood of finishing 11 or more years of education than Hindu Others and Hindu OBCs. For all levels of their father’s education, OBCs were either on par with or slightly behind the Hindu Others by 2019. Muslims, STs, and SCs have not had the same degree of improvement.
As far as Muslim educational backwardness is concerned, the literature cites three reasons for these deficits: perceived discrimination, religion–cultural ethos, and overall poor socio-economic conditions (Alam, 2012). Some researchers believe religion offers a pattern of belief systems, prescribes values, norms, and attitudes, and establishes behaviours and life orientations that individuals share in groups (Jayaram, 1990). This idea is used to explain why Muslims have a literacy issue. A substantial corpus of studies on education among Muslims delves beyond religious and cultural considerations (Hasan, 2015; Shaban, 2012; Shariff & Razzack, 2006). 8 In several studies on this subject, the hypotheses of low income, perceived prejudice, and low expectations have also been put forth (Alam & Raju, 2007). Notably, a sizable proportion of the Muslim population in India comprises backward and extremely backward caste groups (Gandhi Kingdon, 2002). Similarly, because of the partition of India, Muslim families with substantially higher incomes left the nation and relocated to the newly carved-out nation of Pakistan in 1947 (Puri, 1993). Thus, a social stratum is missing among India’s Muslims for those who can exploit education and seek employment in white-collar and government services (Ahmad, 1981). This provides impetus for the intergenerational approach, and the current work examines how the low educational attainment of Muslims is reflected across generations. This leaves us with another plausible hypothesis about parental involvement, especially when children from well-educated households have educational deficits.
The study’s findings indicate a preponderance of immobility in Indian society. Sons of well-educated and employed individuals in the first three occupational categories strive to uphold their social and economic status. Sons of less educated and employed individuals in categories II to VI, on the other hand, encounter challenges in gaining access to higher education and securing employment in the top three occupations. Both of these scenarios exemplify patterns of immobility. However, concerning occupational attainment in the first three categories, the association between sons and their fathers’ occupations weakened in 2019. Moreover, sons of clerks have shown progress in securing jobs in category I occupations. Nonetheless, such encouraging examples are uncommon in particular socio-religious societies.
These findings on immobility appear to be at odds with the increased mobility that some researchers have reported (Hnatkovska et al., 2013; Iversen et al., 2017). Although total mobility, that is, outward movement from the parental class, has increased in society over the past three decades, mobility towards well-paying jobs and higher education is still relatively low. Hnatkovska et al. (2013) found poor mobility towards white-collar jobs from skilled and unskilled occupations, particularly among non-SC/ST (0.07 and 0.04) and SC/STs (0.04 and 0.03). They also reported low probabilities of upward movement in education levels among the sons of illiterate, primary, and middle-level educated fathers. Similarly, using IHDS-2011–12 data, Iversen et al. (2017) observed relatively limited mobility from agricultural and other labourers, lower skilled occupations to higher skilled occupations, and other occupations towards higher professional categories. Although some studies have reported upward mobility in education (Kundu & Sen, 2022; Sinha, 2018), it is important to clarify that upward mobility in schooling does not equate to mobility towards higher education. In many studies, upward mobility is defined as the progression into higher categories, even if it involves only one category shift, for example, from illiterate to primary level.
One consistent finding in the literature is that occupational mobility is significantly lower than educational mobility (Torche, 2021, p. 155). However, it is important to note that such conclusions are based on an inappropriate comparison. For instance, the difficulties involved in transitioning from middle to secondary education or from secondary to higher secondary education are not comparable to those encountered when moving from the labourers class to skilled occupations or from skilled occupations to higher administrative and professional occupations. The total mobility score would be higher in the first scenario. However, it is important to remember that total occupational mobility never completely stagnates. In reality, over time, Indian society has shown a rise in overall occupational mobility (Azam, 2015; Reddy, 2015).
As the results of this study specifically highlight the low occupational attainment associated with some parental occupations and socio-religious backgrounds (SRCs), a significant jump in education is required for the transition from low-skilled or labour-class positions to high-skilled and professional jobs. Additionally, in terms of education, sons of educated parents continue to hold a dominant position, while a broader spectrum of society exhibits relatively subpar educational achievement. Therefore, it is critical to assess education in meaningful steps, starting with illiteracy and progressing through primary, secondary, and higher education. As a result, unlike other studies, we do not claim that educational attainment and occupational attainment are out of sync. Instead, we predict that there will be a substantial leap in education when a sizable percentage of people with elementary and middle-level educations, as well as illiteracy, pursue higher education, which will inevitably improve their access to the first three jobs. This emphasizes the need for educational advancement in all socio-religious contexts. It may also be noted that a significant portion of jobs in the first three occupations originate in urban areas and remain inaccessible to large rural populations (Emran & Shilpi, 2011). Challenges related to social networks, migration information, accommodation risks in cities, and the perceived benefits of education further disadvantage a significant segment of society (Andersson et al., 2009; Lin, 1999). Access to quality education, technical education, and proficiency in the English language are critical elements in facilitating individuals’ entry into the first three occupations. While individuals may possess higher education degrees, that alone may not be sufficient for securing jobs in these occupations. Notably, unequal access to opportunities is mediated not only by parental educational and occupational contexts but also by certain SRC characteristics that must be considered. Bagde et al. (2016), Basant and Sen (2010), and Jeffrey et al. (2005) indicate that a substantial portion of society, notably from disadvantaged social groups, faces barriers to receiving a quality technical education.
This is precisely the reason for the uneven distribution of opportunities among occupational classes and SRCs created in high-tech industries and service sectors. When analysing the recurring reports from national and international organizations noting the widening gap between the rich and the poor, this context should be taken into account. Several factors contribute to limited or non-existent mobility, including segmentation (rural–urban, formal–informal, and rural-informal), inefficient credit markets, asymmetric information in the labour market, parental perceptions of education returns, risk-bearing ability, and unstable income (Piraino, 2021, p. 46).
Section IV
Conclusion
Our goal was to comprehend how parental backgrounds differed between SRCs and how that affected access to particular jobs. The logit regression results indicate that a higher level of education significantly improves employment chances and that occupational choice for upward mobility depends on educational mobility. In all SRCs, this study highlights the significant influence that the preceding generation’s formal educational and professional achievements had on the current generation. The study also notes that the level of formal education and occupational categories of the preceding generation substantially impacted the present employment shares of various socio-religious groupings in different occupations. The above analysis is a pointer to the possibility that if any socio-religious group lags in education, it may be difficult for them to catch up unless they are given a significant push by their own resolve and prompt and effective interventions from state and non-state actors. In this regard, it is crucial that each community acknowledge the significance of education, place a strong emphasis on educational accomplishments, raise community expectations on education, and so on, because an individual’s educational accomplishments or human capital endowments have a strong correlation with the available occupation options. Clearly, the choice of education takes precedence over the choice of a profession. The findings of this work are based on the co-resident father–son pairs. Additionally, the daughters are not included in the sample. These two limitations limit our ability to comprehend the mobility experiences of the entire population. Nonetheless, this study gives a variety of perspectives on the co-residency issue. The reliability of estimates is increased in this study by the thorough discussion of the co-residency issue and the comparison of the traits of the complete sample and the father–son sample. We may further demonstrate the superiority of NSS data by comparing the estimates of two nationally representative surveys on the data structure (part-time vs full-time). The issue with the second restriction (the exclusion of daughters from household data) is still open, particularly for occupational attainment.
Supplemental Material
Supplemental material for this article is available online.
Footnotes
Acknowledgements
The authors are grateful to the anonymous referees of the journal for their constructive suggestions on the earlier draft of the article.
Author Contributions
N. A. and D. K. N. contributed to the conception of the problem and developing an appropriate theoretical framework, along with the research design. After data extraction, cleaning and analysis, the first draft of the manuscript was prepared by N. A. D. K. N. further enriched the work through his insights, critical comments and writings. All authors have read and approved the final manuscript.
Code Availability Statement (Software Application or Custom Code)
Stata has been used for measuring predicted probabilities. The details on Stata’s margin command can be accessed from
Data Availability Statement
The National Sample Survey data from 1999–2000 to 2011–2012 (NSSO, India) and Periodic Labour Force Survey (2018–19) have been used in this study. The data are readily available in the public domain and can easily be accessed from
Declaration of Conflicting Interests
The authors declared no potential conflicts of interest with respect to the research, authorship and/or publication of this article.
Funding
The authors received no financial support for the research, authorship and/or publication of this article.
Submission Declaration and Verification
This work has not been published previously, and it is not under consideration for publication elsewhere. This article is approved by all authors.
Appendix A
Conceptual Framework of Occupational and Educational Attainment
![]() provides the conceptual framework for occupational attainment. The matrix includes Sectors 1 and 2, which can be interpreted as ‘first three occupations’ and ‘NCO Divisions from 4 to 9’, respectively. Alternatively, in the context of education, Sectors 1 and 2 represent ‘11 or more years of schooling’ and ‘Zero to ten years of schooling’, respectively. Let us explain the concept of occupational attainment based on Matrix A2.
provides the conceptual framework for occupational attainment. The matrix includes Sectors 1 and 2, which can be interpreted as ‘first three occupations’ and ‘NCO Divisions from 4 to 9’, respectively. Alternatively, in the context of education, Sectors 1 and 2 represent ‘11 or more years of schooling’ and ‘Zero to ten years of schooling’, respectively. Let us explain the concept of occupational attainment based on Matrix A2.
In Case 1, fathers are employed in the first three occupations, and their sons are also working in similar occupations. Case 3 demonstrates that fathers worked in occupations from NCO divisions 4 to 9 while their sons moved into the first three occupations. The combination of Case 1 and Case 3 illustrates the number of sons who obtained employment in the first three occupations, which we have represented as logit = 1. On the other hand, Cases 2 and 4 represent alternative scenarios for Cases 1 and 3, respectively, and we have modelled these situations as logit = 0.
When representing the results of these two scenarios (attained and not attained) using Equation 1 in ![]() , the father’s occupational categories (I, II, III, IV, V, and VI) are shown on the X-axis. Category I represents the first three occupations, while the remaining occupational categories correspond to NCO divisions 4–9. In Figure 4, examining the predicted probabilities in the context of category I indicates immobility (Case 1). On the other hand, probabilities associated with categories II to VI represent mobility (Case 3). It is important to note that the combined depiction of Cases 1 and 3 perfectly aligns with the results shown in Figure 4.
, the father’s occupational categories (I, II, III, IV, V, and VI) are shown on the X-axis. Category I represents the first three occupations, while the remaining occupational categories correspond to NCO divisions 4–9. In Figure 4, examining the predicted probabilities in the context of category I indicates immobility (Case 1). On the other hand, probabilities associated with categories II to VI represent mobility (Case 3). It is important to note that the combined depiction of Cases 1 and 3 perfectly aligns with the results shown in Figure 4.
Furthermore, these movements are also presented in the transition diagram (![]() ), which includes probabilities associated with different movements. For example, a son whose father works in the first three occupations has a chance to secure employment in the same category (Case 1). Similarly, other probabilities for different movements are depicted in the diagram.
), which includes probabilities associated with different movements. For example, a son whose father works in the first three occupations has a chance to secure employment in the same category (Case 1). Similarly, other probabilities for different movements are depicted in the diagram.
Notes
References
Supplementary Material
Please find the following supplemental material available below.
For Open Access articles published under a Creative Commons License, all supplemental material carries the same license as the article it is associated with.
For non-Open Access articles published, all supplemental material carries a non-exclusive license, and permission requests for re-use of supplemental material or any part of supplemental material shall be sent directly to the copyright owner as specified in the copyright notice associated with the article.