
Abstract
Background/Aim:
The objective of the paper was to develop a comprehensive “Adolescence Stress Scale” and to examine different psychometric issues in the development, initial validation, and standardization of this scale.
Method:
Exploratory factor analysis was conducted on the data procured from a sample of 634 (11–18 years) school-going adolescents in India.
Results:
An exploratory analysis provided a 10 factor structure, namely, major loss induced stress, enforcement or conflict induced stress, phobic stress, interpersonal conflict induced stress, punishment induced stress, illness and injury induced stress, performance stress, imposition induced stress, insecurity induced stress, unhealthy environment induced stress. The 10 oblique factor solutions are found to be interrelated and interdependent with good indices of internal consistency, and content validity.
Conclusions:
This scale development is a novel and powerful measure that taps onto various aspects of stress experienced by school-going adolescents. The scale can facilitate researchers, clinicians, and teachers to identify and quantify the significant sources of stress in adolescents in school, or clinic settings.
Keywords
Introduction
Measurement of stress is of great concern to child and adolescent psychologists, educational psychologists, clinical psychologists, and health psychologists. Stressor is any agent which places a demand higher than the resources available to the target, and thus disturbs the emotional balance bringing an unpleasant response that may be internalized or externalized. Stress is an inevitable part of life, and can be experienced by an individual during any phase of life since birth.
Various global agencies have included different age groups under the umbrella of “childhood.” The United Nations Convention on the Rights of the Child 1 defines child as “a human being below the age of 18 years unless under the law applicable to the child, majority is attained earlier” and those between the ages of 10 to 19 years are specifically defined as adolescents. This classification is adopted for the purpose of standardizing the Adolescence stress scale.
Experience of stress is a function of severity, duration, and frequency, and these factors determine its impact. Based on these factors, tolerable stress is defined as intense experience of an adversity (stressor) while toxic stress refers to the lasting impact of the stressor. 2 Timely intervention may help in preventing antagonistic impact stretching beyond childhood and adolescence into adulthood. Hence, stress experienced by people below 18 years of age requires focus and transparent comprehension. Stress is a debilitating factor affecting the physical and psychological health of adolescents because they are often not well-equipped with the coping skills or linguistic competence that facilitate appropriate expression and ventilation. 3 Left unattended, it may contribute to poor physical and mental health4–6 as well as behavioral problems such as substance abuse,7,8 structural damages in the prefrontal cortex, 9 and difficulty in controlling emotions, focusing on tasks, or establishing social relationships due to the neurobiological changes by constant exposure to stressors. 10 Evidence suggests that suicide due to stress is the fourth leading cause of death in 15 to 19 year olds. 11
When adolescence stress has such a potential threat, its diagnosis and arrest should be priority. Thus, a valid evaluation tool based on the sociocultural context assumes great significance.
In this context, an intense search of available literature brought to light, the nonavailability of standardized Indian scales to gauge stressors faced by Indian adolescents. Research studies focusing on adolescence stress were found to be using different scales of measurement such as the General Health Questionnaire (GHQ), Depression, Anxiety, and Stress Scale, and Mooney’s Problem Checklist12–14 to name a few. Some studies adapted Western scales. The problems faced in such instances include a lack of multidimensionality and a narrow focus on the source of stress.
Many studies focused on the perception of stress faced by adults have estimated the magnitude of stress in proportion to stressful life adaptation. The popular Holmes & Rahe 15 Stress Scale used points to equate life events which evoked stress. Correspondingly, this study uses an eclectic approach to hypothesize distress symptoms in children by condensing a list of stressors that originate from their own responses. This study is an attempt to fill this vacuum in the discourse on childhood stress that have been a major concern not only in India but other developing countries. The sources of stress, the manifestations as well as coping strategies used by adolescents showed significant variations across cultures. 16 Items in a tool may be irrelevant to a culture different from it. 17 Hence, the diagnostic, or assessment tools should preferably be developed to suit the sociocultural structure.
The above facts prompted the authors to develop the Adolescence Stress scale for Indian adolescents in the age group between 11 and 18 years of age.
Research Question
The objectives of the study were to: (a) construct a self-report scale to measure stress in adolescents, (b) assess its underlying structure, and (c) examine different psychometric properties of the scale
Method
Phases in the Development of the Adolescence Stress Scale
The items to measure Adolescence Stress Scale were developed in 3 phases—item construction, validity and reliability testing, and factor analysis.
Phase I—item construction, establishing face validity: Item pooling was done taking inputs from a sample of 982 adolescents between Class 6 to Class 12, from 15 schools in urban and rural areas. They were asked to list 3 major stressors they had experienced, and rate their intensity (how stressful was the experience?) and frequency (how often they experienced it?). The verbatim was transformed to a categorical item and a unified list was developed along with its average rating and frequency. As a result, a total of 94 items emerged. Then, the preliminary set of items were screened by the experts based on an “essentiality clause.” A total of 8 experts were involved in this exercise. The recommended content validity ratio (CVR) for each of the item was 0.75 and above. 18 Based on this, 20 items that showed a score of less than 0.75 were discarded. In the next step, items where the frequency of responses was less than 1% were dropped. Under this criterion 18 items were discarded. This reduced the initial version of 94 items to 56 items. This filtration was done to avoid ambiguity, duplication, overlapping, and redundancy.
Phase II—The list of 56 items was then used to formulate a questionnaire with 2 response columns—first, the participants were asked to rate the intensity of the stress between 1 and 5, 1 being least stressful to 5 being most stressful; second, they were asked to record if they have ever experienced the stress recorded through a dichotomous response of “yes” or “no.” The intensity rating was aided with a Visual Analogue scale. This was administered on a sample of 643 adolescents between the age of 11 and 18 years belonging to Class 6 (n1 = 153), Class 7 (n2 = 109; Class 8 (n3 = 115), Class 9 (n3 = 145); Class 10 (n4 =121).
The data were put through item analysis to examine for reliability using IBM SPSS Statistics 21 (IBM Corp. Released, 2012). Items were removed based on 3 exclusion criteria: (a) if the item had comparatively low item total correlation (r < 0.3); (b) if the mean intensity rating of the item was found to be less than 2.5, and (c), if less than 50% of the sample reported having experienced the stressor. This led to the elimination of 4 items of the scale (going to school, waking up early, partiality towards brother or sister, bullying by brother or sister). These items were also qualitatively analyzed and were found to collate in indicative meaning with other items. Hence, it was agreeably evaluated to be removed. Further, the obtained alpha value was found to have good internal consistency as it exceeded the recommended value 19 of 0.70.
Phase III—Emergence of domains through factor analysis: An Exploratory Factor Analysis (EFA) was conducted on the remaining 52 items to identify the underlying structure of the factors composing the Adolescence stress scale.
Sampling
Purposive sampling method was adopted for both the phases by drawing the sample from educational institutions. The participants were Indian school-going children (girls and boys) belonging to class 6 to 10 with age ranging between 11 to 18 years as they were deemed to have the comprehension ability to respond to the various scale development instructions and administration processes and primarily also because they belong to the concerned developmental stage of childhood. The total sample consisted of 1625 adolescents, out of which 982 adolescents participated in phase I and 643 in phase II of the scale development process. Sample size was deemed appropriate as per convenience sampling prospects. As per statistical requirements as well, the sample size was found to be adequate
Procedure
After seeking approval from the institution ethics committee with the application number UH/IEC/2020/228, the investigators initiated data collection. Written informed consent was taken from the parents of the participants and written assent from the participants. The data were collected on a one to one basis in phase I. In phase II of the study, data were collected class-wise in a group setting. In phase I the participants were asked to respond to the open ended questionnaire where they had to write the 3 most stressful experiences of their lives. In Phase II they were asked to carefully read the instructions mentioned in the scale provided to them and asked to read the items carefully and respond in the 2 columns provided. The contents were also read out aloud and any doubts raised by the participants were clarified. There was no collateral information collected from the family or teachers regarding stressors experienced by the participants.
Results
Exploratory Factor Analysis
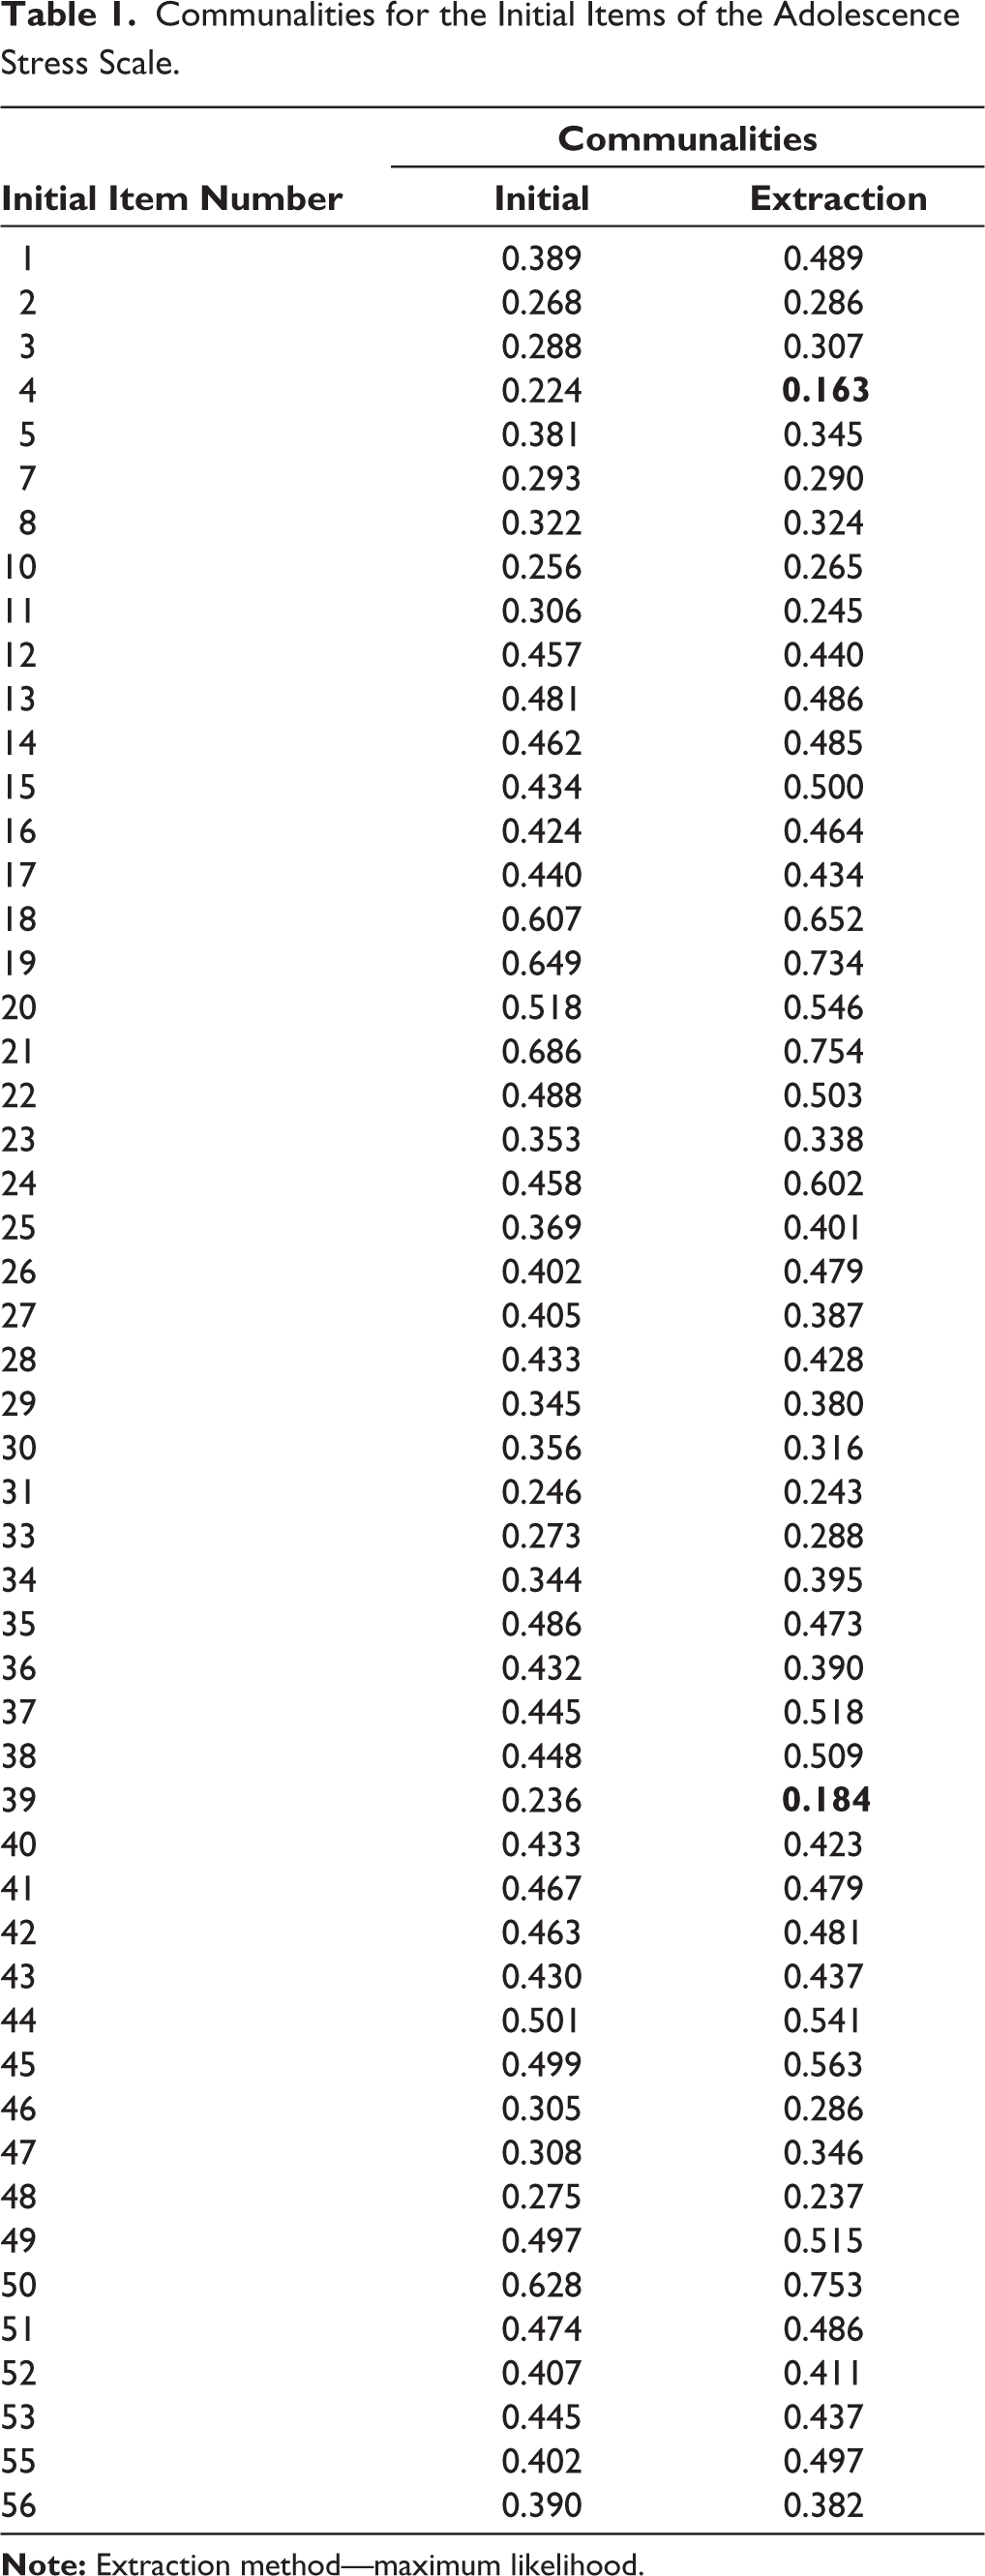
In order to understand the latent factor structure of the scale, maximum likelihood estimation was computed followed by the promax rotation to increase interpretability of the items accounted for each of the factors which could account for common variance of variables. Promax rotation is oblique in nature that allows factors to be correlated with a quicker solution. The data were first assessed for suitability of factor analysis. The Bartlett’s test of sphericity 20 was found to be highly significant (P < .001) and the Kaiser–Meyer–Olkin (KMO) measure of sampling adequacy value was 0.95, which fulfilled the assumptions to conduct factorability of the matrix. 21 Communalities are represented in Table 1.
Communalities for the Initial Items of the Adolescence Stress Scale.
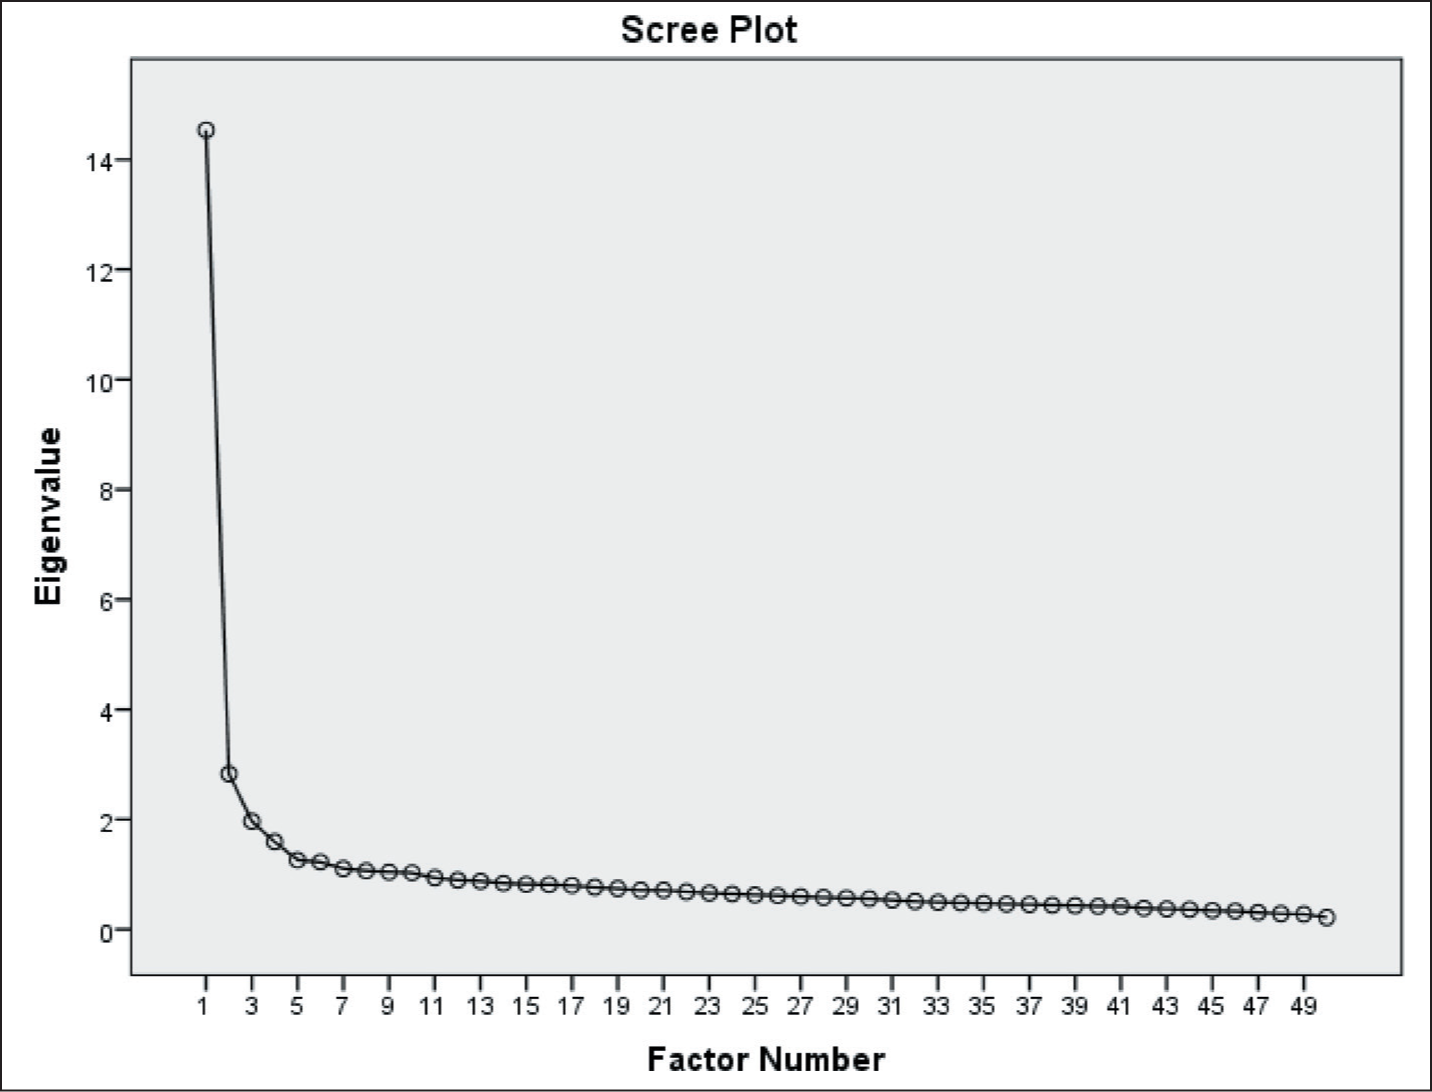
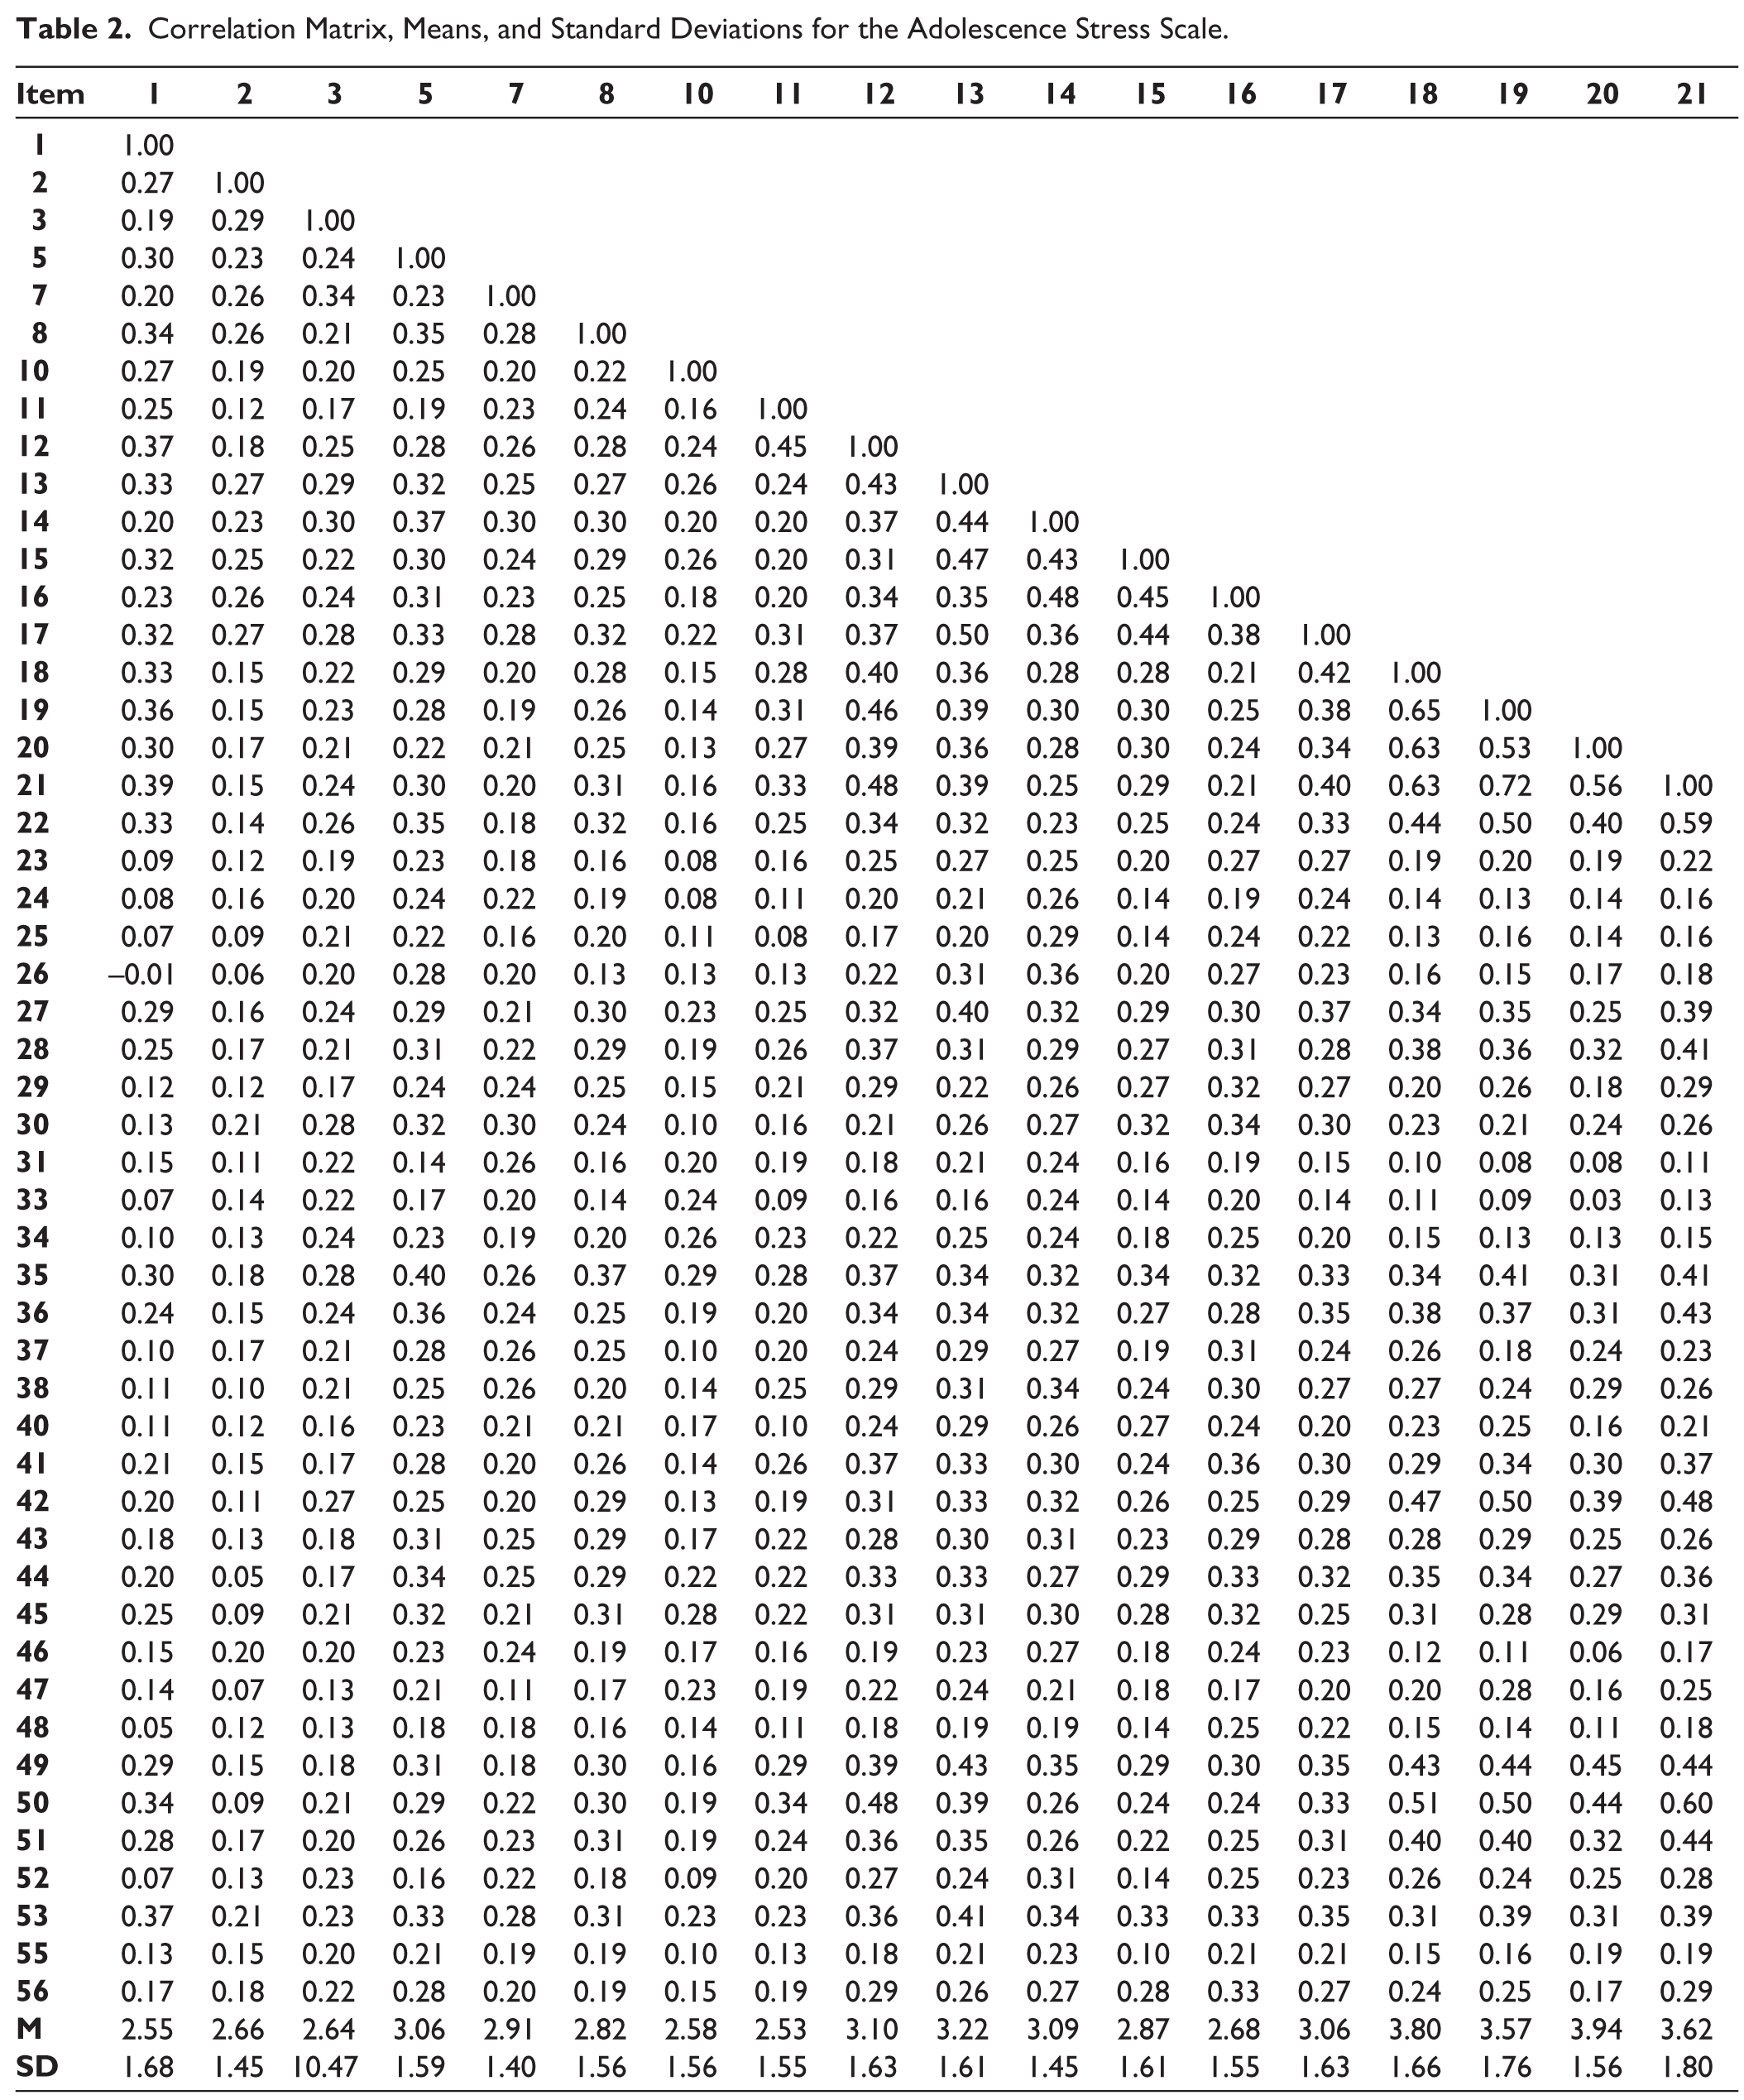
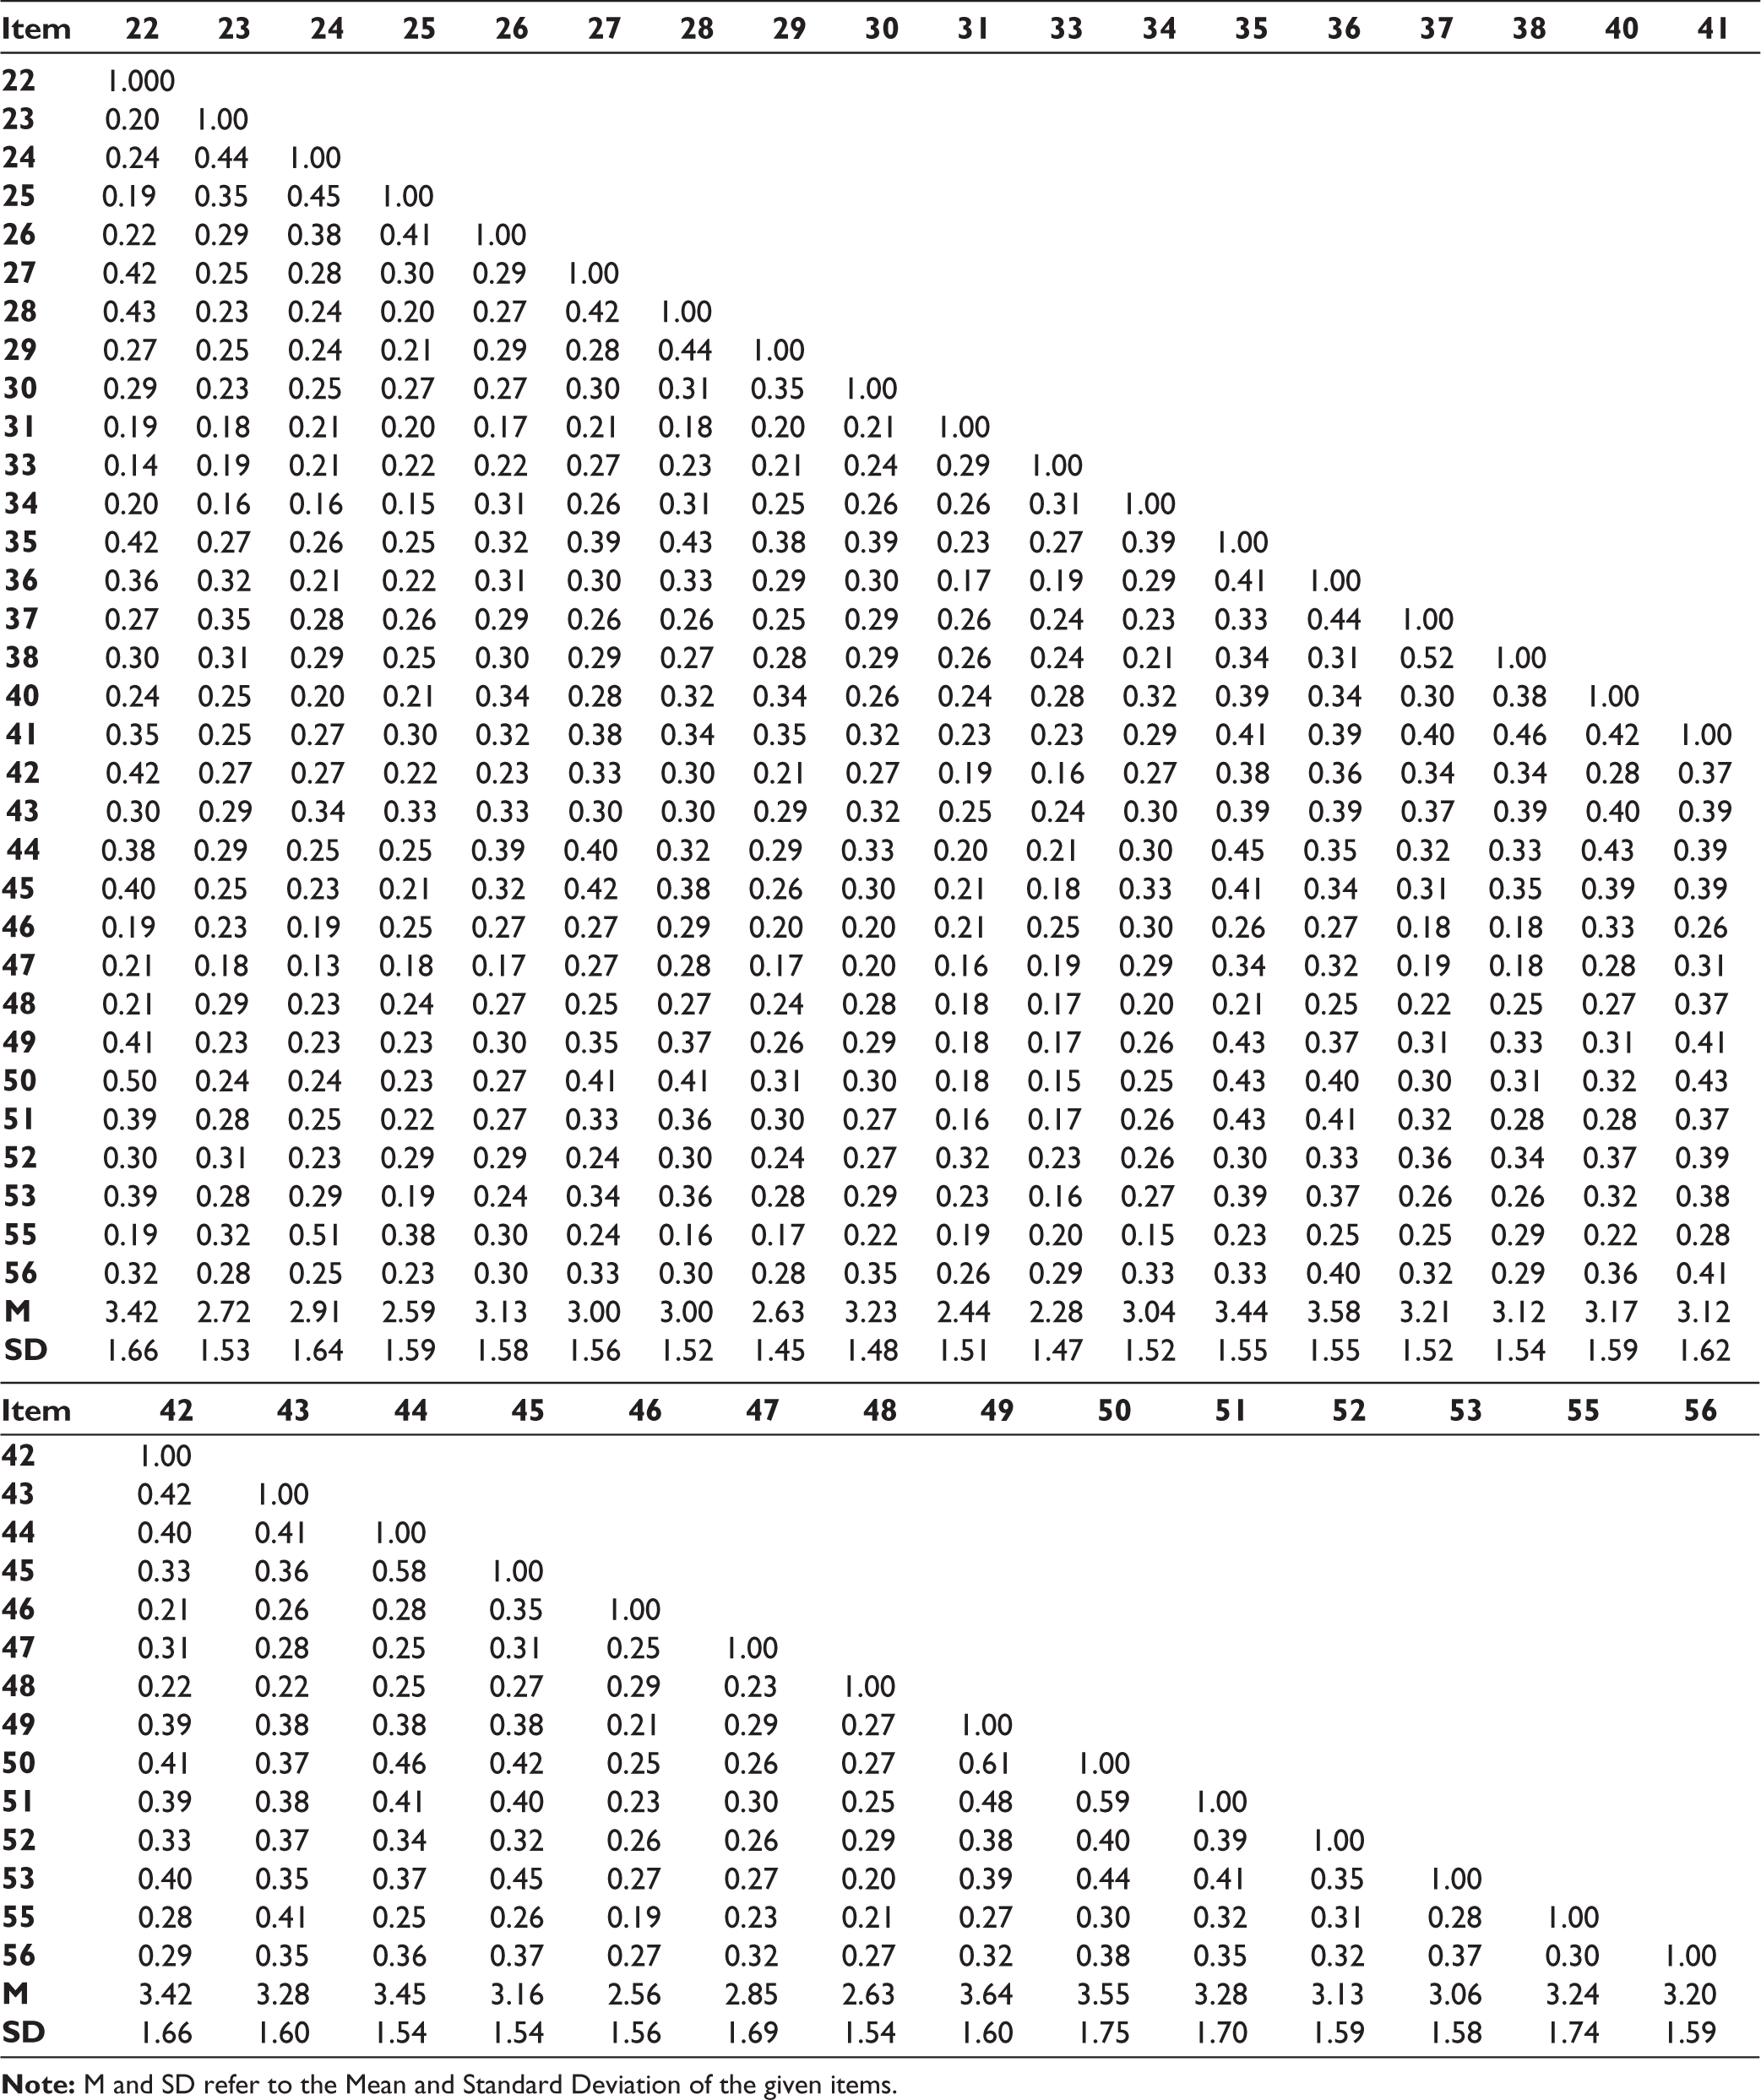
Next, the EFA was run again to extract newer solutions with the 50 items repeating maximum likelihood estimation and promax rotation methods. There was no predetermined number for extraction of factors. Again, the Bartlett’s Test of Sphericity was highly significant (P < .001), and the KMO measure of sampling adequacy value was 0.95, above the recommended value of 0.6.23,24 This clearly indicated that the sample was suitable for carrying out factor analysis for validation of the scale. Figure 1 represents the scree plot obtained in the EFA. The item means, standard deviations, and inter item correlation matrix are presented in Table 2. Based on factor extraction, the number of items in the scale was further reduced to 31 items. The mean intensity of the stress scale was marked on a 5-point scale where 1 = least stressful, and 5 = most stressful; the mean for these set of items range from 3.94 (Item: death of grandparent; SD = 1.56) to 2.50 (Item: Alcoholic parent; SD = 1.68).
Scree Plot from Exploratory Factor Analysis of the Adolescence Stress Scale Data.
Correlation Matrix, Means, and Standard Deviations for the Adolescence Stress Scale.
To determine factor extraction, both scree plot and Kaiser’s Eigen value greater than 1 were considered. Although the scree plot showed a demarcation of 6 factors, Eigen values >1 were reported for a 10 factor structure. Coefficients were sorted for size, and suppressed for less than 0.4 factor loadings. Hence, a 10 factor structure was adopted which comprised of 31 items in total.
The items of the scale, the pattern coefficients (factor loadings) are reported in Table 3.
Pattern Matrix for Maximum Likelihood with Promax Rotation of 10 Factor Solution of Adolescence Stress Scale.
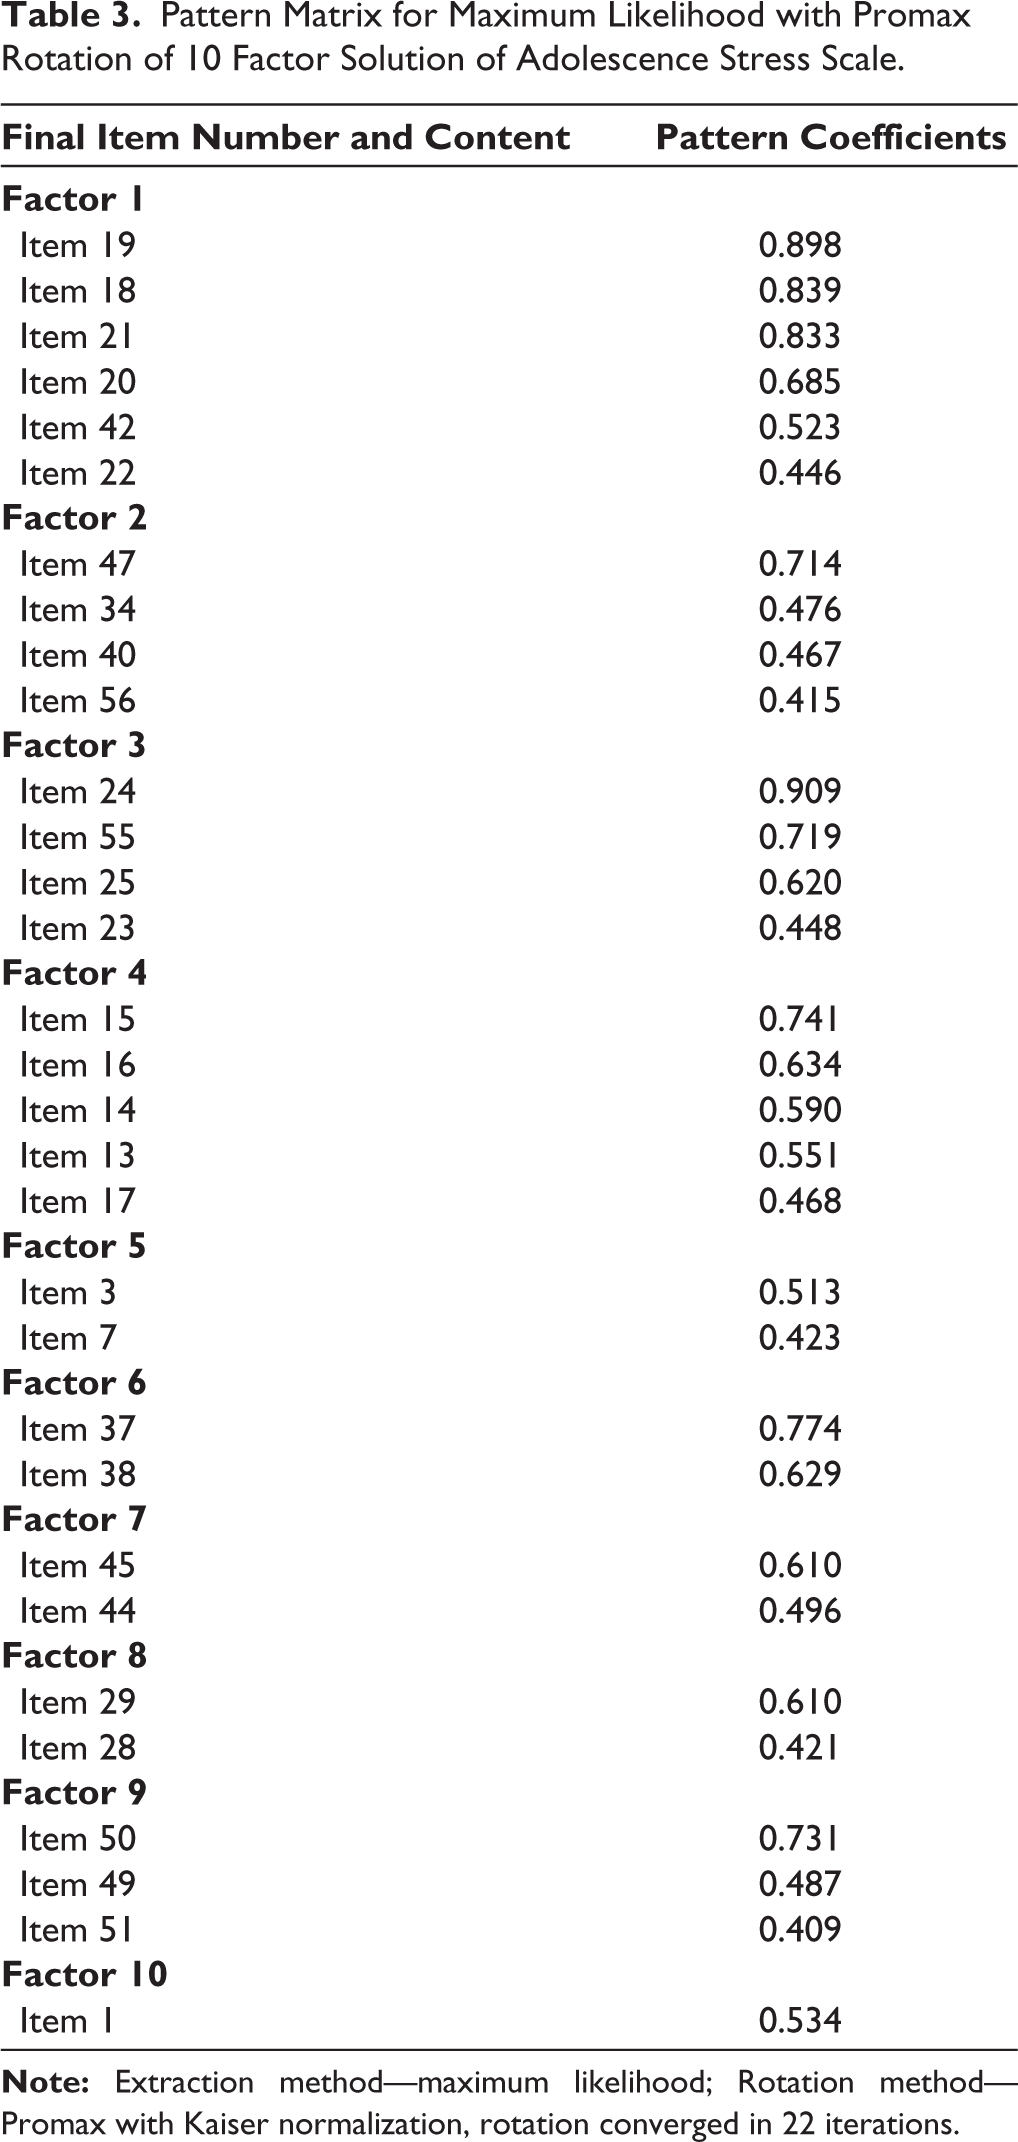
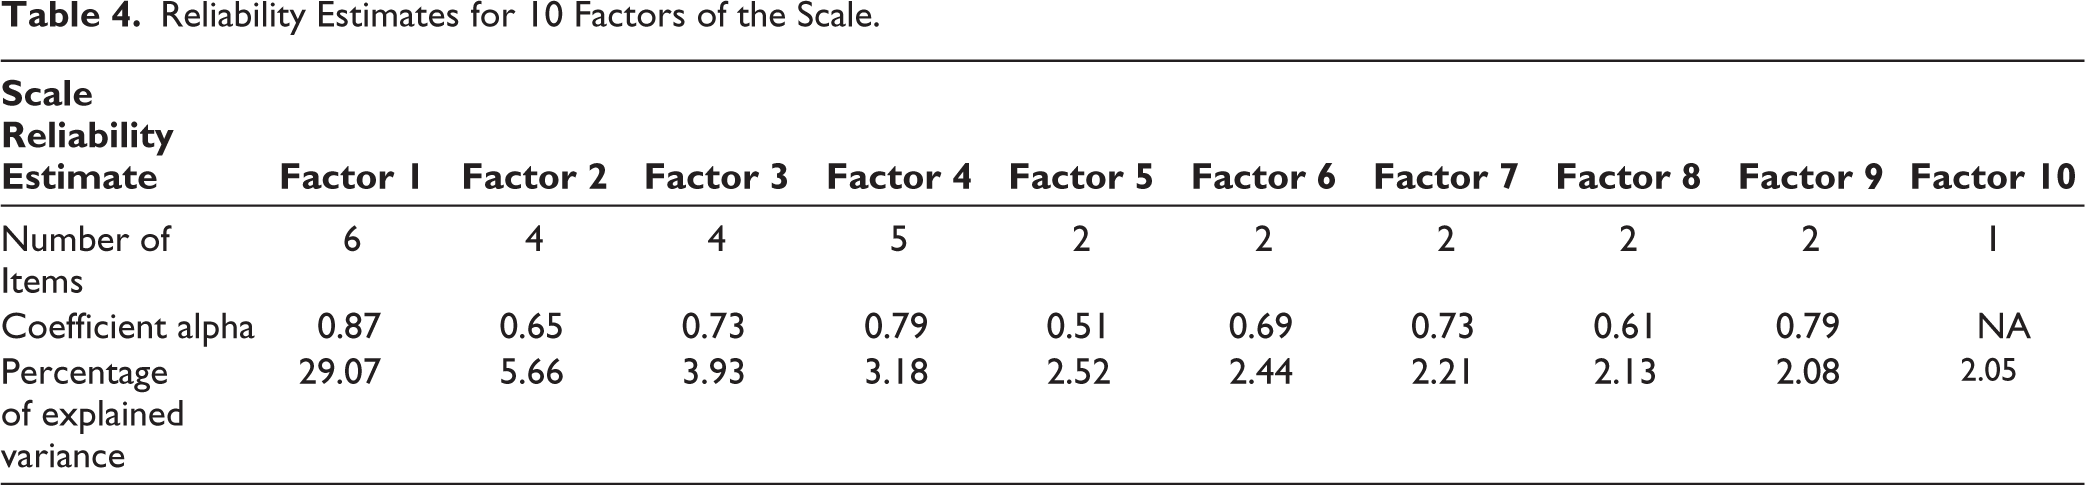
Table 4 reports the variance accounted by each of the factors. The factors themselves were correlated, and thus are deemed interrelated and interdependent. The coefficients are accounted in Table 4.
Reliability Estimates for 10 Factors of the Scale.
Factor labelling was done for the 10 factors that were identified through EFA based on their content. Factor 1 (6 items) was labelled as Major loss induced stress as the 6 items under this factor describe death of near and dear ones, failure in exams, and incidence of accident. These items refer to either irreversible changes in anybody’s life, or major changes that occur upon events of examination failure or accident. These items refer to stressors that require socio-emotional adjustment, and may alter the perception of one’s worldview. Factor 2 (4 items) was named “Enforcement or Conflict induced stress” which point to dual forms of intrapersonal stress that arise from forced participation, dealing with academic pressure, or conflicts with an identified romantic partner commonly experienced by adolescents. Factor 3 was named as “Phobic stress,” owing to the irrationally founded fears as indicated by the 4 items. Factor 4 (5 items) was named “Interpersonal conflict induced stress” indicate the aspects of distress due to witnessing, or being a part of quarrels with either family or friends. Factor 5 was named “Punishment induced stress” that comprised of 2 items indicative of the fear of punishment. The 6th factor derived from 2 factors was named “Illness & Injury induced stress” denoting the anguish from sickness, disease state, or the trauma of an individual as indicated by the 2 items. The 7th factor (2 items) was categorized as “Performance stress” as the items indicate the stress of performing with excellence in academics as well as other activities. The 8th factor (2 items) was labelled “Imposition induced stress” as the items were indicative of stress arising from obligatory or forced participation in activities. The 9th factor (3 items) is called “insecurity induced stress” as it harnesses the feelings of physical separation related distress, and also feelings of being unsafe, or subject to wrongful contact, or sexual harassment. The last and 10th factor was a single item measure labelled as “Unhealthy environment induced stress” because it represented an inconducive scenario of being with an alcoholic parent.
The subscale scores were cumulatively calculated by summing up the item scores of each of the factors. The internal consistency of the entire set of 31 items (α = 0.92) was higher than that of the individual subscales (α = 0.87 for Major loss induced Stress; α = 0.65 for Enforcement, or Conflict induced Stress; α = 0.73 for Phobia induced stress; α = 0.79 for Interpersonal conflict induced Stress; α = 0.51 for Punishment induced stress; α = 0.69 for Illness and Injury induced stress; α = 0.73 for Performance stress; α = 0.61 for Imposition induced stress, and α = 0.79 for Insecurity induced Stress). The reliability coefficients for each subscale were found to be within acceptable norms for individual diagnosis. 25
Reliability and Validity Testing
For the final scale with 31 items test-retest reliability was calculated using the Pearson correlation coefficient. The 3-week test-retest reliability was 0.57 with correlation significant at the .01 level. To establish the concurrent validity of the scale Children’s happiness scale 26 and GHQ-12 27 (Goldberg & Williams, 1988) were used. Adolescence stress scale was negatively correlated with Happiness scale with r value of –0.20 and positively correlated with r value of 0.29 with GHQ-12. Both the correlations were found to be significant at .01 level.
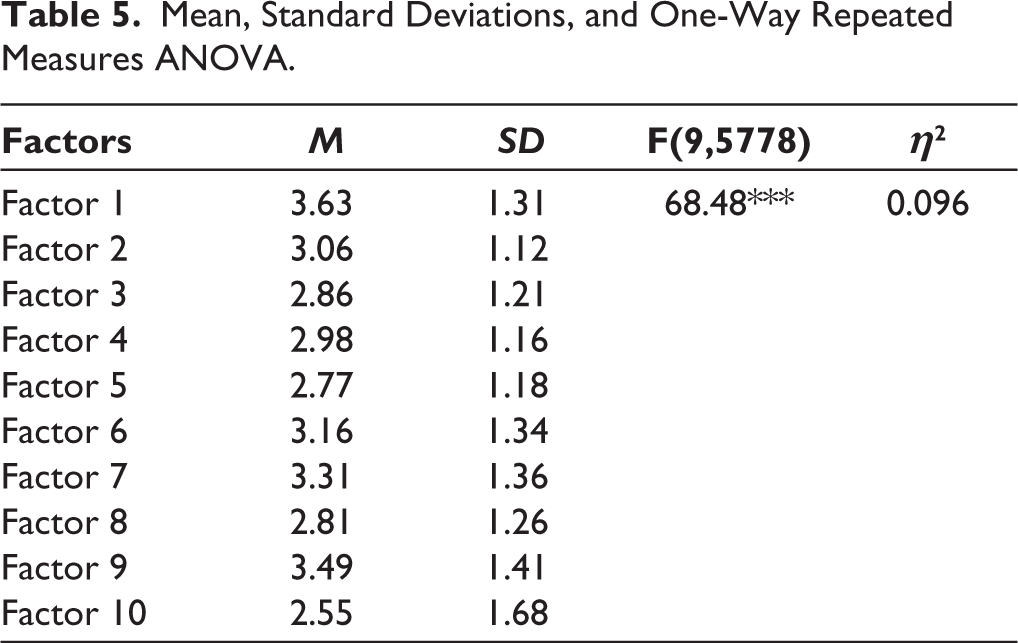
To compare the 10 subscale scores, a one-way repeated measures ANOVA was carried out. The results, as reported in Table 5, revealed a significant difference across the 10-factor scores’ means, F(9,5778) = 68.48, P < .001, η 2 = 0.096.
Mean, Standard Deviations, and One-Way Repeated Measures ANOVA.
Discussion
The main objective of the study was to develop a holistic self-report scale that measures stress experienced by adolescents and the different psychometric issues related to scale development.
The findings indicate that the adolescence stress scale has high internal consistency. Further, a 10 factor structure—Major loss induced stress, Enforcement or Conflict induced stress, Phobic stress, Interpersonal conflict induced stress, Punishment induced stress, Illness & Injury induced stress, Performance stress, Imposition induced stress, Insecurity induced stress, and Unhealthy environment induced stress—have been identified as the major stressors faced by adolescents. The 10 factors were found to be interrelated and interdependent with good markers of internal consistency and content validity.
Contingent to the portfolio of theories that justify the origin, and persistence of childhood traumatic stress disorder, 28 this scale development is a novel and powerful measure that taps onto the various aspects of stress experienced by adolescent-aged school-going children. This scale is also gender neutral which means that it is applicable for both boys and girls. In terms of comprehensibility, this scale is precise, easy to understand, and is not at all cumbersome to administer or score. The scale can facilitate researchers, clinicians, and teachers to identify the broad area(s) of stress and be able to quantify it in school or clinic settings. A norm of the scale needs to be developed for better interpretability and gender-dependent perspectives.
This study may not be generalizable to all cultures. This scale is also gender neutral which means that it is applicable for both boys and girls. The scale’s main limitation is that it has been developed from the accounts of school-going adolescents only who were able to literally express their anguish. It does not capture the experiences of non-school goers. Another limitation is that participants may fail to retrieve past events accurately while naming stressors and assessing their severity, resulting in recall bias and the stressors being unnoticed.
These limitations do not overpower a well-defined structure and good reliability estimates established in this study. It is encouraged to utilize this scale in research and clinical practice to establish a variety of psychometric properties for this scale. The scores need to be assessed for stability and evaluated for its predictive property to various measures. In future it is also advisable to study the coping strategies of adolescents facing these stressors in order to understand the complete mechanism of stressor and response.
Summary
Current study reports on the development of a scale to measure the stress levels in adolescents and its psychometric properties. The adolescence stress scale provides an opportunity to clearly understand the stress levels and sources of stress in adolescents of age 11 to 18 years. A 10 factor structure was identified, namely, Major loss induced stress, Enforcement, or Conflict induced stress, Phobic stress, Interpersonal conflict induced stress, Punishment induced stress, Illness & Injury induced stress, Performance stress, Imposition induced stress, Insecurity induced stress, Unhealthy environment induced stress. This scale can be used in clinical settings, hospitals, and schools contributing to the various branches of psychology such as health psychology, developmental psychology, and school psychology.
Footnotes
Acknowledgements
We are thankful to the principals and teachers of the schools for permitting us to work with their students. We are thankful to all the children for their active participation.
Declaration of Conflicting Interests
The authors declared no potential conflicts of interest with respect to the research, authorship, and/or publication of this article.
Funding
The authors received no financial support for the research, authorship, and/or publication of this article.
Ethical Approval
Ethical approval was obtained from the Institutional Ethics Committee with application number UH/IEC/2020/228.
Informed Consent
Permission was obtained from the schools. Informed consent was obtained from the parents of the participants and informed assent was obtained from the children.