
Abstract
Background
Fungal polysaccharides are an essential active polymer compound in human cells. A clear understanding of the structure of polysaccharides is the foundation for conducting research and utilization of polysaccharides.
Objectives
To explore the structure and immunomodulatory activities of polysaccharides from Hygrophorus olivaceoalbus and Agrocybe aegerita.
Materials and Methods
High-performance liquid chromatography, high-performance gel-permeation chromatography, nuclear magnetic resonance, and gas chromatography–mass spectrometry analysis were utilized to analyze the structure of Hygrophorus olivaceoalbus polysaccharide (HO-P) and Agrocybe aegerita polysaccharide (AA-P). The immunomodulatory activities of these polysaccharides were also studied.
Results
The HO-P consisted of (1↓6)-Galp, (1↓4)-Glup, (↓1)-Glup, and (1↓4,6)-D-Manp with the ratio of mannose, galactose, and glucose being 1:1:2. The AA-P was consisted of (1↓4,6)-Glup, (1↓4)-Arap, and (1↓6)-Galp with the ratio of galactose, glucose, and arabinose being 3:2:1. AA-P and HO-P could both mainly by reducing G0/G1 phase, which leads to the significant proliferation of B cells and RAW264.7 cells, respectively. At the same time, AA-P and HO-P could significantly stimulate the necrosis factor-α secretion of T cells, IgA, IgD, IgE, IgG, and IgM secretion of B cells and tumor necrosis factor-α secretion of RAW264.7 cells, but neither of them could stimulate interleukin-1↓ secretion of RAW264.7 cells.
Conclusion
Due to its better branching degree, AA-P is more conducive to forming a triple-helix, three-dimensional configuration, as well as better solubility and smaller molecular weight, thus exhibiting higher biological immune activity against immune cells than HO-P.
Introduction
The world’s fungal resources are very abundant, and fungi are a valuable resource library for finding new medicine. Edible and medicinal fungal polysaccharides are one of the main bioactive components in edible and medicinal fungi. Since the 1970s, research on edible and medicinal fungal polysaccharides has entered a new era of development (Geneviève et al., 1986; Hou et al., 2016; Ishii, 1997; Wijesekara et al., 2011). Some products derived from edible and medicinal fungal polysaccharides have entered clinical practice and are used for immunotherapy of diseases such as cancer, including Ganoderma polysaccharide, Radix Astragali seu Hedysari polysaccharide, and so on (Richard et al., 2003; Samuelsen et al., 2011; Xu et al., 2019). Polysaccharides can achieve antitumor activity by enhancing immune activity. Studies have shown that polysaccharides can enhance the immune function of the body by enhancing immune cell activity, activating cytokine secretion, inducing antibody production, and activating the complement system. The antitumor pathways of polysaccharides mainly include inhibiting the growth of tumor cells, protein and nucleic acid synthesis, inducing tumor cell apoptosis, affecting the expression of oncogenes, and altering the growth characteristics of tumor cell membranes (Kouakou et al., 2013; Kozarski et al., 2011; Rief, 1997). For example, Atractylodis macrocephalae Koidz. polysaccharides could significantly promote the proliferation of splenocytes and make the cells enter G2/M and S phases, increase ratios of T/B cells, boost natural killer (NK) cytotoxicity, and enhance transcriptional activities of NFAT and AP-1 (Omarsdottir et al., 2005).
Agrocybe aegerita belongs to the Agrocybe, Bolbitiaceae, Agaricales, and Basidiomycetes, which mainly grows in Sichuan, Fujian, Yunnan province in China. Hygrophorus olivaceoalbus belongs to Umbelliferae, Agaricales, and Basidiomycetes, which are scattered or clustered in the forest in autumn and summer and are widely discovered in Sichuan, Jilin, Heilongjiang province in China. Fang et al. found that the average molecular weight of A. aegerita polysaccharide (ACPS) was 11,863 Da. The animal experiment results showed that polysaccharide ACPS can improve the phagocytosis rate and phagocytosis index of macrophages, the thymus index, and the spleen index in mice (Sheu et al., 2013). Yihong et al. reported that the molecular weight of A. aegerita lectin (AAL) was 15.18 kDa. The results of antitumor activities in vitro indicated that AAL has strong antitumor inhibition and apoptosis-inducing effects on SGC7901, MGC80-3, SW480, HL-60, BGC-823, mouse sarcoma S-180 cell line, and HeLa cell line (Yihong et al., 2006). Liang et al. extracted polysaccharide (AA-P) from A. aegerita, and found that AA-P decreased tumor necrosis factor (TNF)-α and increased interferon (IFN)-β to regulate the immune function of endothelial cells and enhance the antitumor ability (Liang et al., 2010). Ji et al. extracted two polysaccharides (Al-MPS and AC-MPS) from the fruiting body of A. aegerita. Al-MPS and AC-MPS had antioxidant and antiaging effects by scavenging the ability of hydroxyl radicals and DPPH radicals (Ji et al., 2013). In this study, the structure and activities of two new polysaccharides AA-P and Hygrophorus olivaceoalbus Polysaccharide (HO-P) from A. aegerita and H. olivaceoalbus, respectively, were studied to provide a theoretical basis for the wider application of polysaccharides.
Materials and Methods
Purification of Polysaccharides
The A. aegerita and H. olivaceoalbus were collected in Yajiang County, Sichuan Province, China. Dried fungal fruiting body was grinded into powder. Add three times the volume of distilled water, soak at 100°C for 6 hours, centrifuge, concentrate the supernatant to 200 mL, and then add 1:4 anhydrous ethanol for precipitation. Collect the flocculent precipitate by centrifugation and remove proteins (Horan & Eccles, 1986; Jing et al., 2017). Purification of polysaccharides was carried out using DEAE-52 cellulose column, with NaCl solution as eluent and elution flow rate of 5 mL/min. Five milliliters of polysaccharide solution were collected in each tube. Sulfuric acid phenol method was used to detect polysaccharide content (Jing et al., 2017). Collect the elution solution with the highest optical density (OD) value, and dialyze (7,000 Da), centrifuge, and freeze–dry to obtain pure polysaccharides (AA-P and HO-P).
Yield percentages for polysaccharides = weight of polysaccharides/weight of fungus fruiting body.
Polysaccharide Structure Characterization
Obtain transition data of vibrational and rotational energy levels in polysaccharide molecules using an infrared spectrometer within the range of 4,000-400 cm–1 (Hongli & Xiaohong, 2011). The relative molecular weights of the components of polysaccharides were determined by HPGPC method (Coimbra et al., 1997). The analysis of monosaccharide composition was performed using high-performance liquid chromatography (HPLC) and gas chromatography–mass spectrometry (GC–MS) (Charlton & Jones, 2007; Xie et al., 2010). The nuclear magnetic resonance spectra signals of C and H elements were collected using Varian Unity INOVA 400/45 (Scamparini et al., 1997).
Polysaccharide Effects on the Proliferation of Immune Cells
The effects were determined via the CCK-8 method (Uryu et al., 2010). The experimental group included experiment groups (AA-P, HO-P), positive control groups (lipopolysaccharide, LPS), and blank groups (Control). Inoculate 100 µL of logarithmic growth stage cells into each well at a density of 1 × 10⁵ cells/mL, and culture in a 37°C, 5% CO2 for 24 hours. Add polysaccharide solutions (1.25, 2.5, 5, 10 µg/mL), use CCK-8 method to detect the number of live cells, and observe the cell morphology under a microscope (Zeng et al., 2019).
Effects on Cell Cycle of Immune Cells
Inoculate 100 µL of logarithmic growth stage cells into each well (1 × 10⁵ cells/mL), and culture in a 37°C, 5% CO2, and certain humidity incubator for 24 hours. A polysaccharide solution was added. Incubated cells in a CO2 incubator for 24 hours, collected cells. Added 1 mL of precooled PBS solution and collected cells. Added 1 mL of precooled 70% ethanol and fixed at 4°C for 12 hours (Shaofang et al., 2011). Added 0.5 mL of staining solution to each cell sample and took a dark bath at 37°C for 30 minutes. The cell cycle was measured by BD Flow Cytometry at a wavelength of 488 nm for analysis using FlowJo V10 software.
Effect of Polysaccharides on the Secretion of Cytokines by Immune Cells
The cytokines were detected by the ELISA kit at an ELISA reader at wavelength 450 nm (Shaofang et al., 2011).
Statistical Analysis
The one-way analysis of variance was used for difference analysis. *p < 0.05: significant difference, **p < 0.01: highly significant difference.
Results
The Molecular Weight of AA-P and HO-P
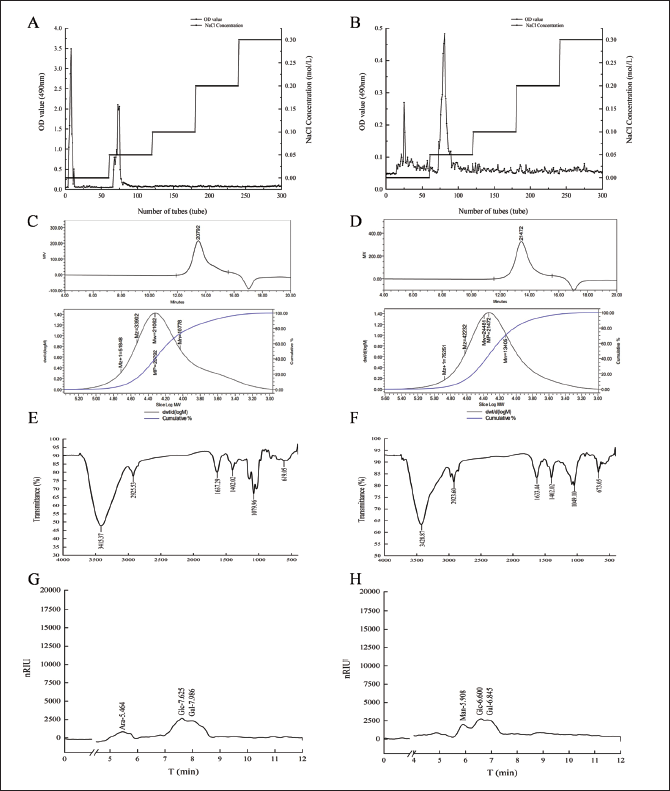
Collect polysaccharides from distilled water as the research objective. The yields of AA-P and HO-P were 0.2% and 0.3%, respectively (Figure 1A and B). The Mw of AA-P and HO-P were 21,062 and 24,481 Da, respectively (Figure 1C and D).
(A,B) Column Chromatography Results of Agrocybe aegerita Polysaccharide (AA-P) and Hygrophorus olivaceoalbus Polysaccharide (HO-P), Respectively. (C,D) The Molecular Weight of AA-P and HO-P, Respectively. (E,F) The Fourier Transform Infrared Spectra of AA-P and HO-P, Respectively. (G,H) Monosaccharide Composition Results of AA-P and HO-P, Respectively.
FT-IR Results of AA-P and HO-P
In the IR results of AA-P (Figure 1E), the signal values of O–H, –CH2, C–H, C–H rocking vibration, C=O, and C–O were at 3,415.37, 2,925.53, 1,402.02, 619.05, 1,637.29, and 1,079.96 cm–1, repectively.
In the IR results of HO-P (Figure 1F), the signal values of O–H, –CH2, C–H, C–H rocking vibration, C=O, and C–O were at 3,428.87, 2,923.60, 1,402.02, 673.05, 1,633.44, and 1,049.10 cm–1, repectively.
Analysis of Monosaccharide of AA-P and HO-P
The retention time of standards in AA-P experiments was as follows: Rhamnose: 4.581 minutes, Xylose: 5.419 minutes, Arabinose: 5.954 minutes, Fructose: 6.489 minutes, Mannose: 6.751 minutes, Glucose: 7.574 minutes, Galactose: 7.934 minutes. The peaks of monosaccharide of AA-P, with retention times of 5.464, 7.625, and 7.986 minutes, were Ara, Glc, and Gal (1:3:2), respectively (Figure 1G).
The retention time of standards in HO-P experiments were as follows: Rhamnose: 4.253 minutes, Xylose: 4.894 minutes, Arabinose: 5.364 minutes, Fructose: 5.763 minutes, Mannose: 5.931 minutes, Glucose: 6.589 minutes, Galactose: 6.847 minutes. The retention time of 5.908, 6.600, and 6.845 minutes were Man, Glc, and Gal (2:1:1), respectively (Figure 1H).
GC–MS Analysis of AA-P and HO-P
The GC–MS results of AA-P showed glucose was 1,2,3- and 1,4,6-trimethylsilyl-Glcp, which indicated that glucose was 1,2,3-linked and 1,4,6-linked. The 1,2,6-trimethylsilyl-Galp and 1,3,6-trimethylsilyl-Galp indicated galactose were 1,2,6- and 1,3,6-linked. The 1,2,3,4-trimethylsilyl-Arap indicated arabinose was 1,2,3,4-linked. Considering incomplete methylation, it indicated that the arabinose was 1,4-linked, the galactose was 1,6-linked, and the glucose was 1- and 1,4,6-linked (Figure 2A–I).
(A–I) The Methylation Results of Agrocybe aegerita Polysaccharide (AA-P). (B–J) The Methylation Results of Hygrophorus olivaceoalbus Polysaccharide (HO-P).
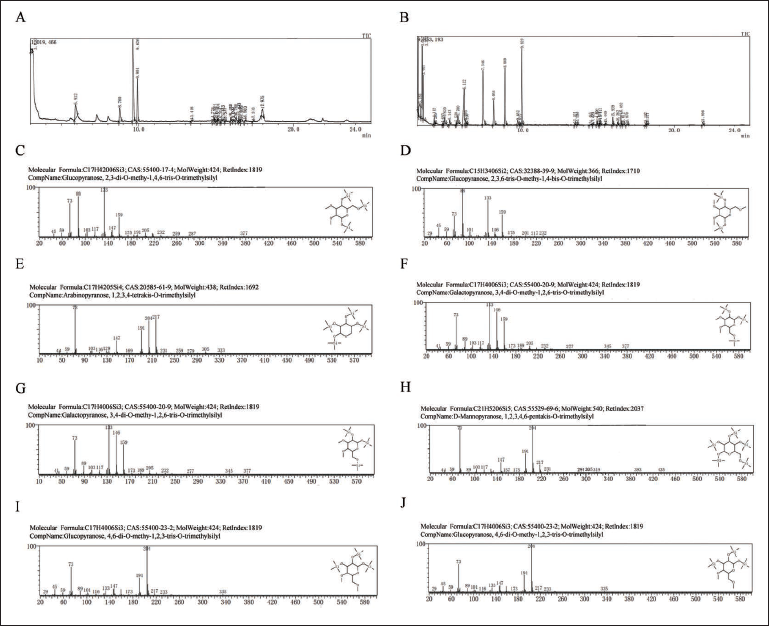
The GC–MS results of HO-P showed that glucose was 1,6-linked, 1-linked, and 1,4,6-linked since there were 1,6-trimethylsilyl-Glcp, 1-trimethylsilyl-Glcp, and 1,4-trimethylsilyl-Glcp. The 1,2,6-trimethylsilyl-Galp and 1,2,3,4-trimethylsilyl-Galp indicated that galactose were 1,2,6- and 1,2,3,4-linked. The 1,2,3,4,6-trimethylsilyl-D-Manp indicated that mannose was 1,2,3,4,6-linked. Considering incomplete methylation, the glucose was 1-, 1,6-, and 1,4,6-linked, the galactose was 1,6- and 1,4-linked, and the mannose was 1,4,6-linked (Figure 2B–J).
1H Nuclear Magnetic Resonance Spectroscopy (1H-NMR) of AA-P and HO-P
1H-NMR showed five signals of anomeric protons in AA-P, which were at δ 5.09, 5.00, 4.96, 4.88, and 4.42, respectively, which belong to (A)(1↓6)-Galp, (B)(1↓4,6)-Glcp, (C)(1↓6)-Galp, (D)(1↓4)-Arap, (E)(↓1)-Glcp, respectively (Table 1, Figure 3A).
Chemical Shifts of Hydrogen and Carbon Atoms in Agrocybe aegerita Polysaccharide (AA-P).
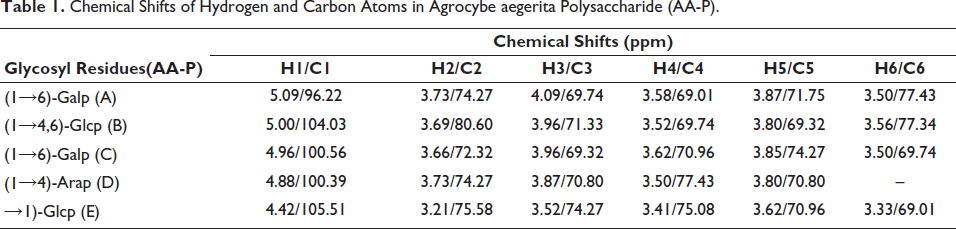
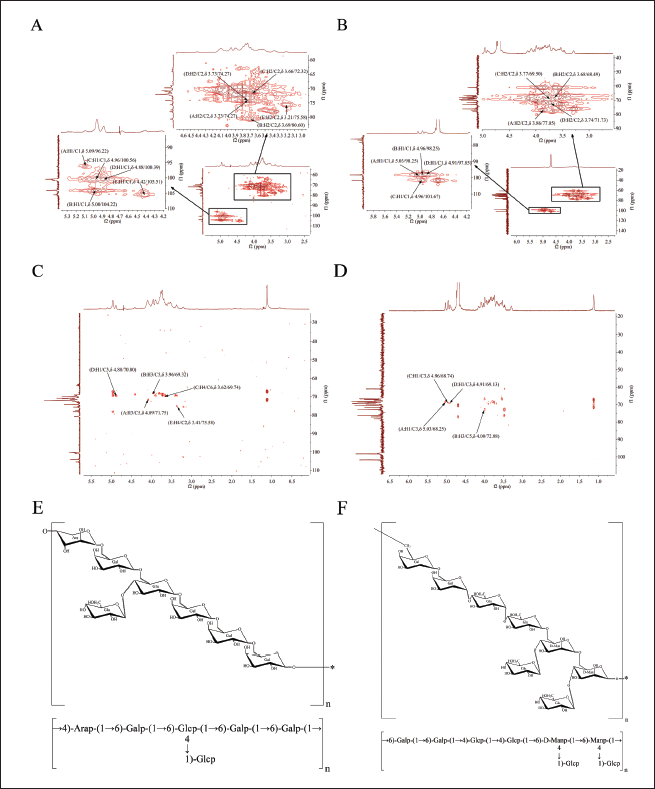
(A,B) The 1H Nuclear Magnetic Resonance Spectroscopy (1H-NMR) Spectra of Agrocybe aegerita Polysaccharide (AA-P) and Hygrophorus olivaceoalbus Polysaccharide (HO-P), Respectively. (C,D) The 13C Nuclear Magnetic Resonance Spectroscopy (13C-NMR) Spectra of AA-P and HO-P, Respectively. (E,F) 1H-1H Correlation Spectroscopy (1H-1H COSY) Spectrum of AA-P and HO-P, Respectively.
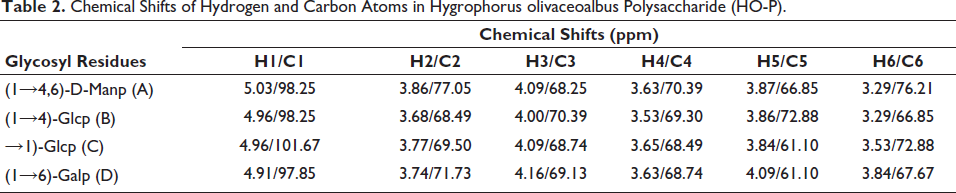
1H-NMR spectra showed three anomeric protons signals in HO-P: δ 5.03, 4.96, and 4.91. Anomeric protons signal at δ 5.03 and δ 4.91 belong to (1↓4,6)-D-Manp(A) and (1↓6)-Galp(D), respectively, and signals at δ 4.96 belong to (B)(1↓4)-Glcp and (C)(↓1)-Glcp (Table 2, Figure 3B).
Chemical Shifts of Hydrogen and Carbon Atoms in Hygrophorus olivaceoalbus Polysaccharide (HO-P).
13C Nuclear Magnetic Resonance Spectroscopy (13C-NMR) of AA-P and HO-P
13C-NMR showed five anomeric carbon signals in AA-P at δ 105.51, δ 104.03, δ 100.56, δ 100.39, and δ 96.22, which belong to anomeric carbon signals of (A)(1↓6)-Galp, (B)(1↓4,6)-Glcp, (C)(1↓6)-Galp, (D)(1↓4)-Arap, and (E)(↓1)-Glcp, respectively (Table 1, Figure 3C).
13C-NMR spectra showed three anomeric carbon signals in HO-P at δ 101.67, δ 98.25, and δ 97.85. The signals at δ 98.25 belong to (A)(1↓4,6)-D-Manp and (B)(1↓4)-Glcp, and signals at δ 101.67 and δ 97.85 belong to (C)(↓1)-Glcp and (D)(1↓2,6)-Galp, respectively (Table 2, Figure 3D).
1H-1H Correlation Spectroscopy (1H-1H COSY) of AA-P and HO-P
The 1H-1H COSY of AA-P showed signal δ 5.09/3.73, δ 5.00/3.69, δ 4.96/3.66, δ 4.88/3.73, and δ 4.42/3.21 belonging to the resonant coupling signal between H-2 and H-1 of the (1↓6)-Galp(A), (1↓4,6)-Glcp(B), (1↓6)-Galp(C), (1↓4)-Arap(D), and (↓1)-Glcp(E) groups, respectively (Li et al., 2014; Yamashita et al., 2015). The signals of H6-H2 of the A group were δ 3.73, 4.09, 3.58, 3.87, and 3.50, respectively (Urai et al., 2007) (Figure 3E).
The 1H-1H COSY of HO-P showed signal δ 5.03/3.86, δ 4.96/3.68, δ 4.96/3.77, and δ 4.91/3.74 belonging to the resonant coupling signal between H-2 and H-1 of the (1↓4,6)-Manp(A), (1↓4)-Glcp(B), (↓1)-Glcp(C), (1↓6)-Galp(D) groups, respectively. The signals of H6-H2 of the A group were δ 3.86, 4.09, 3.63, 3.87, and 3.29, respectively (Figure 3F).
Heteronuclear Multiple Quantum Correlation (HMQC) Results of AA-P and HO-P
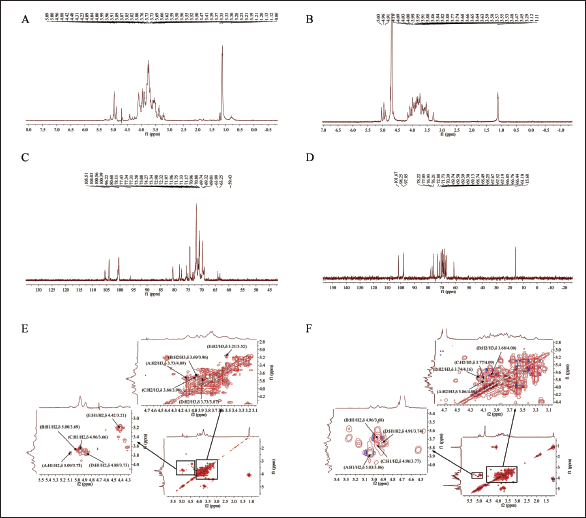
HMQC spectrum showed that signal in AA-P of δ 96.22/5.09, δ 104.03/5.00, δ 100.56/4.96, δ 100.39/4.88, and δ 105.51/4.42 belong to signal between H-1 and C-1 of the (1↓6)-Galp(A), (1↓4,6)-Glcp(B), (1↓6)-Galp(C), (1↓4)-Arap(D), and (↓1)-Glcp(E) groups, respectively (Nandan et al., 2011; Rong et al., 2008). The C2-C6 signals in (1↓6)-Galp group(A) were δ 74.27, δ 69.74, δ 69.01, δ 71.75, and δ 77.43, respectively (Nandan et al., 2011) (Figure 4A).
(A,B) Heteronuclear Multiple Quantum Correlation (HMQC) Spectrum of Agrocybe aegerita Polysaccharide (AA-P) and Hygrophorus olivaceoalbus Polysaccharide (HO-P), Respectively. (C,D) Heteronuclear Multiple Bond Correlation (HMBC) Spectrum of AA-P and HO-P, Respectively. (E,F) Predicted Chemical Structure of AA-P and HO-P, Respectively.
HMQC spectrum showed signal in HO-P at δ 98.25/5.03, δ 98.25/4.96, δ 101.67/4.96, and δ 97.85/4.91 belonging to signal between H-1 and C-1 of (1↓4,6)-D-Manp(A), (1↓4)- Glcp(B), (↓1)-Glcp(C), and (1↓6)-Galp(D) groups, respectively. The signals of C2-C6 in (1↓4,6)-D-Manp(A) group were δ 77.05, δ 68.25, δ 70.39, δ 66.85, and δ 76.21, respectively (Figure 4B).
Heteronuclear Multiple Bond Correlation (HMBC) Analysis of AA-P and HO-P
The HMBC spectrum showed signals in AA-P at δ 4.09/71.75 and δ 3.96/69.32 belonging to signal between C-5 and H-3 of (1↓6)-Galp(A) and (1↓4,6)-Glcp(B), respectively (Gorodnicheva et al., 2021). The signal δ 3.62/69.74 belonged to signal between C-6 and H-4 of (1↓6)-Galp(C), signal δ 4.88/70.80 belonged to signal between C-3 and H-1 of (1↓4)-Arap(D), and signal δ 3.41/75.58 belonged to signal between H-4 and C-2 of (↓1)-Glcp(E) (Hongqing et al., 2018) (Figure 4C).
The HMBC spectrum showed signal in HO-P at δ 5.03/68.25, δ 4.96/68.74, and δ 4.91/69.13 belonging to signal between C-3 and H-1 of (A)(1↓4,6)-D-Manp, (C)(↓1)-Glcp, and (D)(1↓6)-Galp, respectively, and signal (δ 4.00/72.88) belonging to signal between C-5 and H-3 of (1↓4)-Glcp(B) (Figure 4D).
AA-P was composed of Ara, Gal, and Glu (1:3:2), and its structure was made of (1↓4,6)-Glup, (1↓4)-Arap, and (1↓6)-Galp. The 4-O of the (1↓4,6)-glucose of the AA-P main chain was connected to a 1↓)-Glup (Figure 4E).
HO-P was made of Man, Gal, and Glu (1:1:2) with structure made of (1↓4)-Arap, (1↓4,6)-Glup, and (1↓6)-Galp. Two mannose residues 4-O on the main chain were each connected to a↓1) glucose residue (Figure 4F).
T Cells Proliferation Activity of AA-P and HO-P In Vitro
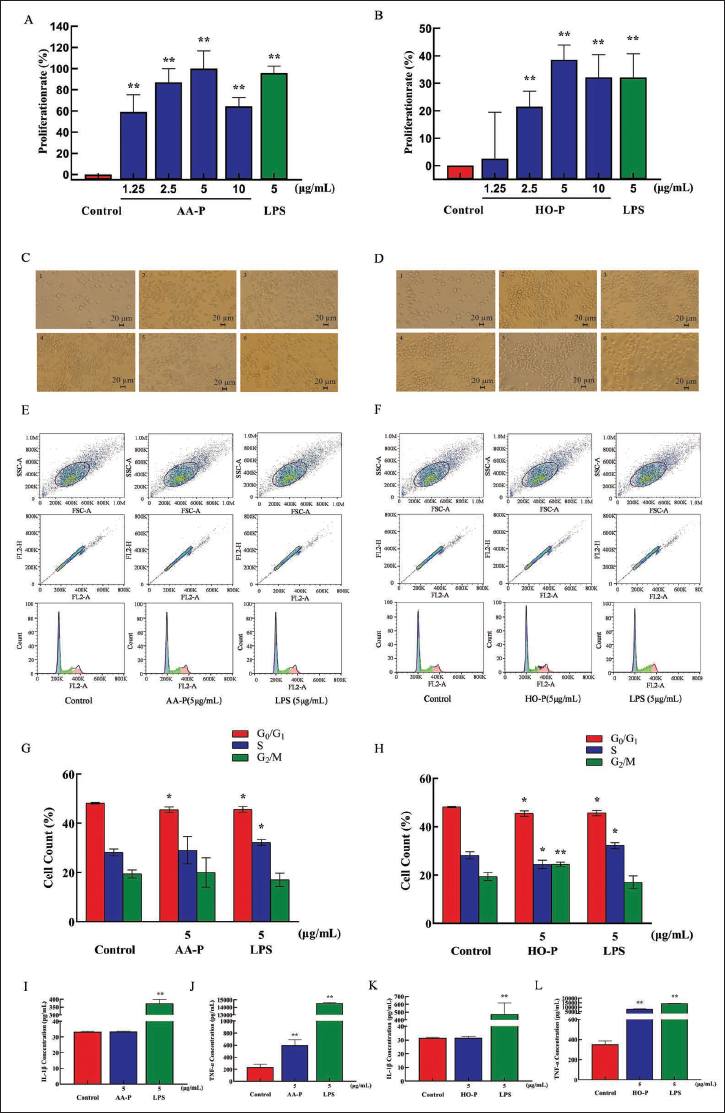
The T cell proliferation efficiency increased by 49.12% (10 µg/mL AA-P) and 35.80% (15 µg/mL HO-P), respectively (Figure 5A and B). The morphological results of T cells activated by polysaccharides showed that the shape of T cells is round, and the number of T cell clusters has also increased (Figure 5C and D).
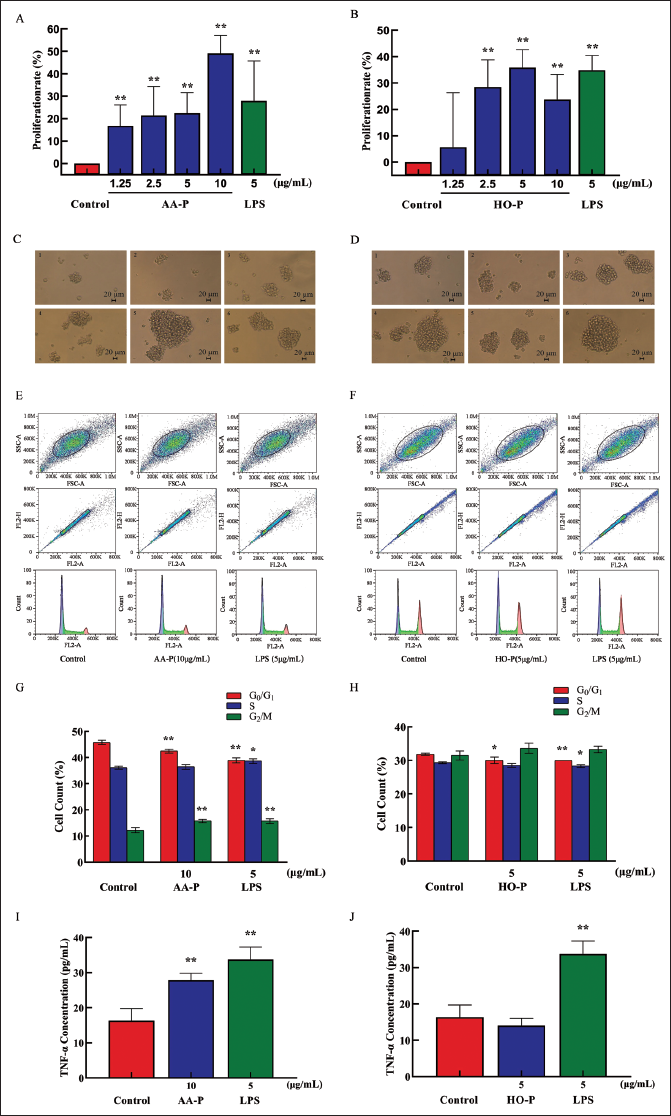
The cell number percentage in the G0/G1 phase of the AA-P group (10 µg/mL) and positive group both significantly reduced (p < 0.01), which were 42.47% and 38.93%, respectively, while G0/G1 phase cell numbers of the control group were 45.77%. Meanwhile, the cell number percentage in the G2/M phase of the AA-P group and positive control group increased to 15.77% and 15.73%, respectively (p < 0.01), while that in the blank group was 12.23%. These results indicated that AA-P could promote T cells entering from the G0/G1 to the G2/M phase. The cell number percentage in the G0/G1 of the HO-P group (5 µg/mL) and positive group both significantly reduced (p < 0.01), which were 30.03% and 30.00%, respectively, while that in the blank group was 31.83%. HO-P could only affect the G0/G1 phase and had no significant effect on the G2/M and S phases of T cells (Figure 5E–H).
The proliferation results showed when AA-P and HO-P were 10 and 5 µg/mL, respectively, the T cells stimulating effect were the best. The results showed AA-P (10 µg/mL) could stimulate T cells to secrete TNF-α with an amount of 27.86 pg/mL (p < 0.01), which was lower than the positive group (33.74 pg/mL) (Figure 5I). But when HO-P was 5 µg/mL, it could not stimulate T cells to secrete TNF-α (Figure 5J).
B Cells Proliferation Activity of AA-P and HO-P In Vitro
The results showed that polysaccharide AA-P led to the B cell proliferation with proliferation rates as 22.06%, 24.66%, 28.13%, and 32.47%, respectively. When AA-P was 10 µg/mL, B cell proliferation efficiency increased by 32.47% (AA-P: 10 µg/mL), which is higher than the LPS group (5 µg/mL, 30.86%) (Figure 6A). The B cell proliferation rate was 37.35% and 35.38%, respectively, when LPS and HO-P were both 5 µg/mL. When HO-P is 2.5 µg/mL, the efficiency of B cell proliferation reaches the maximum of 48.61% (Figure 6B–D).
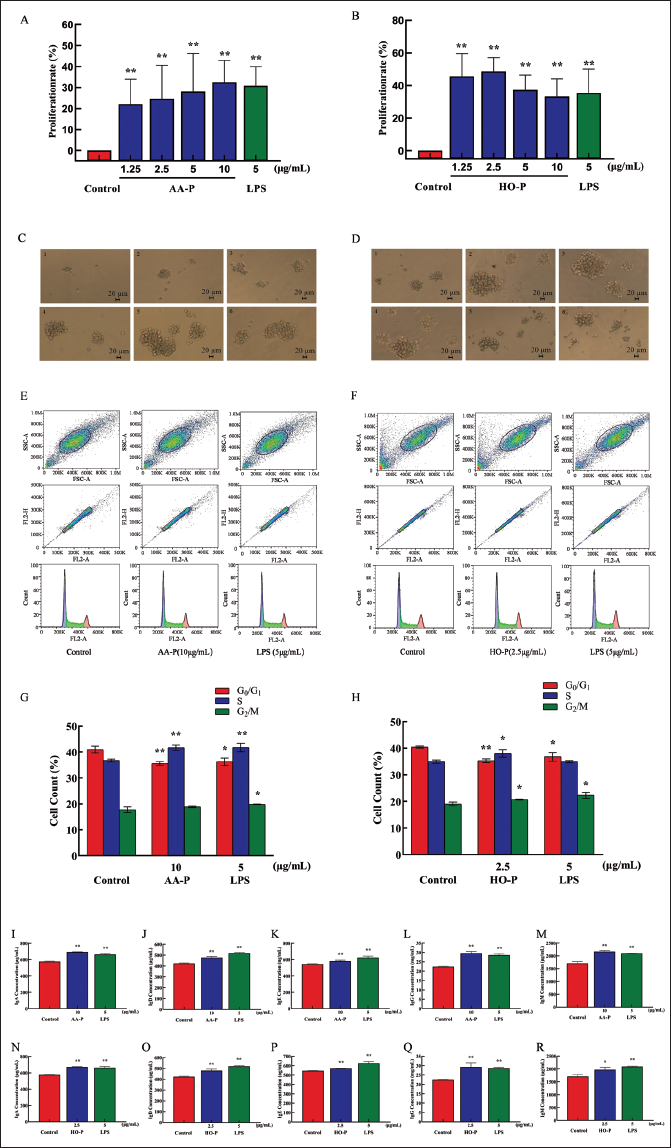
Compared with the control group (cell number in G0/G1 phase: 40.97%), both the cell number percentage in G0/G1 phase of AA-P and positive control group reduced (p < 0.01), which were 35.60% and 36.27%, respectively. Meanwhile, compared with the control group of cell numbers in the S phase (36.77%), the S phase cell number percentage of AA-P and positive control group increased to 41.67% and 41.47%, respectively (p < 0.01). However, AA-P had a little impact on the G2/M phase of B cells. These results indicated that AA-P promoted B cells entering from the G0/G1 to the S phase. Compared with the control group of G0/G1 phase cell numbers (40.43%), G0/G1 phase cell number percentage in HO-P and positive control group both reduced (p < 0.01), which were 35.30% and 36.77%, respectively. Meanwhile, compared with the control group of G2/M phase cell numbers (19.07%), the G2/M phase cell number percentage of AA-P and positive control group increased to 20.70% and 22.33%, respectively (p < 0.01). Compared with the control group of S phase cell numbers (35.00%), the S phase cell number percentage of the HO-P group increased to 38.07% (p < 0.01). These results indicated that HO-P promoted B cells entering from the G0/G1 to the S and G2/M phases (Figure 6E–H).
Both AA-P and positive control groups could promote IgA (694.39 µg/mL), IgD (477.68 µg/mL), IgE (582.66 ng/mL), IgG (29.57 mg/mL), and IgM (2,169.18 µg/mL) secretion of B cells (p < 0.01) (Figure 4I–M), and both HO-P and positive control groups could also significantly (p < 0.01) promote IgA, IgD, IgE, IgG, and IgM secretion with amounts 671.81 µg/mL, 479.15 µg/mL, 571.11 ng/mL, 29.23 mg/mL, and 1,966.69 µg/mL, respectively, and the amount of IgA, IgM, and IgG in AA-P was higher than the positive control group (Figure 6N–R).
RAW264.7 Cells Proliferation Activity of AA-P and HO-P in vitro
AA-P (5 µg/mL) could promote the RAW264.7 cells proliferation (p < 0.01) (the maximum proliferation rate: 99.90%) (Figure 7A). Compared with the control group, when HO-P were 2.5, 5, 10 µg/mL, RAW264.7 cells proliferation rates were also increased (p < 0.01) (the proliferation rate was 21.45%, 38.59%, and 32.14%, respectively). When both LPS and HO-P were 5 µg/mL, the proliferation efficiency was 38.59% and 32.09%, respectively (Figure 7B). Morphological changes of RAW264.7 cells under AA-P and HO-P stimulation showed that the numbers of RAW264.7 cells in the polysaccharide group and LPS group increased, and the cell space became smaller (Figure 7C and D).
Compared with the control group, G0/G1 phase cell numbers (48.17%), the G0/G1 phase cell number percentage in AA-P and positive control group both reduced (p < 0.01), which were 45.50% and 45.67%, respectively. AA-P had no significant effect on the G2/M phase and S phase of RAW264.7 cells. It indicated that AA-P could promote RAW264.7 cells to quickly finish the G0/G1 phase in the cell cycle. Compared with the control group, G0/G1 phase cell numbers (48.17%), G0/G1 phase cell number percentage in HO-P and positive control group both reduced (p < 0.01), which were 45.50% and 45.67%, respectively. Meanwhile, compared with the control group of cell numbers in the G2/M phase (19.43%), the G2/M phase cell number percentage of the HO-P group increased to 24.47% (p < 0.01). It indicated that HO-P could promote RAW264.7 cells entering from the G0/G1 and S to the G2/M phase in the cell cycle of RAW264.7 (Figure 7E–H).
Both AA-P (5 µg/mL) and positive control group promote TNF-α secretion of RAW264.7 cells (p < 0.01), with amounts of 602.12 and 14,558.57 pg/mL, respectively, which were 2.55 and 61.55 times of blank group, respectively, but interleukin (IL)-1β secretion in AA-P group was not statistically significant, while the positive group could promote IL-1β secretion in RAW264.7 cells, with secretion amount of 373.75 pg/mL (p < 0.01) (Figure 7I and J). Both HO-P (5 µg/mL) and the positive group could promote TNF-α secretion from RAW264.7 cells (p < 0.01) with amounts of 7,819.30 and 14,182.14 pg/mL, respectively, which were 22.16 and 40.20 times of blank group, respectively, but IL-1β secretion in HO-P group was not statistically significant neither, while the positive group could significantly (p < 0.01) promote IL-1β secretion in RAW264.7 cells with amount of 475.79 pg/mL (Figure 7K and L).
Discussion
The molecular weight of polysaccharides, the composition of sugar units, the type of glycosidic bonds, the configuration of the main chain, the spatial configuration of the branches, and the types and quantities of substituents are related to their biological activity (Ghozlan et al., 2015). If the molecular weight of polysaccharides is too high, which leads to low water solubility, then it is very difficult for them to pass through the cell membrane, which results in their low biological activity (Ding et al., 2022). However, if the molecular weight of polysaccharides is too low, then they will also lose their biological activity. Polysaccharides with a molecular weight of 10,000–50,000 Da have strong immune activity (Supatra & SangGuan, 2011). Meanwhile, the polysaccharides are connected by (1-4) or (1-3) glycosidic linkage, which makes it easy to form a three-strand helical stereo configuration. The biological activities are lower if the skeleton is linked by (1↓6) or other bonds (Reinhold et al., 1995). For example, polysaccharides from both Polyporus umbellatus and Lentinus edodes have the structural feature of using D-glucose residues connected by (1 ↓ 3) bonds as the backbone, while polysaccharides from Coriolus versicolor use β -(1-4)-
The basic function of the immune system is to recognize “self” and “nonself.” The recognition of invaders is the beginning of immune defense, ultimately triggering the effector response system, including phagocytosis, encapsulation, activation of protease cascade reactions and blackening, as well as induction of antimicrobial peptide synthesis, in order to clear or eliminate invaders (Binder et al., 2005; Heon et al., 2005; Mantovani et al., 2002; Pawlowski et al., 1999). MAPKs are a conserved class of serine/threonine protein kinases within immune cells, such as B cells, T cells, and macrophages, which are intracellular signaling enzymes closely related to immune cell proliferation, differentiation, or apoptosis (Benhamou et al., 1995). The MAPKs in immune cells mainly include three subclasses: ERKs, JNKs/SAPKs, and p38MAPK (Benhamou et al., 1995; Yu et al., 2022). CD14 and CR3 activate phospholipase C (PLC) after binding to polysaccharides for recognition, producing PKC and PI3K, phosphorylating MAPKs, promoting gene transcription by enhancing the deoxyribonucleic acid (DNA) binding activity of AP-1, which regulate the immune cells proliferation and differentiation and regulating gene expression of various immune factors, such as inducible nitric oxide synthase (iNOS), TNF-α, and IL-1β. AA-P and HO-P could both mainly by reducing G0/G1 phase, which leads to the significant proliferation of B cells and RAW264.7 cells, respectively. At the same time, AA-P and HO-P could significantly stimulate the NF-α secretion of T cells, IgA, IgD, IgE, IgG, and IgM secretion of B cells and TNF-α secretion of RAW264.7 cells, but neither of them could stimulate IL-1β secretion of RAW264.7 cells.
Conclusion
New polysaccharides were extracted from H. olivaceoalbus (HO-P) and A. aegerita (AA-P), respectively. The HO-P consisted of (1↓6)-Galp, (1↓4)-Glup, (↓1)-Glup, and (1↓4,6)-D-Manp with the ratio of mannose, galactose, and glucose as 1:1:2. The AA-P consisted of (1↓4,6)-Glup, (1↓4)-Arap, and (1↓6)-Galp with the ratio of galactose, glucose, and arabinose as 3:2:1. AA-P has a better effect on RAW 264.7 cells and T cells than HO-P. Structurally, AA-P has a smaller molecular weight, better branching degree, and better solubility. This configuration is more conducive to forming a more excellent triple-helix, three-dimensional configuration, thereby exhibiting higher immune activity. The polysaccharides immunomodulatory activity is related to their chemical structure. Further study on the relative molecular weight regions of polysaccharides exerting immunomodulatory activity, monosaccharides types, glycosidic bond types, chemical modification methods, and advanced conformations is of great significance for revealing its structure–activity relationship and developing more effective analogs or derivatives as new medicine for disease treatment.
Abbreviations
13C-NMR: 13C nuclear magnetic resonance spectroscopy; 1H-NMR: 1H nuclear magnetic resonance spectroscopy; 1H-1H COSY: 1H-1H correlation spectroscopy; 2D-NMR: Two-dimensional nuclear magnetic resonance spectroscopy; AA-P: The polysaccharides from Agrocybe aegerita; DEAE 52 cellulose: Diethylaminoethyl cellulose 52 cellulose; FTIR: Fourier transform infrared spectroscopy; GC–MS: Gas chromatography–mass spectrometry; HMBC: Heteronuclear multiple bond correlation; HMQC: Heteronuclear multiple quantum correlation; HO-P: The polysaccharides from Hygrophorus olivaceoalbus; HPGPC: High-performance gel permeation chromatography; HPLC: High-performance liquid chromatography; IR: Infrared spectrum; LPS: Lipopolysaccharide.
Footnotes
Acknowledgments
None.
Declaration of Conflict of Interests
The authors declared no potential conflicts of interest with respect to the research, authorship, and/or publication of this article.
Ethical Approval and Informed Consent
None.
Funding
The author(s) disclosed receipt of the following financial support for the research, authorship, and/or publication of this article: This research was funded by the Support Project of Sichuan Provincial Department of Science and Technology (23ZHSF0082, 22ZYZFSF0009, 2022NZZJ0003, and 2022NSFSC0107), the China West Normal University National Cultivation Project (20A006) and the Dazhou School Enterprise cooperation project (2021-S05).