
Abstract
Objectives
The objective of this study was to investigate the impacts and mechanisms of Picroside II on hepatocellular carcinoma (HCC).
Materials and Methods
The GeneCards database was mined for HCC-related targets. The targets of Picroside Ⅱ were predicted using PharmMapper and SwissTarget Prediction. The molecular complex detection (MCODE) plugin in Cytoscape was used to screen core genes. The DAVID database was subsequently used to enrich the core targets by Gene Ontology (GO) and the Kyoto Encyclopedia of Genes and Genomes (KEGG), which was used to determine the possible mode of action of Picroside II on HCC. Gene Expression Profiling Interactive Analysis 2 (GEPIA2) examined core targets and patient mortality. Auto Dock 4.2.6 was used to simulate the docking of potential targets with Picroside II. Then, surface plasmon resonance (SPR) was used to validate the targets’ docking ability. Finally, Western blotting and in vitro experiments were used to evaluate the effect of Picroside II on HepG2 cells.
Results
The result of network pharmacology showed that 94 genes may be possible targets for Picroside II treating of HCC, with GPI, LGALS3, SRC, HRAS, HSP90AA1, MMP9, PPARG, SERPINE1, and VEGFA being the most promising. GPI and Picroside II have strong virtual docking capabilities, and SPR tests verified their binding ability. In vitro studies revealed that Picroside II could suppress HepG2 cell migration. It has been demonstrated that Picroside II can stop tumors from migrating by attaching to the glycolytic proteins GPI and suppressing the downstream glycolytic pathway proteins ALDOA and GAPDH. Picroside II’s potential new target for treating tumors is GPI.
Conclusion
The results of this study suggest that Picroside Ⅱ can affect glucose metabolism by binding to glycolytic protein GPI and that this protein is a potential new target for Picroside Ⅱ in the treatment of tumors.
Keywords
Introduction
Hepatocellular carcinoma (HCC) is the most common primary liver cancer (Forner et al., 2018). Cancer cells frequently exhibit abnormal energy metabolism. Some researchers have conducted therapeutic studies targeting energy metabolism in cancer cells in recent years, and therapeutic interventions on some key enzymes of sugar, amino acid, and lipid metabolism have yielded promising results (Vander Heiden et al., 2009). In particular, medicinal research focusing on glycolysis is significant (Chelakkot et al., 2023; Deberardinis et al., 2008). We must be aware of the Warburg effect when discussing glycolysis. In normal tissues, the mitochondrial oxidative phosphorylation pathway generates approximately 90% of ATP, while the glycolytic pathway generates only 10% (Gillies & Gatenby, 2007). Furthermore, even in aerobic conditions, tumor cells prefer to provide energy and produce lactate via the glycolytic pathway, a phenomenon known as the Warburg effect. Some key enzymes in glucose metabolism play an important role in the Warburg effect. These adjustments to important enzymes can impact tumor cells’ levels of glucose uptake, glycolytic capability, and energy production, further influencing tumor growth and development (Horwitz et al., 2014).
The second step of glycolysis is carried out by the enzyme glucose-6-phosphate isomerase (GPI), which also catalyzes the interconversion of fructose- and glucose-6-phosphate during gluconeogenesis. Due to its function in intracellular glucose metabolism and external cytokine activity, it is also known as an autocrine motility factor. Many secretory cytokines with cytomotor-inducing capabilities control tumor cell motility in an autocrine and/or paracrine way (Lázár-Molnár et al., 2000; Stoker & Gherardi, 1991). One of the main cell motility-stimulating substances AMF is associated with tumor growth (Kim & Dang, 2005), poorer patient prognoses for many tumor types, and more aggressive tumor growth (Dang & Semenza, 1999; Kathagen-Buhmann et al., 2018).
Picrorhiza scrophulariiflora Pennell is one of the most significant medications for treating deficient fever. Picroside II, an irisin, is one of its key active components (Ma et al., 2020). Picroside II has antioxidant and anti-inflammatory properties (Li et al., 2015; Wang L. et al., 2015; Wang T. et al., 2015). By reducing intracellular production of inflammatory chemokines and reactive oxygen species, Picroside II inhibited the activation of hepatic stellate cells and reduced the deposition of extracellular matrix (Li et al., 2010; Wu et al., 2014; Zhang et al., 2016).
Network pharmacology, a young discipline of study, employs the idea of systems biology to create multi-target therapeutic compounds by analyzing the network structure of biological systems and selecting specific signaling nodes. It could explain the pharmacological mechanisms for drugs treating complex diseases through multi-component, multi-target, and multi-pathway (Nogales et al., 2022; Xia & Tang, 2021).
The surface plasmon resonance (SPR) technique was created using optical principles. It relies on the detection of minute variations in the refractive index of a medium immediately surrounding a metal surface, where the refractive index is transformed into resonance or response units that react to particular signals of interactions between biomolecules (Douzi, 2017). SPR is a technique for studying biomolecular interactions in real time and dynamically, including protein–protein, protein–nucleic acid, and novel drug molecule–target protein interactions (Safina, 2012).
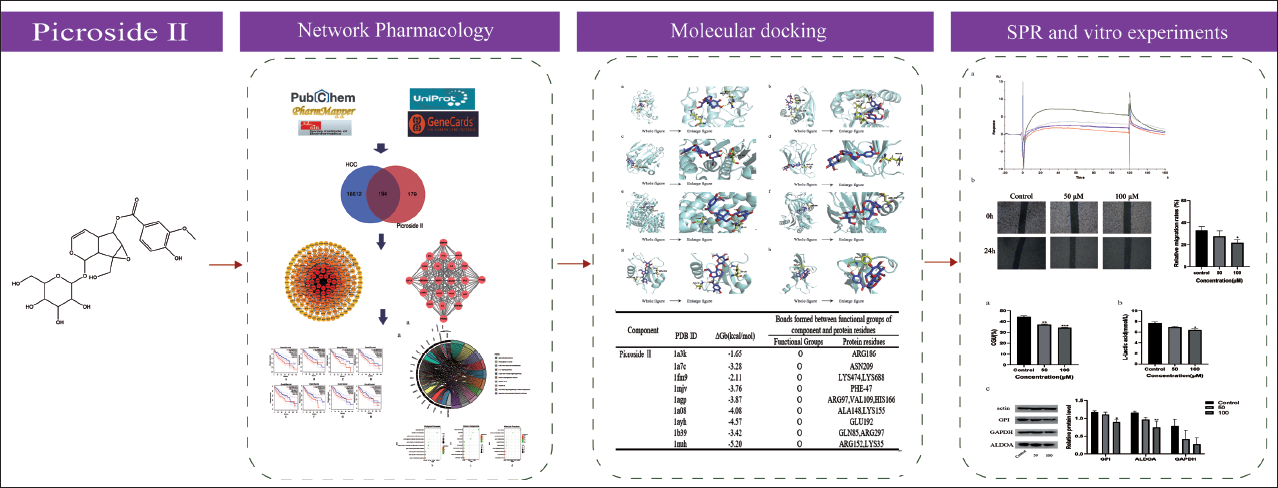
In this study, network pharmacology was applied for the first time to examine Picroside II’s anti-HCC’s key targets and signaling pathways. Molecules binding to proteins were confirmed using molecular docking and SPR. Likewise, in vitro tests further showed that Picroside II restricted hepatocellular glycolysis by specifically targeting GPI. The overall flowchart of this study is shown in Figure 1.
General Workflow of Network Pharmacology and Molecular Docking in This Study.
Materials and Methods
Target Prediction
PharmMapper (
Candidate Target Collection
The GeneCards database (
Enrichment Analysis
For GO and KEGG enrichment analysis (Kanehisa, 2019; Kanehisa et al., 2023; Kanehisa & Goto, 2000), candidate targets were imported into the Database for Annotation, Visualization, and Integrated Discovery (DAVID) database (
Key Target Screening
Cytoscape 3.8.2 is a powerful network visualization and building software (Shannon et al., 2003). The MCODE plugin in Cytoscape 3.8.2 was used to locate important nodes in the network. Then, a PPI network was created by importing the probable targets of Picroside II into STRING.
Survival Analysis Based on GEPIA2 and the Kaplan–Meier Plotter
GEPIA2 is a Web-based tool that provides fast and customizable functionality based on TCGA and GTEx data (Tang et al., 2017). The GEPIA2 database was utilized in this work to examine the expression of potential genes in LIHC and healthy tissue. Also, GEPIA2 underwent an overall survival study based on the expression of these genes. The potential targets were added to GEPIA2, and a survival analysis based on gene expression status was run.
Molecular Docking
The Autodock 4.2.6 molecular docking software uses flexible docking. The pre-docking program for proteins and small molecules is called PyMOL2.2.0. Tens of thousands of genomic targets are listed in the RSCB PDB database (
Reagent Consumables
GPI protein (ab208311) was purchased from Abcam (Cambridge, UK). HepG2 cells were obtained from Procell (Wuhan, China). The cells were cultured in RPMI-1640 complete medium (Procell, Wuhan, China). Cells were incubated at 37℃ under 5% CO2 in a humidified atmosphere. Picroside Ⅱ (AF20060702) was purchased from ALFA (Chengdu, China). Antibodies against GPI (1:1000 dilution), antibodies against ALDOA (1:1000 dilution), and antibodies against ACTIN (1:10000 dilution) were from ABclonal Technology. Antibodies against GAPDH (1:10000 dilution) were from Cell Signaling Technology.
SPR Technology
The SPR experiments were conducted using the Biacore T200 SPR instrument (GE Healthcare Life Sciences, Uppsala, Sweden). Channel 1 of the CM5 (GE Healthcare Life Sciences, Uppsala, Sweden) chip is the reference channel, and channels 2–4 are the detection channel. GPI protein was diluted with 10 mM sodium acetate solution with pH of 4.0, 4.5, 5.0, and 5.5 to the final concentration of 20 µg/mL for pH exploration. It was diluted with sodium acetate solution at appropriate pH to a final concentration of 20 µg/mL and then coupled to the detection channel by EDC/NHS (GE Healthcare Life Sciences, Uppsala, Sweden) crosslinking reaction. Before coupling, the CM5 chip was activated with EDC/NHS solution for 7 minutes, then protein coupling was performed for 10 minutes, and the protein flow rate was 10 L/min.
Finally, ethanolamine (GE Healthcare Life Sciences, Uppsala, Sweden) was used to seal the unreactive active site of the chip for 7 min. At the same time, control channels were also sealed with ethanolamine. Picroside II solution was prepared and placed on the sample rack at concentrations of 1, 25, 100, and 250 µM, respectively. To select a sample location, click Sample Injection. Set contact time and wait time, and click regeneration injection. The response value of channel 1 determines whether Picroside II is combined with the chip surface. The comparison and assessment of the response values RU and R(Max) of the analyte on the chip surface serve as the foundation for the Kd value determination.
Cell Scratch Assay
To find out how Picroside II affects cell migration, a cell scratch assay was conducted. HepG2 cells were seeded into six-well plates (5 × 10⁵ cells/well) and cultured until fully paved. The cells were then scratched and washed with phosphate-buffered saline (PBS) to remove floating cells. Cells were treated with Picroside II for 24 h. Representative images were taken under a microscope at 40× magnification at indicated times. Cell mobility = (scratch area S0h – scratch area S24h)/scratch area S0h × 100% (Kramer et al., 2013).
Determination of Glucose and Lactate Metabolic Rates
HepG2 cells were treated with 0, 50, and 100 µM Picroside II for 24 h. The concentrations of glucose and lactate in the culture medium were determined using a Model 680 automated enzyme labeler from BIO-RAD, USA. Glucose consumption and lactate production were calculated based on the concentrations at the beginning and end of the incubation.
Western Blot
Different concentrations of Picroside II were incubated with HepG2 cells, and total proteins were extracted. The protein samples were sampled onto SDS-PAGE gel, transferred to PVDF membrane, closed with skim milk powder solution, and incubated with primary antibody and secondary antibody, respectively. Finally, the bands were visualized by chemiluminescence (ECL, Meilunbio, Dalian).
Statistical Analysis
Statistical significance was assessed using the one-way ANOVA. The statistical value p<0.05 indicates that the difference is statistically significant. GraphPad Prism 8.0 was also used for statistical analysis.
Results
Collection of Candidate Targets
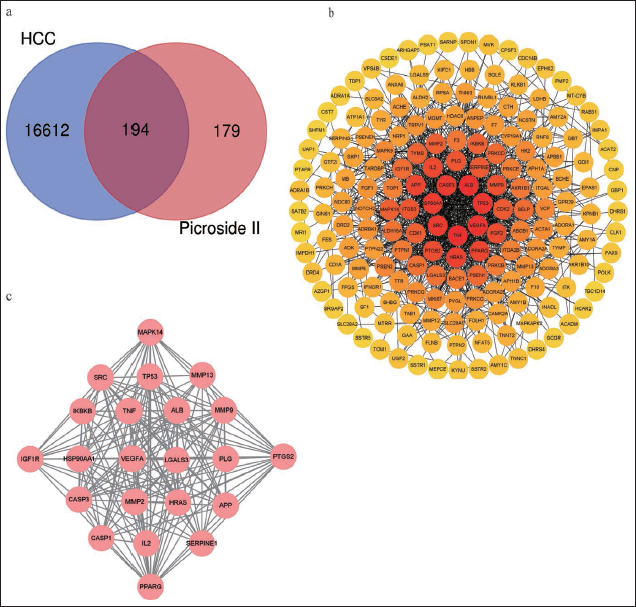
A total of 378 Picroside II-related targets were searched, including 268 from the Pharmmapper database and 110 from the SwissTargetPrediction database. The Genecards database had 16808 targets connected to liver cancer. Of the Picroside II- and liver cancer-related targets, 194 common targets were identified and considered potential therapeutic targets of Picroside II used in the treatment of liver cancer, as shown in the Venn diagram (Figure 2 a).
Topological Network construction
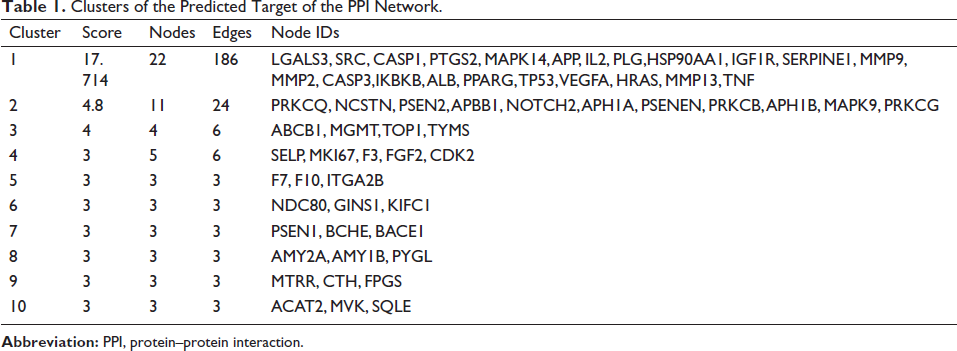
A total of 194 intersection targets were entered into the STRING database, constructed into the intricate PPI network, and then displayed using Cytoscape (Figure 2 b). The Cytohubba plugin could make each node highlight with a varied color depth depending on the degree value of each node. Ten clusters were formed for the anticipated target network by MCODE plug-in cluster analysis, as shown in Table 1. With 22 nodes and 186 edges, Cluster 1 was the most significant with a score of 17.714, with a solid potential for predicting core genes (Figure 2 c).
Clusters of the Predicted Target of the PPI Network.
Enrichment Analysis Results
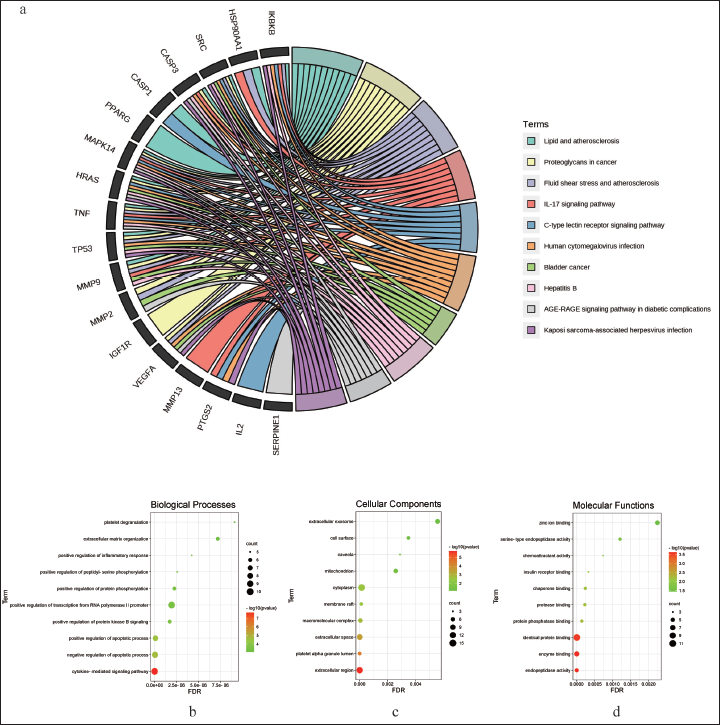
Based on the definition of MCODE, we imported 22 genes contained in cluster 1 into the DAVID database for GO and KEGG enrichment analysis. The GO analysis was divided into three categories: BP, MF, and CC. We selected the top 10 pathways in each category for display. The results are shown in a bubble chart. The bubble size and color indicate the enrichment gene and p-value, respectively. A darker color indicates a smaller p-value, a larger bubble, and a higher number of enriched therapeutic genes within that GO item, indicating that the identified GO term is more strongly associated with the treatment of liver cancer than other GO terms. Chord diagrams are used to depict the KEGG results. KEGG enriches multiple signaling pathways, including human cytomegalovirus infection, PI3K-Akt signaling pathway, pathways in cancer, human papillomavirus infection, and human cytomegalovirus infection (Figure 3 a). As shown in Figure 3 b, the functions of BP include cytokine-mediated signaling pathway, negative regulation of apoptotic process, positive regulation of apoptotic process, positive regulation of protein kinase B signaling, and positive regulation of transcription from RNA polymerase II promoter. CC includes the extracellular region, platel et alpha granule lumen, extracellular space, macromolecular complex, and membrane raft (Figure 3 c). MF contains endopeptidase activity, enzyme binding, identical protein binding, protein phosphatase binding, protease binding, chaperone binding, insulin receptor binding, chemoattractant activity, serine-type endopeptidase activity, and zinc ion binding (Figure 3 d).
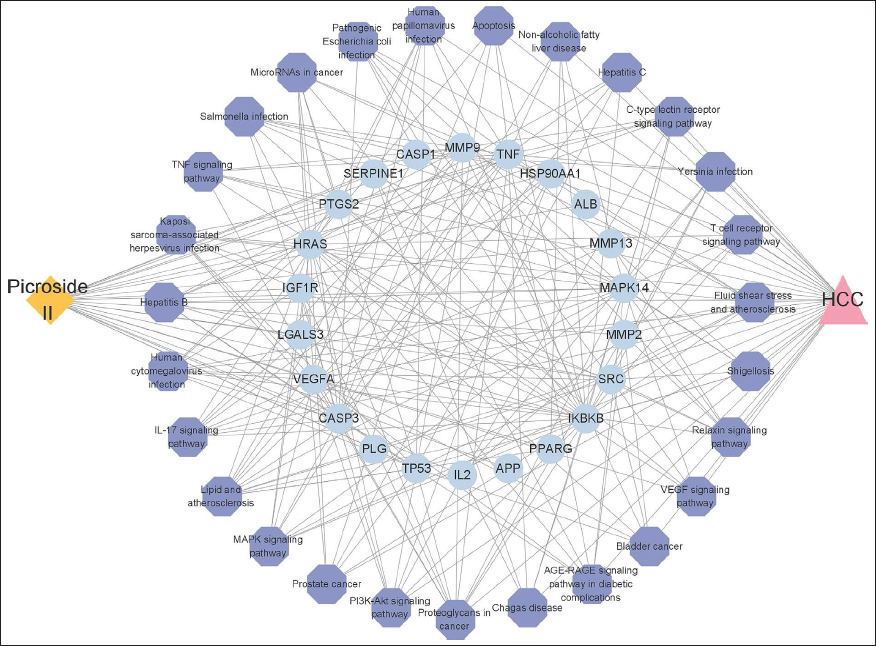
“C-T-P-D” (Component-target-pathway-disease) Network Construction
To further elucidate the molecular mechanism of Picroside II against liver cancer, a C-T-P-D network was constructed based on the candidate genes and their corresponding significant signaling pathways. As shown in Figure 4, a “C-T-P-D” network contains 54 nodes (Picroside II, 22 targets, 30 pathways, and HCC) and 236 sides. These nodes have different colors and shapes, among which orange represents Picroside II, blue represents a target, purple represents a pathway, and red represents disease. The relationship between nodes is indicated by a variety of edges.
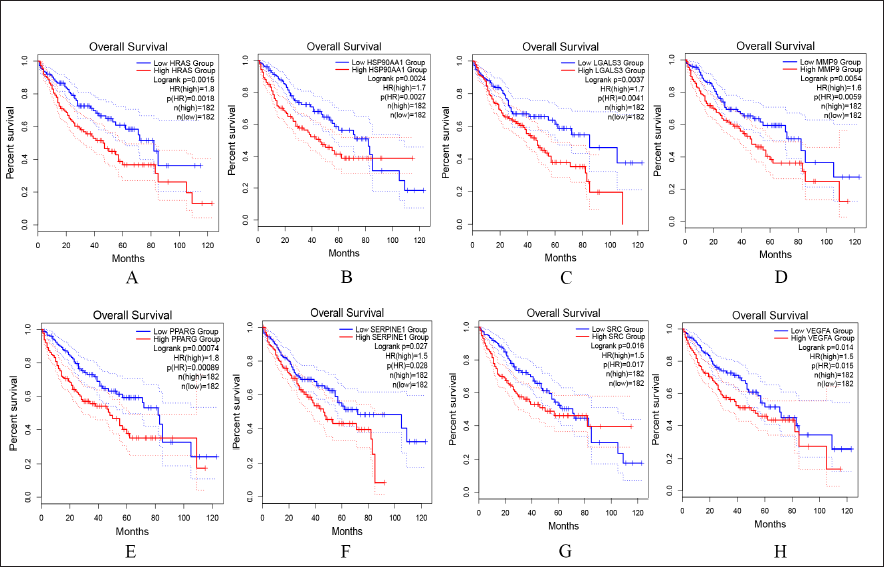
Potential Targets of Picroside Ⅱ Affect Overall Survival in Patients with HCC
In addition to their capacity to control specific metabolic or physiological processes, genes’ regulatory roles in the development of liver cancer can also be seen in how variations in gene expression affect the patient’s lifespan. To investigate the prognostic value of candidate genes, the GEPIA2 bioinformatics analysis platform was used, with a total of 364 HCC patients available for overall survival analysis. We found p < 0.05 for the eight genes shown in Figure 5, which were associated with adverse overall survival in HCC patients. These genes are important guidelines for the progression and treatment of liver cancer patients, and their use as potential targets for drug development may help to shorten the development cycle of new drugs.
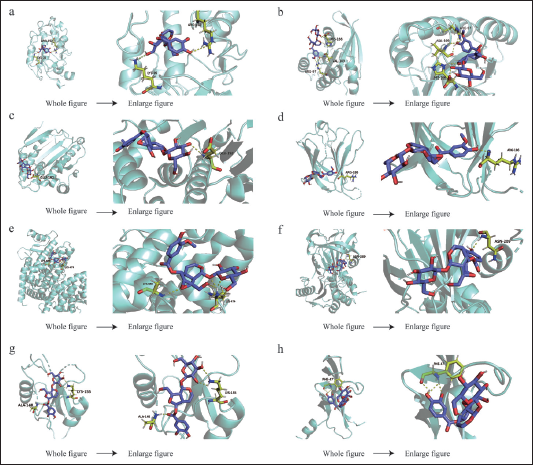
Molecular Docking Analysis
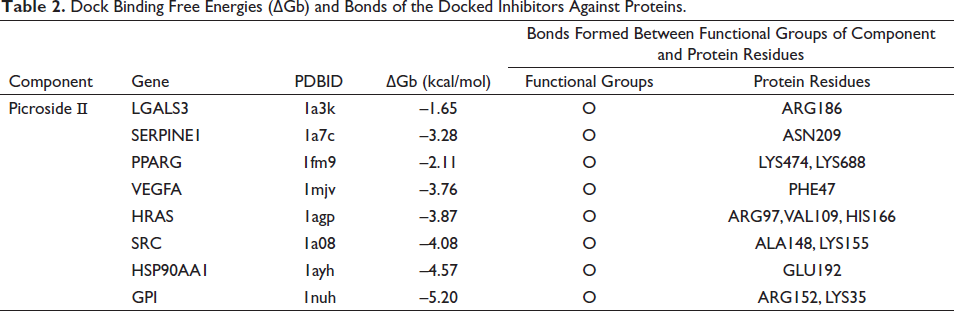
It is generally agreed upon that the binding energy decreases with increasing affinity and degree of binding of a small molecule ligand to a protein receptor. Less than 0 kJ/mol of binding energy indicates spontaneous binding between the ligand and the receptor, while less than –5 kJ/mol of binding energy indicates tight binding between the ligand and the receptor. The above eight genes and GPI were, respectively, docked with Picroside Ⅱ. Through the analysis of the docking results (Table 2), it was interesting to find that GPI had the highest docking score. Additionally, Picroside Ⅱ interacted with specific residues by forming hydrogen bonds between residues including ARG186 of LGAL53; ASN209 of SERPINE1; LYS474 and LYS688 of PPARG; PHE47 of VEGFA; ARG97, VAL109, and HIS166 of HRAS; ALA148 and LYS155 of SRC; GLU192 of HSP90AA1; and ARG152 and LYS35 of GPI. These results suggest that Picroside Ⅱ may play a role in inhibiting HCC. Picroside Ⅱ binds to target proteins mainly in the form of hydrogen bonds and hydrophobic interactions. A 3D image of the docking result is shown in Figure 6.
Dock Binding Free Energies (∇Gb) and Bonds of the Docked Inhibitors Against Proteins.
SPR Experiment
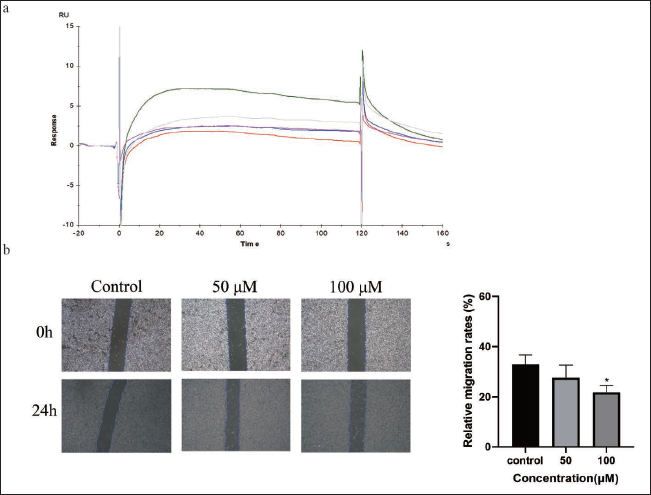
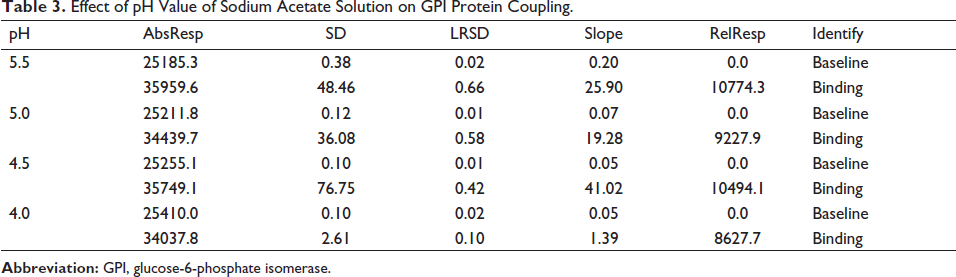
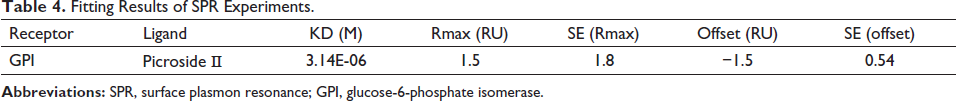
Molecular docking results indicated that Picroside Ⅱ had the highest docking score with GPI. Validation experiments were carried out utilizing the SPR technique to further establish the binding of GPI proteins to the medication. In the SPR experiment, the GPI protein was immobilized in a molecular chip by covalent bonding, and Picroside Ⅱ was passed through the chip as a solution. Then the binding energy was measured. The sodium acetate solution with a pH of 4.5 was chosen as the diluent of GPI, and the GPI protein was immobilized by diluting the GPI protein to 20 g/mL. Based on the response value (RelResp) and slope of the curve (Slope), it was discovered that the slope of the binding curve and the response value of GPI and microarray were higher when the pH of the sodium acetate solution was 4.5 (Table 3). As is shown in Figure 7a and Table 4, the results showed that the Kd value of Picroside Ⅱ and GPI was 3.14 µM. The Kd value estimation is based on the comparison and judgment of the response value RU and R(Max) of the analyte on the chip surface. A smaller value of Kd indicates a stronger affinity.
Effect of pH Value of Sodium Acetate Solution on GPI Protein Coupling.
Fitting Results of SPR Experiments.
Picroside II Suppressed Cancer Cell Migration in vitro
Cell migration plays an important role in a variety of cellular physiological and pathological processes (Trepat et al., 2012), including tumor metastasis (Friedl & Mayor, 2017). By scratching a cell monolayer and observing the results under a microscope, the cell scratch assay is a laboratory technique for examining cell migratory motility, repair capability, and cell–cell interactions. When doing a scratch assay, the condition and density of the cells are very crucial. The fusion of HepG2 cells was cut into a single layer to form a wound and cultured in the presence or absence of various concentrations of Picroside Ⅱ. As shown in Figure 7 b, Picroside II (50 and 100 µM) inhibited the migration of HepG2 cells. In the control group, the relative migration rates of 50 and 100 µM were 32.78 ± 3.75%, 27.52 ± 5.00%, and 21.75 ± 2.66%.
Picroside II Targeted GPI to Inhibit Tumor Glycolysis
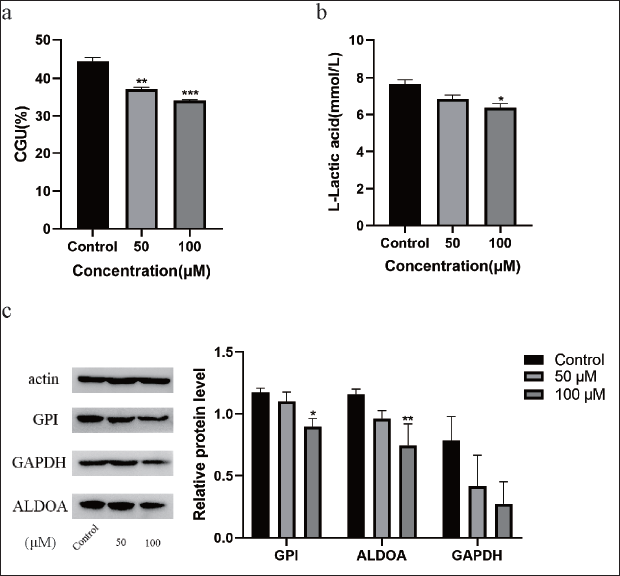
Picroside II had an inhibitory effect on GPI through cellular glucose consumption and lactate production responses. The results showed that Picroside II depressed cellular glucose consumption and lactate production (Figure 8 a and b). The protein received inhibition upon binding to small molecules. To determine whether Picroside II and GPI together impede glycolysis, an effort was undertaken to comprehend how GPI expression affects glycolysis. A number of enzyme processes are involved in glycolysis. Through the glucose transporter protein, glucose enters the cell, where it is phosphorylated into glucose-6-phosphate by hexokinase-2 and isomerized into fructose-6-phosphate (F6P) by GPI. F6P is converted to fructose 1,6-diphosphate (F1,6-DP) by phosphofructokinase, and glyceraldehyde 3-phosphate is produced from F1,6-DP by aldolase A (ALDOA). In turn, 1,3-diphosphoglycerate and 3-phosphoglycerdehyde are linked via glyceraldehyde-3-phosphate dehydrogenase (GAPDH). Following treatment, there was a tendency for GPI gene expression to decrease, which may be related to the bind of Picroside II to GPI inhibiting GPI activity. The effects of direct Picroside II binding to GPI are supported by the downregulation of the glycolytic pathway’s downstream proteins, ALDOA and GAPDH, in HepG2 cells after Picroside II injection. Additionally, the decreased glucose uptake and lactate output revealed that Picroside II’s binding to GPI would result in a decreased flow of glycolytic metabolites (Figure 8 c).
Discussion
Liver cancer was the sixth most common cancer diagnosed cancer globally with 841,000 cases and the fourth leading cause of cancer death with 782,000 deaths (Arnold et al., 2020). Hepatitis B virus, hepatitis C virus, fatty liver disease, alcohol-related cirrhosis, smoking, obesity, diabetes, iron overload, and various dietary exposures are identified as risk factors (Anwanwan et al., 2020). Treatment options for more advanced stages include the following: (a) Transarterial chemoembolization (TACE) results in a 23% improvement in the 2-year survival in comparison with conservative therapy for intermediate-stage HCC patients compared to conservative therapy. (b) Sorafenib, a kinase inhibitor, is the preferred option for late-stage cases and is orally administered. Nevertheless, fewer than one-third of patients benefit from the treatment, and drug resistance becomes apparent within 6 months of initiating the regimen (El-Serag et al., 2008).
The treatment of liver cancer using drugs such as sorafenib and lumvaritinib is limited by their propensity for drug resistance and toxicity (Cabral et al., 2020). Traditional Chinese medicine, with its multi-target and multi-pathway approach, has the potential to reduce adverse effects arising from radiotherapy and chemotherapy and improve patients’ quality of life. The Chinese herb Picrorhiza scrophulariiflora Pennell has been used for centuries as a liver-protecting herb (Rathee et al., 2013; Wang L. et al., 2015). Picroside II has been identified as its main active ingredient. Picroside II significantly reduced tumor angiogenesis, as well as cancer cell invasion and migration, implying a possible therapeutic advantage for malignant tumors (Lou et al., 2019). To determine the target with the highest docking score, GPI, we established a CT-P-D network and incorporated it with molecular docking. To determine the mechanism of action of Picroside II against HCC, we conducted a network pharmacology analysis. The conjecture was then verified through SPR, cellular, and Western blot experiments.
The study identified 194 shared targets through a comparison of component and diseased targets. The PPI network and MCODE analysis generated the top-scoring topological network. Survival analysis discovered eight genes with differences among the 22 targets in the topological network. A molecular docking study revealed that Picroside II bound with seven out of these eight genes. The best docking score was noted with GPI.
Candidate genes were found to be linked to the extracellular space, extracellular area, and cytoplasm, among others, as per GO and KEGG enrichment analyses. This association was observed in terms of protein phosphatase binding, protease binding, chemoattractant activity, and other molecular functional aspects. These were connected to key biological pathways such as apoptosis, proliferation, and cytokine-mediated signaling. Therefore, it is hypothesized that Picroside II can bind to the cell membrane proteins involved in cytokine-mediated signaling pathways, consequently hindering the proliferation and migration of tumor cells. Notably, SPR examinations verified the discoveries of network pharmacology analysis and showed that GPI binds with Picroside II in vitro. The SPR technique facilitates the real-time monitoring of the entire protein-small molecule interaction process. Picroside II’s anti-HCC activity may be mainly linked to GPI
Cancer cells can dynamically switch between two modes of glucose metabolism, glycolysis, and oxidative phosphorylation, to meet nutrient availability and energy requirements (Webster, 2003). This feature definitely assists in the growth and spread of cancer cells. Recent investigations on cancer metabolism have concentrated on the particularly high proliferation rate of cancer cells (Icard et al., 2018; Vander Heiden et al., 2009). However, the energy production that fuels the migration process (Mosier et al., 2021) is critical to the dissemination of cancer cells. Furthermore, lactate, a byproduct of glycolysis, not only promotes tumor invasion by acidifying the microenvironment but also directly encourages tumor cell motility (Goetze et al., 2011). GPI was identified as AMF in earlier molecular cloning and sequencing investigations (Watanabe et al., 1996). GPI is a critical cytoplasmic enzyme for glucose metabolism and is necessary for the pathways of glycolysis and gluconeogenesis. It catalyzes the conversion of glucose- and fructose-6-phosphate in both healthy and malignant cells (Faik et al., 1988). GPI from various malignancies is present as AMF instead of being released by normal cells (Niinaka et al., 1998; Yanagawa et al., 2005; Yanagawa et al., 2004). GPI/AMF regulates “growth and motility” behavior (Kathagen-Buhmann et al., 2018). AMF can both stimulate migration in an autocrine manner (Beckner et al., 2005; Beckner et al., 1990) and induce cell proliferation (Tsutsumi et al., 2003b). AMF stimulates cell motility through a receptor-mediated signaling pathway to stimulate cell motility (Nabi et al., 1991), and motility is the cornerstone of tumor cell migration and proliferation (Nakajima & Raz, 2020). AMF is secreted by tumor cells and has the potential to stimulate proliferation (Tsutsumi et al., 2003b), migration (Silletti et al., 1991; Watanabe et al., 1994), angiogenesis (Funasaka et al., 2001, 2002), and anti-apoptosis (Haga et al., 2003; Tsutsumi et al., 2003a). The AKT pathway is an essential signaling center that encourages glucose influx into the glycolytic and pentose phosphate pathways (Jeoung et al., 2021). HEC-1B cells’ ability to migrate and invade has been demonstrated to be dramatically reduced by AMF silencing, but not intracellular GPI/AMF (Nakajima et al., 2012). According to our research, Picroside II can bind to AMF/GPI and prevent glycolysis and tumor migration. Cancer cells’ aerobic glycolysis results in increased glucose uptake, and glucose-derived pyruvate is directed away from mitochondria to lactate production (Kim & DeBerardinis, 2019), which causes a significant rise in glutamine metabolism (Wilson et al., 2019). Glutaminase, a mitochondrial enzyme that hydrolyzes glutamine into glutamate, has been shown to impact invasion and metastasis, as well as its established role in promoting rapid cancer cell proliferation (Zanotelli et al., 2021).
Furthermore, our experiments demonstrated that Picroside II hindered HepG2 cell migration in cellular assays. Additionally, it lowered glucose consumption and lactate production in glycolysis. Tumor cells typically possess unchecked proliferative capacity and often exist in a hypoxic state. The selection of glycolytic pathways by such cells enhances tissue cell tolerance toward hypoxia and prevents oxidative phosphorylation-triggered apoptosis (Kroemer et al., 2008). The elevation in lactate levels caused by the glycolytic pathway can degrade and destroy the cellular matrix that surrounds tumor cells, ultimately resulting in the migration of the said cells (Gatenby et al., 2006). Hence, by regulating tumor glycolytic enzymes to control energy metabolism, tumor proliferation can be thwarted, thereby targeting malignant tumors. GPI, an upstream protein of the glycolytic pathway, can entirely hinder the Warburg effect by disrupting GPI (de Padua et al., 2017). After examining the available literature alongside our own research, it is our hypothesis that Picroside II may have an anti-HCC impact by binding to GPI and preventing the migration of cancer cells.
Conclusion
Our study utilized network pharmacology, survival analysis, and molecular docking to investigate the binding affinity of Picroside II with GPI. Our findings indicated that Picroside II exhibited the highest binding energy toward GPI, which we further verified using SPR—an in vitro molecular interaction technique. GPI functions as both a cytosolic factor and a glycolytic enzyme. Cellular and WB experiments suggested that Picroside II not only inhibits tumor cell migration but also suppresses glycolysis. Therefore, Picroside II inhibits HCC by inhibiting HepG2 migration and glycolysis. Next, we will verify the efficacy and mechanism of Picroside Ⅱ against HCC in vivo.
Footnotes
Abbreviations
MCODE: Molecular complex detection; HCCH: hepatocellular carcinoma; GO: Gene Ontology; KEGG: Kyoto Encyclopedia of Genes and Genomes; GEPIA2: gene expression profiling interactive analysis 2; SPR: Surface plasmon resonance; GPI: Glucose-6-phosphate isomerase; AMF: Autocrine motility factor; DAVID: Database for Annotation, Visualization and Integrated Discovery; BP: Biological processes; CC: Cellular components; MF: Molecular functions; PBS: Phosphate buffered saline; F6P: Fructose-6-phosphate; F1,6DP: fructose-1,6-diphosphate; ALDOA: Aldolase A; GAPDH: Glyceraldehyde-3-phosphate dehydrogenase.
Authors’ Contributions
LX designed, performed the experiments and wrote the original manuscript. YSC participated in the conception and design of the experiment and co-authored the manuscript. PKB and WMF analyzed the data. WHZ and YYF conceived the experiment and revised the original manuscript. All the authors read and approved the final version of the manuscript. The authors declare that all data were generated in-house and that no paper mill was used.
Declaration of Conflicting Interests
The authors indicated no conflicts of interest with respect to the research, authorship, and/or publication of this article.
Funding
The author received no financial support for the research, authorship and/or publication of this article.
Supplementary Material
References
Supplementary Material
Please find the following supplemental material available below.
For Open Access articles published under a Creative Commons License, all supplemental material carries the same license as the article it is associated with.
For non-Open Access articles published, all supplemental material carries a non-exclusive license, and permission requests for re-use of supplemental material or any part of supplemental material shall be sent directly to the copyright owner as specified in the copyright notice associated with the article.