
Abstract
Objectives
To evaluate the Spectrum-Effect relationships between the High-Performance Liquid Chromatography (HPLC) Fingerprints of fractions with different polarities and the anti-inflammatory and antioxidant effects of A. trifoliatus and to identify its pharmacodynamic material basis.
Materials and Methods
Chemical Fingerprints of A. trifoliatus fractions with different polarities (all fractions and ethyl acetate, n-butanol and water fractions) were obtained by HPLC, and Principal Component Analysis (PCA) was performed. The foot swelling and prostaglandin E2 (PGE2) content in mice induced by carrageenan were used as anti-inflammatory markers, and 2,2-diphenyl-1-picrylhydrazyl (DPPH) and 2,2’-azino-bis (3-ethylbenzothiazoline-6-sulfonic acid) (ABTS) methods were used as antioxidant indicators. Moreover, the Spectrum-Effect relationship between common peaks and efficacy value was conducted by Grey Relational Analysis (GRA) and Partial Least Squares analysis (PLS).
Results
PCA identified three principal components, and all fractions of A. trifoliatus had good anti-inflammatory and antioxidant effects. Based on GRA and PLS analysis, peaks 1 and 2 (neochlorogenic acid), 4 and 5 (chlorogenic acid), 8, 9, 10, 11 (isochlorogenic acid B), and 12 were involved in anti-inflammatory efficacy, and peaks 1 and 2 (neochlorogenic acid), 3, 4, and 5 (chlorogenic acid), and 6, 7, 9, 10, and 13 (isochlorogenic acid A) were involved in antioxidant efficacy.
Conclusion
This study on the Spectrum-Effect relationship of different polar fractions of A. trifoliatus provides data to support the discovery of the pharmacodynamic material basis of the anti-inflammatory and antioxidant properties of A. trifoliatus.
Introduction
Acanthopanax trifoliatus (L.) Merr is an Araliaceae plant that is widely distributed in China, Thailand, the Philippines, and other places (Medicine, 1999). Acanthopanax trifoliatus (L.) Merr roots and root bark (ATRB) are Traditional Chinese Medicine called “SAN JIA PI” in China. Chinese Herbal Medicine indicates that the medicinal properties of ATRB involve cooling and warming, and the taste is mainly bitter and acrid. ATRB can be used for the treatment of colds with high fever, expectoration with blood, rheumatoid arthritis, jaundice, leucorrhea, urinary calculi, and traumatic injury (Medicine, 2006). Modern pharmacological studies have shown that ATRB has immune regulatory, antitumor, antibacterial, anti-inflammatory, anti-aging, and anti-fatigue activities (Lao et al., 2016; Yang et al., 2017; Yang et al., 2014; Yang et al., 2015). A study reported that the ATRB ethanol extract has a considerable anti-inflammatory effect; LPS-induced NO production in RAW264.7 cells was significantly lower after ATRB ethanol extract treatment, and the main substances in the ethanol extract were identified as chlorogenic acid, isochlorogenic acid A, isochlorogenic acid C, and other polyphenols. Moreover, ethanol extraction can effectively remove 2,2-diphenyl-1-picrylhydrazyl (DPPH) and 2,2′-azino-bis (3-ethylbenzothiazoline-6-sulfonic acid) (ABTS) free radicals (Luo et al., 2022; Wang et al., 2015). Numerous studies have shown that ATRB has good anti-inflammatory and antioxidant effects. Researchers found that treatment with the water extract of ATRB can prolong the exhaustive exercise time of rats with chronic swimming stress, and 10 phenolic acids were isolated and identified from the water extract, among which chlorogenic acid and (+)-syringaresinol-di-O-beta-D-glucoside were the main components (Chen et al., 2021; Wang et al., 2015; Xiao et al., 2011). The main effective components of ATRB are phenolic acids (Wang et al., 2018). However, the components of ATRB that are responsible for its anti-inflammatory and antioxidant activities remain unclear; thus, one of the most important tasks is researching the material foundation of the efficacy of ATRB.
In traditional research, the use of a single component to detect its activity is costly, time-consuming, and not suitable for the analysis of multicomponent synergistic Chinese Medicine. The chemical Fingerprinting technique can only be used to monitor the chemical components of drugs but cannot be used to evaluate their efficacy. With the development of multivariate statistics, the Spectrum-Effect relationship has been proposed. The effective combination of efficacy and Fingerprinting using a multivariate statistical model can find the effective substances in complex chemical components (Lin et al., 2021; Liu et al., 2022). Moreover, the development of Spectrum-Effect science improves the effective basis for drug development and utilization.
In this study, High-Performance Liquid Chromatography (HPLC) was used to determine the Fingerprints of fractions of ATRB with varying polarities, and Principal Component Analysis (PCA) of its chemical substances was carried out. Moreover, the anti-inflammatory effect was investigated by the carrageenan-induced mouse foot swelling model and measuring the level of prostaglandin E2 (PGE2). The DPPH scavenging effect and ABTS scavenging effect were used to investigate the antioxidant effect. Grey Relational Analysis (GRA) and Partial Least Squares (PLS) analysis were used to effectively combine the Fingerprints and the efficacy and establish the spectral efficiency relationship between them. This study provides a reference for clarifying the material basis of the efficacy of ATRB and provides an effective basis for the development and utilization of ATRB in future studies.
Materials and Methods
Materials and Reagents
ATRB was purchased from the Yulin Chinese Herbal Medicine market and identified as the dry root bark of A. trifoliatus (L.) Merr by senior experimentalist Yi-Lin Zhu of Guangxi University of Traditional Chinese Medicine, Guangxi, China. Neochlorogenic acid, chlorogenic acid, isochlorogenic acid A, isochlorogenic acid B, and isochlorogenic acid C standards were provided by Shanghai Ronghe Pharmaceutical Technology Co. Ltd., Shanghai, China. DPPH (1,1-diphenyl-2-picrylhydrazyl) and ABTS (2,2-azino-bis(3-ethyl-benzothiazole-6-sulfonic acid) diammonium salt) free radical scavenging capacity kits were produced by Suzhou Grius Biotechnology Co. Ltd., Suzhou China. Tripterygium tablets were produced by Yuanda Pharmaceutical Huangshi Feiyun Pharmaceutical Co. Ltd., Hubei China. Vitamin C tablets were produced by Dongbei Pharmaceutical Group Co. Ltd., Liaoning, China. Carrageenan was produced by Aladdin Reagent (Shanghai) Co. Ltd., Shanghai, China. Methanol, phosphoric acid, and anhydrous ethanol were produced by Symefeishier Technology (China) Co. Ltd., Shanghai, China.
Instrumentation
The instrument used for HPLC was an Agilent 1260 (Agilent, USA); an Ultraviolet spectrophotometer (UV-1900i; Shimazu, Japan) was also utilized.
Enzyme calibration was conducted using a Thermo (USA) instrument; a medical centrifuge (H1650-W; Hunan Xiangyi Laboratory Instrument Development Co., Ltd., China) was also used.
A sonic washer (KQ5200B; Kunshan Ultrasonic Instrument Co., Ltd., China), a rotary evaporator (N-1300; Shanghai Ailang Instrument Co., Ltd., China), and an analytical balance (ME204; METTLER TOLEDO, USA) were used.
Extract Preparation
An appropriate amount of ATRB was weighed; added to 10 times the amount of 60% ethanol; refluxed and extracted twice, first for 2 h and then for 1.5 h; filtered; combined with the filtrate; concentrated under reduced pressure to ensure there was no alcohol taste; and then dried and ground to obtain the dry extract powder of the total fraction. The concentrated solution of the total fraction was extracted with ethyl acetate and n-butanol three times each, with each extract combined and concentrated under reduced pressure. Each respective extract was dried to obtain the ethyl acetate fraction, n-butanol fraction and water fraction dry extracts, ground, and stored in a room-temperature dryer for later use.
Animals
Specific pathogen-free (SPF) Kunming (KM) mice weighing 20 ± 2 g were purchased from the Experimental Animal Center of Guangxi Medical University (License No.: SCXK GUI 2020-00003). Before the experiment, the animals were fed adaptively for 3 days and had free access to food and water. All animal experiments followed the Institutional Animals Ethics Committee and Animal Care guidelines for experimental animals at Guangxi University of Chinese Medicine.
HPLC Fingerprinting
HPLC Conditions
Chromatographic separation was performed with a Shimadzu shim-pack GIS C18 column (250 mm × 4.6 mm) at 25°C and 1.0 mL/min. The eluent comprised a methanol (C) and 0.2% phosphoric acid (A) system with the following gradient: 0−6 min, 20% C-25% C; 6−12 min, 25% C-31% C; 12−21 min, 31% C-34% C; 21−28 min, 35% C-35% C; 28−30 min, 35% C-40% C; and 30−60 min, 40% C-50% C. The detection wavelength was 250 nm with a sample injection volume of 10 µL.
Reference Standard Preparation
The amounts of neochlorogenic acid, chlorogenic acid, isochlorogenic acid A, isochlorogenic acid B, and isochlorogenic acid C reference standards were accurately weighed into the same capacity bottle and dissolved in 80% methanol to obtain standard mixed solutions with concentrations of 0.13 mg/mL, 0.57 mg/mL, 0.17 mg/mL, 0.23 mg/mL, and 0.17 mg/mL.
Preparation of Sample Solutions
Different polar fractions of the dry ATRB extract powder (0.1 g) were accurately weighed, placed in a conical flask, added to 10 ml 80% methanol, weighed, ultrasonicated for 30 min (power 200 W, frequency 40 kHz), placed at room temperature, and filtered through a 0.22-µm microporous membrane.
HPLC Fingerprinting Method Validation
The feasibility of the method was evaluated by method validation. Peak 5 (chlorogenic acid) was used as the reference peak, and the precision was evaluated by continuously injecting a sample solution six times. The repeatability was evaluated by repeating the analysis of six samples from the same source. The stability of the sample within 1 day was evaluated by injection analysis of the same sample solution at 0, 2, 4, 8, 12, and 24 h. The relative retention time and relative peak area RSD of all method validations did not exceed 3%.
Establishment and Evaluation of Fingerprints
Dry extract powder of fractions with different polarities was taken to prepare the test solution of different polar fractions for injection analysis, and the chromatogram was recorded. The chromatogram was imported into the “Similarity Evaluation System for Chromatographic Fingerprints of Traditional Chinese Medicine (2012 A Edition). The chromatogram of the total fraction was used as a reference, and the time width was 0.1 s. After multipoint correction, the median method was used for full peak matching to obtain the Fingerprints of different polar fractions of ATRB.
Peak Identification
The mixed reference solution was injected for analysis, and the mixed reference spectrum was obtained. After comparison with the retention time of the Fingerprints of different polar fractions, the component peaks were identified.
Principal Component Analysis (PCA)
The common peak area of different polar fractions of ATRB was used as a variable and imported into SPSS 27.0 (SPSS Inc., USA) for Principal Component Analysis. The principal components were extracted, and the scores of the principal components were calculated.
Anti-inflammatory Activity Test
Carrageenan-induced Foot Swelling in Mice
Grouping was performed before the start of the experiment. According to numerous studies, findings from at least six animals in each group of experimental animals were statistically significant, so each group was selected to have 10 animals (Su et al., 2020; Wang et al., 2009), and the experimental groups were divided into seven groups: the control group, model group, tripterygium glycoside tablet group (0.1 g/kg), total ATRB fraction group (13.34 g/kg), ethyl acetate fraction group (13.34 g/kg), n-butanol fraction group (13.34 g/kg), and water fraction group (13.34 g/kg). Each group was administered corresponding drugs. The control group and model group were given 0.9% normal saline. The mice were intragastrically administered the solvent twice daily for seven days. Thirty minutes after the last administration, 0.03 mL of 1% carrageenan solution was subcutaneously injected into the middle of the right hind toe of mice in all groups except the control group. To establish the foot swelling model, 4 h after the animals were sacrificed, the right and left hind feet of mice were removed and weighed; the degree of foot swelling (foot swelling degree (mg) = right foot weight-left foot weight) was calculated; and foot swelling inhibition rate was calculated as swelling inhibition rate (%) = (average swelling degree of model group-average swelling degree of administration group)/average swelling degree of model group × 100%.
Measurement of PGE2 Inflammatory Mediators
The inflammatory feet of mice with foot swelling were fully cut into pieces and immersed in 2 mL saline for 2 h. After centrifugation at 12,000 rpm for 15 min, 0.5 mL of supernatant was taken, and 1.5 mL of 0.5 mol/L potassium hydroxide methanol solution was added. The reaction was carried out in a water bath at 50°C for 20 min. The solution was cooled to room temperature and diluted with 2.5 mL methanol. The absorbance was measured at 278 nm. The absorbance (A) was used as the content of PGE2 to calculate the inhibition rate of inflammation (inhibition rate of inflammation (%) = [1 − (PGE2 content of inflammatory foot in the administration group − PGE2 content of control group)/(PGE2 content of model group − PGE2 content of control group)] × 100%).
Antioxidant Activity Test
Analysis of DPPH Free Radical Scavenging Ability
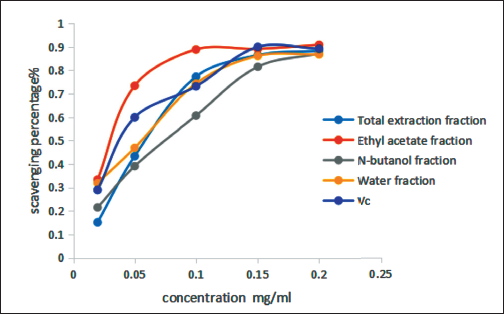
The dry extract powder of fractions with different polarities was prepared with 80% methanol into different polar fraction solutions with concentrations of 0.02 mg mL−1, 0.05 mg·mL−1, 0.1 mg·mL−1, 0.15 mg·mL−1, and 0.2 mg·mL−1. Then, 150 µL of the above solution and 150 µL of DPPH free-radical solution were placed in an EP tube, mixed well, and reacted at room temperature in the dark for 30 min. A total of 200 µL of the combined solution was placed in a 96-well plate and measured at 517 nm, and the absorbance was recorded as described previously (Tu et al., 2022; Yun & Zhang, 2022). According to the above method, the same amount of 80% methanol was used instead of DPPH to analyze the corresponding samples, and the absorbance was recorded as Acontrol. According to the above method, the same amount of 80% methanol was used instead of the sample solution for analysis, the absorbance was recorded as Ablank, and Vitamin C tablets were used as a positive control. Each group was analyzed in triplicate, and the clearance rate (free radical scavenging rate (%) = [(1 − (Adetermination − Acontrol)/Ablank) × 100%]), clearance rate curve, and IC50 were calculated.
Analysis of ABTS Free-radical Scavenging Ability
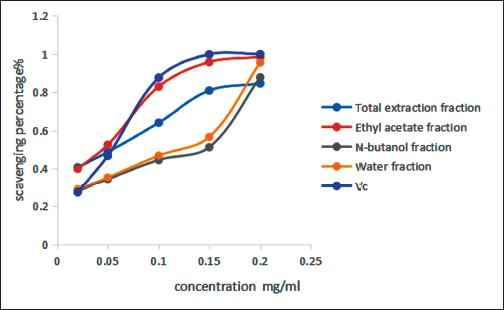
Ten microliters of different polar fractions (0.02 mg mL−1, 0.05 mg·mL−1, 0.1 mg·mL−1, 0.15 mg·mL−1, and 0.2 mg·mL−1) and 190 µL of ABTS free-radical solution were placed into 96-well plates and reacted in the dark for 6 min at room temperature. The absorbance was measured at 734 nm and recorded as described previously (Qiang et al., 2019). The corresponding samples were analyzed by the above method with the same amount of anhydrous ethanol instead of ABTS solution, and the absorbance was recorded as Acontrol. The sample solution was analyzed by the above method with the same amount of anhydrous ethanol instead of the sample solution, the absorbance was recorded as Ablank, and vitamin C tablets were used as a positive control. Each group was analyzed three times, and the clearance rate (free radical scavenging rate (%) = [(1 − (Adetermination − Acontrol)/Ablank) × 100%]), clearance rate curve, and IC50 were calculated.
Spectrum-effect Relationship Analysis
Gray Relational Analysis
Grey Relational Analysis (GRA) was carried out by SPSS 27.0 (SPSS Inc., USA). The foot swelling inhibition rate, PGE2 inhibition rate, DPPH free-radical IC50, and ABTS free radical IC50 were used as the parent sequences, and the common peak areas of ATRB fractions with different polarities were used as the reference sequence. The data were standardized by the mean value method, and the two sequences were subjected to grey correlation to obtain the correlation degree between each common peak and the efficacy. A correlation degree >0.6 indicated that there was a correlation, and a correlation degree >0.8 indicated that there was a high correlation.
Partial Least Squares
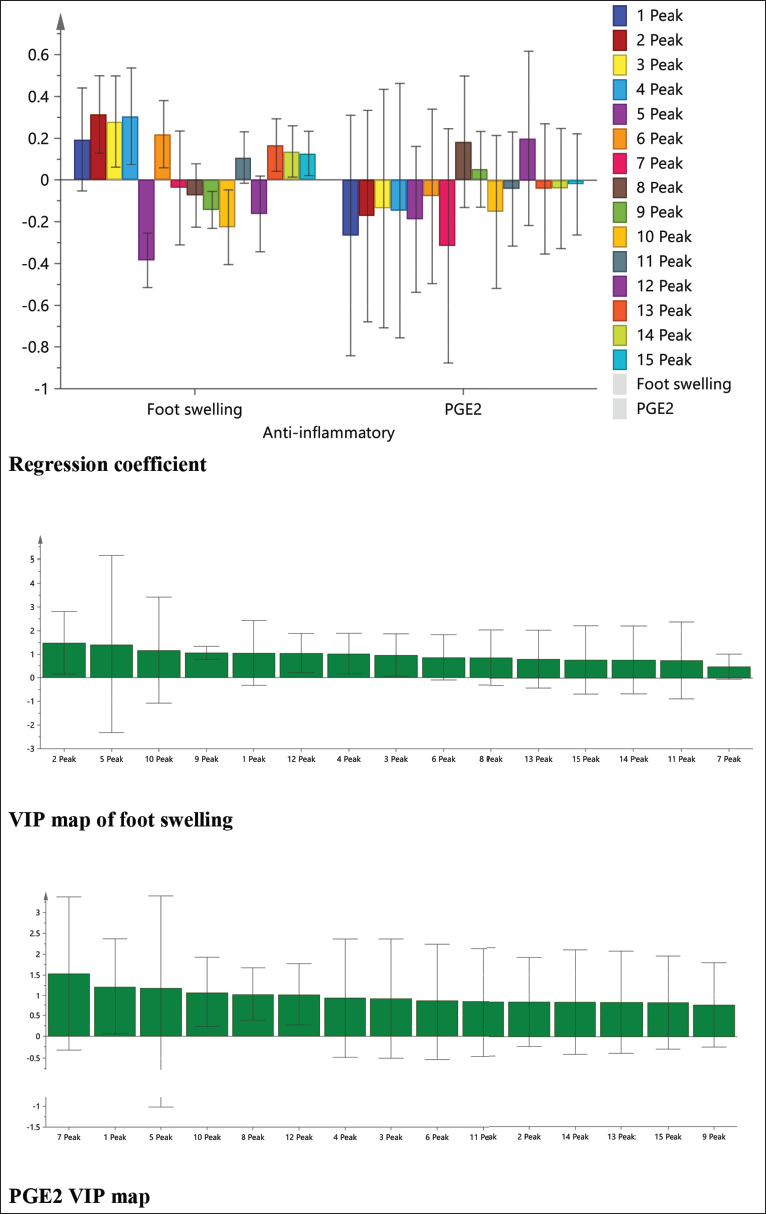
The common peak area of different polar fractions of ABTS was taken as the independent variable (X), and the foot swelling inhibition rate, PGE2 inhibition rate, DPPH free radical IC50, and ABTS free radical IC50 of different polar fractions were taken as the dependent variables (Y), which were imported into SIMCA-P (UMETRICS Inc., Sweden) 14.0 for Partial Least Squares (PLS) analysis, and the regression coefficient diagram and VIP diagram were obtained. The greater the absolute value of the regression coefficient is, the greater the correlation between the independent variable (X) and the dependent variable (Y), and the greater the VIP value is, the more important the independent variable (X) is to the dependent variable (Y).
Results
Results of HPLC Fingerprinting
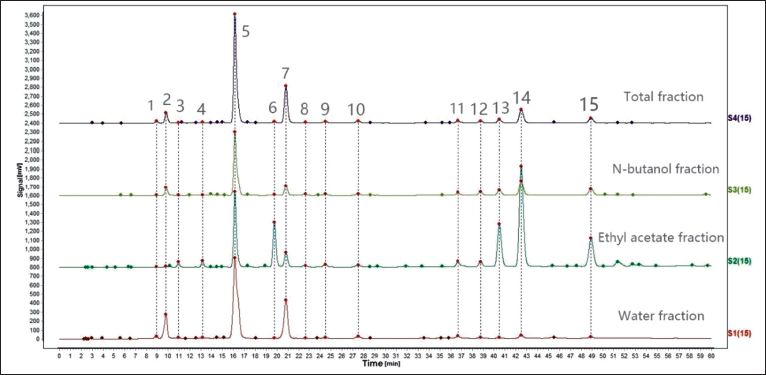
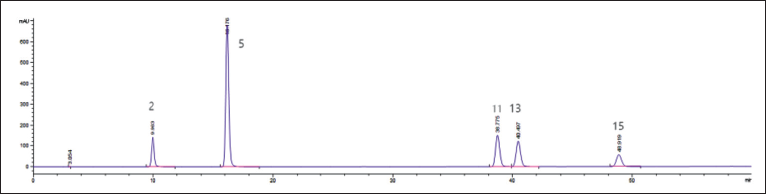
Method validation for HPLC Fingerprinting results showed that the relative retention time and relative peak area RSD of precision and repeatability were less than 1.48%, indicating that the precision of the instrument and the repeatability of the method were good. The sample was stable within 24 h, and the relative retention time and relative peak area RSD were less than 1.58%. There were 15 common peaks in the Finger prints of different polar fractions of ABTS established by full peak matching, as shown in Figure 1. After comparison with the mixed standard solution, five components were identified: neochlorogenic acid (peak 2), chlorogenic acid (peak 5), isochlorogenic acid B (peak 11), isochlorogenic acid A (peak 13), and isochlorogenic acid C (peak 15), as shown in Figure 2. Chlorogenic acid (peak 5) was used as the reference peak of the chromatogram.
Results of PCA
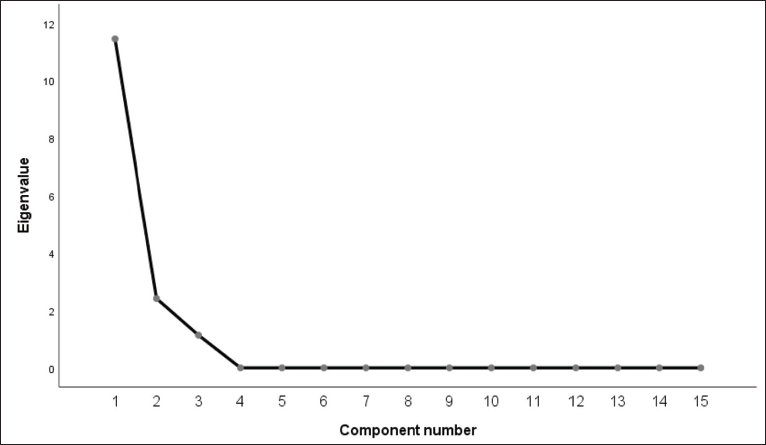
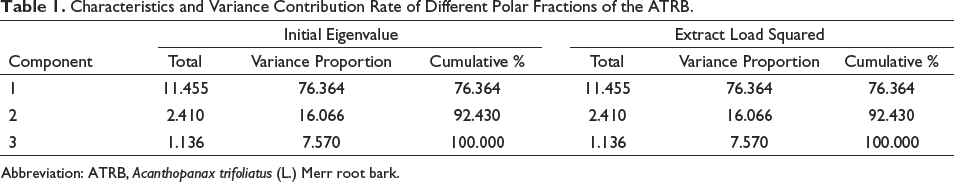
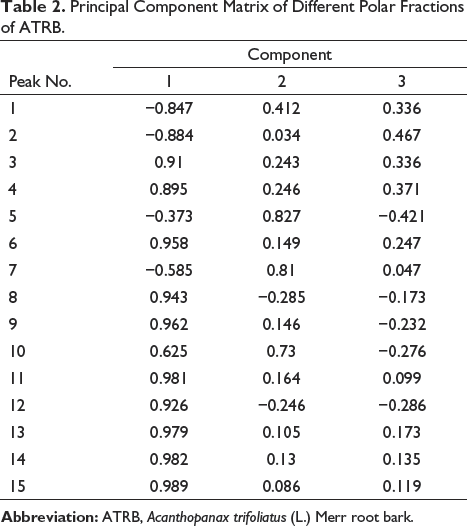
The results of PCA show that three principal components were identified: the variance contribution rate of principal component 1 was 76.364%, the variance contribution rate of principal component 2 was 16.066%, the variance contribution rate of principal component 3 was 7.570%, and the cumulative contribution rate of the three principal components reached 100% > 85%. The gravel diagram (Figure 3) also shows that the three principal components could represent the vast majority of the information on 15 common peaks in different polar fractions of the ATRB. The correlation between 15 s and the principal component can be seen from the principal component matrix. The peaks with relatively large absolute loads on principal component 1 were Peak 2 (neochlorogenic acid), Peak 3, Peak 4, Peak 6, Peak 8, Peak 9, Peak 11 (isochlorogenic acid A), Peak 12, Peak 13 (isochlorogenic acid B), Peak 14, Peak 15 (isochlorogenic acid C), Peak 5 (chlorogenic acid), and Peak 7, and Peak 10 had a relatively large absolute load on principal component 2. After standardizing the data, the comprehensive score (Y = 0.7636Y1 + 0.1607Y2 + 0.0757Y3) was determined by using the formula, and the Y value of each polar fraction descended in the following order: ethyl acetate (3.76) > n-butanol (−0.67) > total fraction (−0.86) > water (−2.22). The ethyl acetate fraction had the highest score, indicating that the chemical composition of this fraction was more abundant, and more components in the bark of ATRB were enriched in this fraction. When separating and purifying compounds, this fraction can be considered. The results are shown in Tables 1 and 2 and Figure 3.
Debris.
Characteristics and Variance Contribution Rate of Different Polar Fractions of the ATRB.
Principal Component Matrix of Different Polar Fractions of ATRB.
Anti-inflammatory Activity Test Results
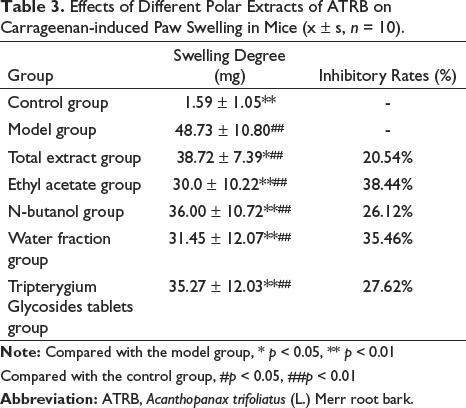
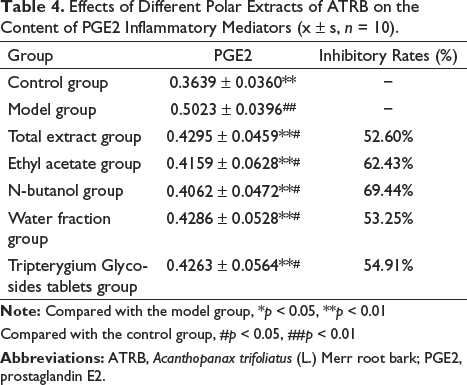
The results show that the extracts of different polar fractions of ATRB had inhibitory effects on the foot swelling of mice induced by carrageenan. There was a significant difference between the model group and the blank group, indicating that the inflammatory model was successfully established. Compared with the model group, there were significant differences (p < 0.05), and the ethyl acetate fraction had the best inhibitory effect. The content of PGE2 in the inflammatory feet of mice in each group was significantly lower than that in the model group (p < 0.05), and the n-butanol fraction and ethyl acetate fraction had the best effect. The results are shown in Tables 3 and 4.
Effects of Different Polar Extracts of ATRB on Carrageenan-induced Paw Swelling in Mice (x ± s, n = 10).
Effects of Different Polar Extracts of ATRB on the Content of PGE2 Inflammatory Mediators (x ± s, n = 10).
Results of the Antioxidant Activity Test
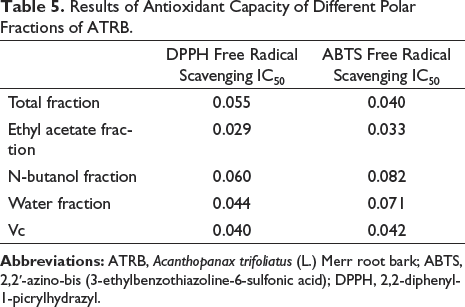
The results show that the polar fractions of ATRB had good scavenging effects on DPPH and ABTS free radicals. The ethyl acetate fraction had the strongest free radical scavenging effect, as indicated by its small IC50 and negative correlation with free radical scavenging. The results are shown in Table 5, Figures 4 and 5.
Results of Antioxidant Capacity of Different Polar Fractions of ATRB.
Results of GRA
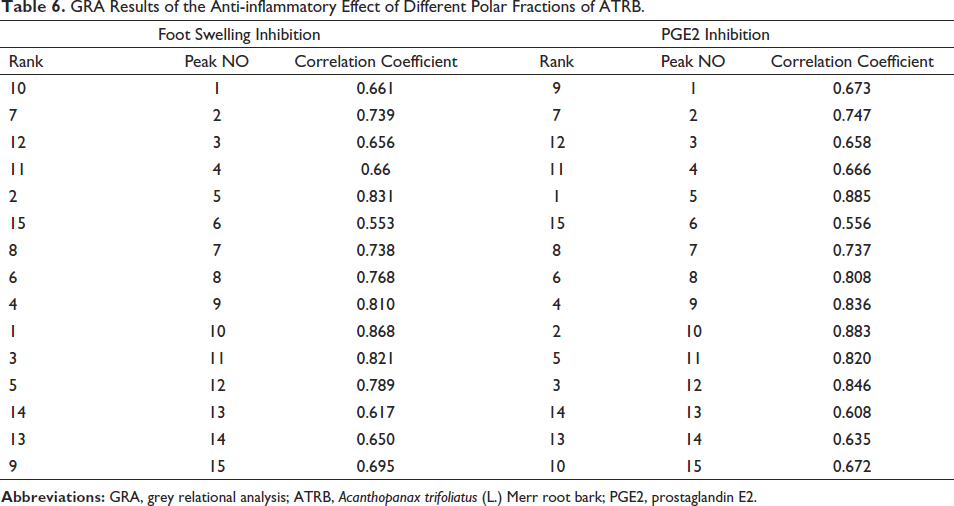
Based on the GRA, the contribution of the common peaks of different polar fractions of ATRB to the inhibition of foot
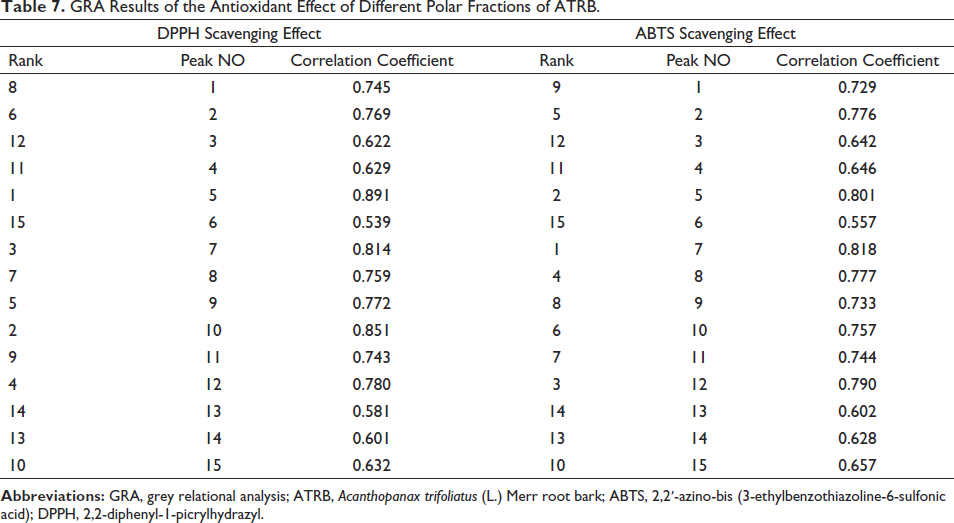
The contribution of common peaks of different polar fractions of ATRB to DPPH scavenging activity was ranked as follows: peaks 5 > 10 > 7 > 12 > 9 > 2 > 8 > 1 > 11 > 15 > 4 > 3 > 14 > 13 > 6. Except for peaks 6 and 13, the correlation degree of the other peaks was > 0.6, and the correlation degree of peaks 5, 10, and 7 was > 0.8. The order of contribution to the ABTS scavenging effect was peaks 7 > 5 > 12 > 8 > 2 > 10 > 11 > 9 > 1 > 15 > 4 > 3 > 14 > 13 > 6. Except for Peak 6, the correlation degree of the other peaks was > 0.6, and the correlation degree of Peaks 5 and 7 was > 0.8. The results are shown in Table 7.
GRA Results of the Anti-inflammatory Effect of Different Polar Fractions of ATRB.
GRA Results of the Antioxidant Effect of Different Polar Fractions of ATRB.
Results of PLS
PLS analysis shows that among the 15 common peaks, the regression coefficient of the foot swelling inhibition rate was relatively large, and the peaks with VIP > 1 were peaks 1, 2, 4, 5, 9, 10, and 12, among which peaks 1, 2, and 4 showed a positive correlation. The regression coefficient of the PGE2 inhibition rate was relatively large, and the peaks with VIP > 1 were peaks 1, 5, 7, 8, 10, and 12, among which peaks 8 and 12 showed a positive correlation. Comprehensive analysis showed that peaks 1, 2, 4, 8, and 12 strongly correlated with anti-inflammatory activity. The related results are shown in Figure 6, including the regression coefficient and DPPH VIP map.
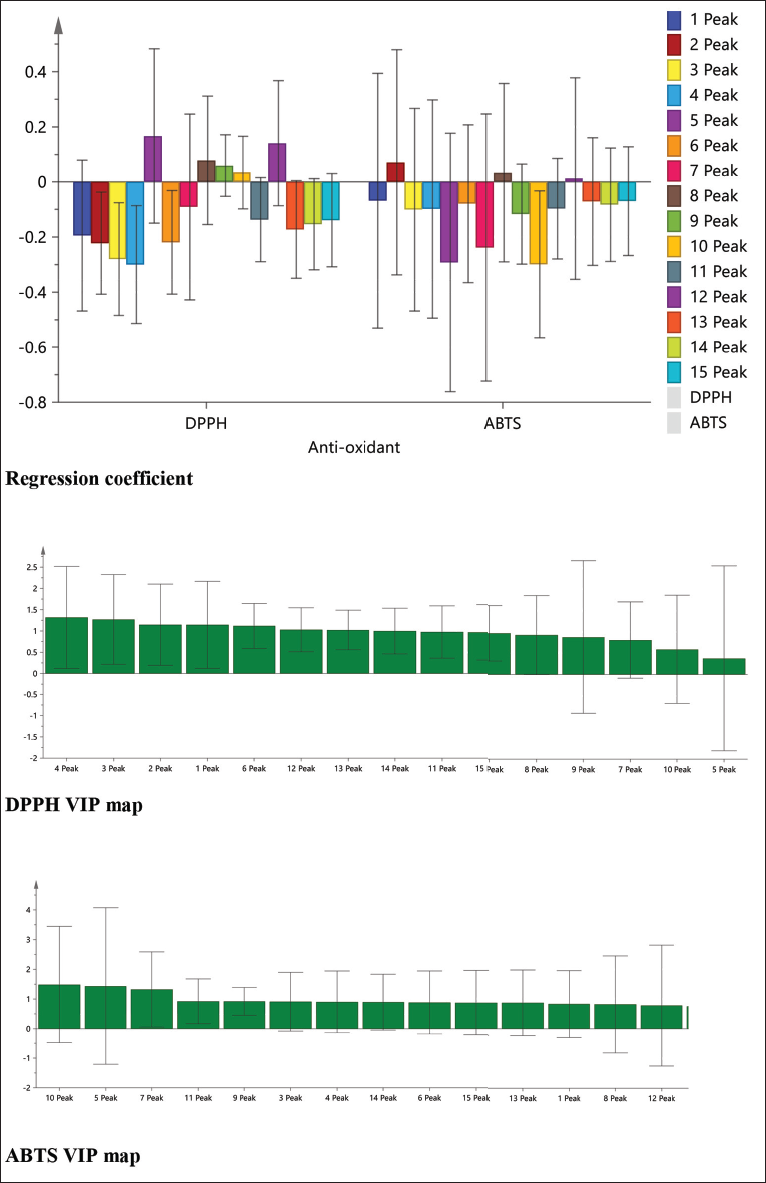
The free radical scavenging ability was negatively correlated with IC50; thus, the regression coefficient was negatively correlated with the chromatographic peak as the pharmacodynamic peak. The 15 common peaks had a large regression coefficient for DPPH free radical scavenging, and the peaks with VIP > 1 were peaks 1, 2, 3, 4, 6, 12, and 13, among which peaks 1, 2, 3, 4, 6, and 13 were positively correlated with antioxidant effects. The regression coefficient of ABTS free radical scavenging was larger, and the peak of VIP > 1 were peaks 5, 7, and 10, among which peaks 5 and 7 were positively correlated with the antioxidant effect. Comprehensive analysis showed that peaks 1, 2, 3, 4, 5, 6, 7, and 13 strongly correlated with the antioxidant activity of ATRB. The related results are shown in Figure 7, including the regression coefficient and DPPH VIP map.
Discussion
Inflammation is a defensive reaction of the human body against injury-stimulating factors and is caused by inflammatory factors, including physical factors, chemical factors, and biological factors. Inflammation is accompanied by vasodilation, increased vascular permeability, increased immune cell levels, proliferation, and other stress reactions (Xu et al., 2022). In addition, many inflammatory mediators are produced, among which PEG2 is an important inflammatory mediator. In the cyclooxygenase metabolic pathway, arachidonic acid (AA) is metabolized by cyclooxygenase 1/2 (COX-1/2) to generate PGH2, and then, PGE2 is produced by PGE2 synthase; PGE2 is produced in almost all the cells in the human body and participates in important components in the process of inflammation, including dilating blood vessels to make fast blood flow velocity, causing increased vascular permeability and edema, and acting on neurons to increase the body’s sensitivity to pain (Chen & Zhang, 2015). The results showed that each polar component of ATRB could significantly reduce the degree of foot swelling in mice, indicating that it could effectively reduce edema in inflammatory tissue and reduce the influence of various inflammatory factors. Moreover, it could reduce vascular permeability by reducing PGE2 levels, reduce the pain caused by inflammation, and play an anti-inflammatory role.
Free radicals are highly chemically active metabolites produced by human life activities. Free radicals are involved in the important work of delivering life-sustaining energy and participate in the various aspects of metabolism (Fang & Zheng, 2008). When bacteria invade or inflammation occurs, free radicals can also have a strong inhibitory effect. In the human body, the level of free radicals is in a state of dynamic balance, and free radicals can be scavenged by antioxidants. However, with increasing age or changes in environmental factors and other factors, free radicals cannot be eliminated in a timely manner. Excessive free radicals attack the body’s macromolecular substances, causing damage to cells, tissues, and organs. Accelerated aging induces various diseases and even tumors (Cheng et al., 2008). This study showed that ATRB can effectively scavenge DPPH and ABTS free radicals, indicating that it has a strong antioxidant capacity.
In this study, HPLC was used to determine the Fingerprints of different polar fractions of ATBR. A total of 15 common peaks were established, and five peaks were identified, including peaks 2 (neochlorogenic acid), 5 (chlorogenic acid), 11 (isochlorogenic acid A), 13 (isochlorogenic acid B), and 15 (isochlorogenic acid C). By PCA of the 15 common peaks, three principal components could be identified. The comprehensive score ranking showed that the ethyl acetate fraction had the highest score, indicating that the chemical composition and content of this fraction were more abundant than those of other fractions, which was also consistent with the results reflected in the liquid chromatogram. Pharmacodynamic experiments also showed that the effect of the ethyl acetate fraction was better than that of the other fractions. There were more phenols and flavonoids in ATRB, which were mostly soluble in medium polar solvents and had good biological activity. Therefore, the chemical constituents of the ethyl acetate fraction of ATRB should be given more attention.
Through the GRA of Fingerprints and efficacy of different polar fractions of ATRB, the results showed that except for peak 6, the correlation between other peaks and foot swelling was > 0.6, and the correlation of Peaks 5, 9, 10, and 11 was > 0.8. Except for peak 6, the correlation between other peaks and PGE2 was > 0.6, and the correlation between peaks 5, 8, 9, 10, 11, and 12 was > 0.8. Comprehensive analysis showed that peaks 1−4, 7, and 13−15 strongly correlated with anti-inflammatory efficacy, and peaks 5, 8, 9, 10, 11, and 12 had a very strong correlation with anti-inflammatory efficacy. Except for peaks 6 and 13, the correlation between the peaks and DPPH scavenging efficacy was >0.6, and the correlation between peaks 5, 7, and 10 was >0.8. Except for peak 6, the correlation between the other peaks and ABTS scavenging efficacy was >0.6, and the correlation between peaks 5 and 7 was >0.8. Comprehensive analysis showed that peaks 1−4, 8, 9, and 11−15 strongly correlated with antioxidant efficacy, and peaks 5, 7, and 10 had a very strong correlation with antioxidant efficacy. The results of the PLS method showed that peak 1, peak 2, and peak 4 were positively correlated with the efficacy of foot swelling, and peak 8 and peak 12 were positively correlated with the efficacy of PEG2. Comprehensive analysis of peaks 1, 2, 4, 8, and 12 showed a strong effect on the anti-inflammatory activity of ATRB; peaks 1, 2, 3, 4, 6, and 13 were positively correlated with DPPH scavenging efficacy, and peaks 5 and 7 were positively correlated with ABTS scavenging efficacy. Comprehensive analysis showed that peaks 1, 2, 3, 4, 5, 6, 7, and 13 had a strong effect on the antioxidant activity of ATRB. Comprehensive GRA and PLS analysis showed that peaks 1 and 2 (neochlorogenic acid), 4 and 5 (chlorogenic acid), 8, 9, 10, 11 (isochlorogenic acid B), and 12 may be the pharmacodynamic material basis for A. trifoliatus to exert anti-inflammatory activity. Peaks 1 and 2 (neochlorogenic acid), 3, 4, and 5 (chlorogenic acid), and 6, 7, 9, 10, and 13 (isochlorogenic acid A) may be the pharmacodynamic material basis for A. trifoliatus to exert antioxidant activity. It has also been proven that the anti-inflammatory and antioxidant effects of A. trifoliatus are the result of the synergistic effects of multiple components.
Many studies have shown that a series of phenolic acids, mainly chlorogenic acid, have strong anti-inflammatory and antioxidant capacities, and this study also confirms these views (Lee et al., 2006). This study quickly identified the effective components from the chemical substance group. The method is fast, simple, and scientific, but there are also many limitations. The identity of the substances represented by many chromatographic peaks could not be determined; thus, it is not clear what substance has efficacy; this method also has limitations in the analysis of the dose-effect relationship of pharmacodynamic substances and cannot explain how many doses of pharmacodynamic substances have a pharmacodynamic role. To solve the above problems, liquid chromatography-mass spectrometry can be used to identify the chemical properties of chromatographic peaks. Moreover, through the separation of monomeric compounds, the dose-effect relationship of pharmacodynamic substances can be studied to provide more technical support for the further development and utilization of ABRT.
Conclusion
The HPLC Fingerprints method established in this study is accurate, stable, and reproducible. PCA, GRA, PLS analysis, and correlation analysis between components and anti-inflammatory and antioxidant effects were used to explore the effective material basis of A. trifoliatus. The study revealed that A. trifoliatus has good anti-inflammatory and antioxidant capacity, which also proves the pharmacodynamic theory of multicomponent and multitarget traditional Chinese Medicine and provides a strong basis for the further development and utilization of Acanthopanax trifoliatus. Moreover, the study of spectral pharmacodynamics also provides methods and technical support for quickly finding the material basis of pharmacodynamics.
Footnotes
Acknowledgements
The Author Thank Guangxi University of Traditional Chinese Medicine College of Pharmacy, Traditional Chinese Medicine National Experimental Teaching Demonstration Center (Guangxi University of Traditional Chinese Medicine), the State Administration of Traditional Chinese Medicine Research Laboratory (Zhuang) Pharmaceutical Chemistry and Quality Analysis Laboratory, Guangxi University of Traditional Chinese Medicine Extraction and Purification and Quality Analysis Key Laboratory, College Students’ Innovative Comprehensive Experimental Center to provide experimental instruments and places
Abbreviations
DPPH: 2,2-diphenyl-1-picrylhydrazyl; ABTS: 2,2′-azino-bis (3-ethylbenzothiazoline-6-sulfonic acid); CATRB: Acanthopanax trifoliatus (L.) Merr root bark; IC50: Half maximal inhibitory concentration; PGE2: Prostaglandin E2; CPCA: Principal component analysis; CGRA: Grey relational analysis; CVIP: Variable importance in projection; CPLS: Partial least squares.
Declaration of Conflicting Interests
The authors declared no potential conflicts of interest with respect to the research, authorship, and/or publication of this article.
Funding
This work was supported by the Guangxi Key R & D Program (Guike AB21196051), the project of improving the basic scientific research ability of young and middle-aged teachers in Guangxi Universities in 2020 (2020KY07037), the Youth Fund Project of Guangxi University of Traditional Chinese Medicine (2019QN007), and Guangxi Key R & D Program (Guike AB1850022).
Statement of Informed Consent and Ethical Approval
The animal experiment of this study was carried out in Guangxi University of Traditional Chinese Medicine. The experimental design was in line with the relevant provisions of the National Experimental Animal Welfare Ethics and was approved by the Ethics Committee of Guangxi University of Traditional Chinese Medicine (No. DW20210404-041).