
Abstract
Objectives
This study aimed to evaluate the antioxidant and antiepileptic potential of the ethanolic extract of Achillea millefolium aerial parts. Antioxidant activity was measured using DPPH photometric assay, and flavonoid content was quantified via the aluminum chloride method. The extract's neuroprotective effect was assessed using the pentylenetetrazole (PTZ)-induced seizure model, along with immunohistochemical (IHC) analysis and hematoxylin & eosin (H&E) staining.
Methods
The antioxidant potential of the extract was determined through DPPH radical scavenging activity, while flavonoid content was assessed as quercetin equivalents (QE). The in vivo antiepileptic activity was evaluated in mice using the PTZ-induced seizure model. Key biomarkers of oxidative stress, including glutathione (GSH), glutathione-S-transferase (GST), catalase, and lipid peroxidation (LPO), were measured to evaluate the extract's ability to ameliorate PTZ-induced oxidative stress.
Results
The extract demonstrated notable antioxidant activity, with 72% scavenging activity observed at 900 µg/mL. Flavonoid content was determined to be 39.45 ± 1.84 µg QE/mg. In the PTZ-induced seizure model, Achillea millefolium extract at 400 mg/kg and 600 mg/kg significantly reduced neuroinflammatory markers and oxidative stress, as evidenced by decreased LPO and increased levels of GSH, GST, and catalase. IHC and H&E staining revealed neuroprotective effects, including reduced neuroinflammation and enhanced neuronal survival.
Conclusion
The ethanolic extract of Achillea millefolium exhibited strong antioxidant and neuroprotective properties, effectively mitigating PTZ-induced seizures, oxidative stress, and inflammatory responses. These findings suggest its potential as a natural alternative for epilepsy treatment.
Introduction
Epilepsy is a syndrome characterized by various neurological conditions, including recurrent epileptic seizures, cognitive deficits, behavioral impairments, and electroencephalographic changes. Epilepsy is most often aggravated by psychiatric comorbidities, like memory and learning deficits, which affect about 1% of the population. 1 Research suggested that imbalance between inhibitory neurotransmitter GABA and excitatory neurotransmitter glutamate within the central nervous system (CNS) serve as significant factor contributing to epilepsy. 2 In epilepsy, the occurrence of seizure diminishes the brain antioxidant defenses while simultaneously elevating the free radicals. These free radicals involved in triggering events such as lipid peroxidation, brain edema, and epileptic episodes, with potential consequences ranging from coma to fatality. 3 Despite the availability of so many AEDs, there is always a demand for new anti-epileptic drugs. On medication, around 25% of individuals with generalised epilepsy and 30% of patients with partial epilepsy are not adequately controlled. One out of every three epileptic patients suffers from drug resistance. 4 Moreover, the frequent manifestation of adverse effects, contraindication and potential interaction with current Antiepileptic drugs poses a source of concern for individual relying on them. 5 The ongoing quest for reliable and more effective neuronal drugs is imperative. Plants are considered a primary focus in the exploration of new drugs of natural origin.The old civilization gives us written evidence for the use of natural sources for the treatment of diseases. combinational chemistry is an important part of the lead discovery process but still, plant products play an important role as starting material for the drug discovery process. There are 974 new drug molecules coming out from 1981–2006, 63% are semi-synthetic derived or natural derivatives of natural products. 6 Natural products with therapeutic characteristics have been used since the dawn of human civilization. 7
Achillea millefolium is widely distributed medicinal plant It belong family Asteraceae perennial herb used as herbal medicine for 100 year in different countries. The word achillea derived from Greek hero Achilles who used to heal wounds of soldier and millefolium means thousand leaves (yarrow) feather like leaves with numerous segments. 8 Previously it has been documented that Achillea mellifolium is rich in alkaloids, sesquiterpene lactones, flavonoids such as apigenin kaempferol,, luteolin and quercetin, and the phenolic acid, caffeoylquinic acid.9-11 In addition to these components, the presence of antioxidant compounds like tocopherols and ascorbic acid were assessed in Achillea millefolium, revealing their substantial presence. 12 The flavonoid and phenol components of Achillea millefolium act as antioxidants by snatching free radicals. This action contributes to a decrease in lipid peroxidation and protects against cellular damage. The exploration of natural antioxidants has become a pivotal area of research to identify sources that are potentially safe, effective, and cost-efficient. Herbal medications are known for their free radical scavenging properties, exhibit therapeutic activities. 13
Several studies have highlighted the potential antiepileptic activity of Achillea species, particularly Achillea wilhelmsii aerial part. 14 Achillea is known to contain aromatic bitter substances and tannin that exert significant effect on nervous system. 15 A comprehensive literature review supports anxiolytic activity and neuroprotective activity of Achillea millefolium. 16 However, despite the wealth of literature, there is a notable absence of reports regarding the antiepileptic activity of Achillea millefolium.17,18
Motivated by this gap, our current study aimed to evaluate the antiepileptic potential of the alcoholic extract derived from the aerial parts of Achillea millefolium, specifically in mitigating convulsions induced by pentylenetetrazole (PTZ) in mice.
Materials and Method:
Chemicals and Reagents
Ethanol, dimethyl sulfoxide (DMSO), normal saline, folinciocaltucu reagent, 2, 2-diphenyl-1- 1picrylhydrazyll (DPPH), Hydrogen peroxide were purchased from Sigma-Aldrich (China). Quercetin, gallic acid, pentenyltetrazole (PTZ), diazepam were obtained from Sigma life sciences(China). Phenylmethylsulfonyl fluoride (PMSF) was purchased from Heidolph Scientific Products (Germany). Hematoxylin and eosin dye, mounting media, 5,5-dithio-bis(2nitrobenzoic acid) DTNB, Phosphate buffer solution (PBS) were purchased by Macklin biochemical Technology(China).
Animals
Animals were obtained from the National Institute of Health. The animals were kept under standard environmental conditions (25C + 2) for 12 h for light and dark cycles each. Water and food were available. The mice were divided into 5 groups. The extract was given intra-peritoneal.
Plant Collection and Plant Extraction
Achilea millefolium was collected in July 2021 from the temperate region of Swat Valley Pakistan (coordinates: approximately 35.2226° N, 72.4258° E). The plant was collected and identified by Dr Zahid Ullah, Assistant Professor at the Department of Plant Sciences and Biodiversity, University of Swat, with voucher number ZU-21–852. The stem of Achillea millefolium was used in this study.The collected plants were air-dried for 3 to 4 days and then finely powdered using a rotary cutter mill (Germany), which was procured from Alpha Scientific traders a local distributor in lahore,Pakistan. A total of 2 kg of the plant powder was then added to 10 liters of 95% ethanol and subjected to extraction using the maceration method. 19 The extract was evaporated using a rotary evaporator at a temperature of 78 °C, yielding a semi-solid crude extract.. The crude extract was then stored at room temperature for further phytochemical and pharmacological evaluation. 20
Determination of Flavonoid Content Test
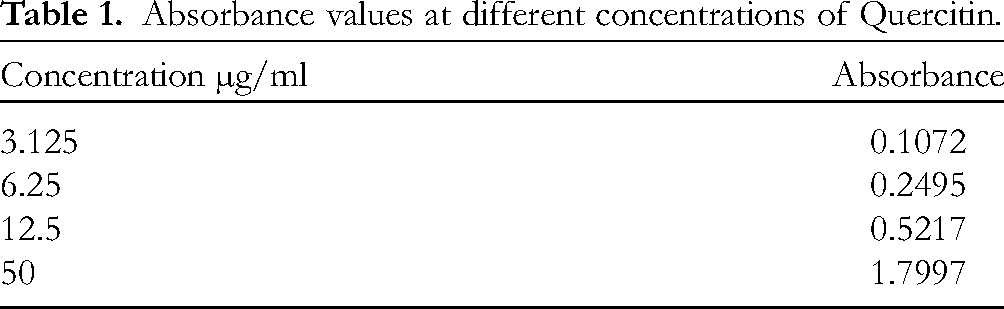
The total flavonoid amount in Achillea millefolium was measured by the aluminum chloride method. Quercetin was taken as a standard. 21 1 mL (1 mg/mL) of the extract was mixed with distilled water in a 10 mL volumetric flask. The flask was filled with 0.30 mL of sodium nitrite at a concentration of 5%. After 5 min, 0.30 mL of 10% AlCl3 was added to the mixture. After another 5 min, the mixture was diluted to the mark with distilled water, followed by 2 mL of 1.0 M NaOH, which was then diluted to the mark with distilled water. The extracts were prepared (100, 80, 60, 40, and 20 g/ml) in the same way as the quercetin. A UV/visible spectrophotometer set at 510 nm were used to measure the absorbance of the extracts and reference solutions. Quercetin solutions were prepared at concentrations of 3.125, 6.25, 12.5, and 50 µg/mL, and their absorbance values were measured at 510 nm using a UV/visible spectrophotometer to generate a standard calibration curve. From the calibration curve, the total flavonoid concentration was calculated and represented as milligrams of quercetin equivalent (QE) per gram of extracts. 22
Phenolic Content Test
The total phenolic content of the plant extract was determined using the Folin-Ciocalteau reagent. Gallic acid was utilized as calibration standard. 23 The reaction mixture was prepared by adding 9 mL distilled water and 1 mL plant extract (1 ml/mg) were mixed in a 25 mL volumetric flask. 2.5 ml of Folin-Ciocalteau regent was added to it. After 5 min, add 7.5% of a 10 ml Na2CO3 solution to the mixture and bring it up to a mark with distilled water. The mixture was incubated for 90 min at room temperature. Gallic acid standard mixtures of 200, 175, 150, 125, and 100 g/ml were made using the same process as the plant extract. The absorbance of the extracts and standard solutions was measured using a UV/Visible spectrophotometer at 760 nm. The total phenolic content was calculated using a calibration curve that was represented in milligrams of Gallic acid equivalent (GAE) per gram of extract Achillea millefolium. 22
DPPH Free Radical Scavenging Effect
The antioxidant potential of Achillea millefolium was determined by DPPH (2, 2 diphenyl 1-picrypl-hydrazyl) assay. Methanol was used as a negative control while ascorbic acid was used as a positive control having concentration of 1 mg/ml was prepared. 24 mg of DPPH solution was prepared in 100 ml of methanol.
24
Different concentrations of sample in µg//ml (900,750,600,450,300) were prepared. Then 1 ml of test sample was taken in separate 96-well microplate and added 3 ml of already prepared DPPH solution into each well make up the final volume up to 4 ml. The prepared was sample was covered with aluminum foil and kept at room temperature. The DPPH solution appears dark purple and in case of presence of antioxidant in test compound, DPPH will change from purple to yellow due to free radical scavenging. The absorbance was measured by using a spectrophotometer at 517 nm. The formula used to calculate the percentage of free radical scavenging is mentioned below.
25

Antiepileptic Activity
PTZ-induced seizures in mice were used to test anti-epileptic activity. Five sets of mice were created (5 mice in each group). PTZ (75 mg/kg, i.p.) was given to all groups except the first.
25
About 5 to 10 min after injection, the PTZ reaction occurs. The mice were monitored for half an hour after receiving the medication. The duration of seizure delay was measured as an indication of protection and was found to reflect anticonvulsant activity. The number of mice who had convulsions, the time it took them to die, and the time it took for them to have their first convulsion were all recorded. Mice were by beheaded immediately after the behavioral tests, and their brains were isolated quickly. Later ELISA, Immunohistology, and an in vivo antioxidant assay were performed.
A. Control group C: normal saline 10 ml/kg B. Standard group S : diazepam 1 mg/kg C. Test group t1 : 400 mg/kg D. Test group t2 : 600 mg/kg E. Diseases group D : 75 mg/kg
Enzyme Linked Immunosorbent Assays (ELISAs)
Using a Silent Crusher M, about 70 mg of cortical tissue was homogenized in PBS with phenylmethylsulfonyl fluoride (PMSF) as a protease inhibitor (Heidolph-Germany). The homogenate was then centrifuged for 20 min at 15,000 rpm at 4 °C, with the supernatant carefully collected from the top and the pellet at the bottom avoided. The concentration of protein in each group was then evaluated using a bicinchoninic acid (BCA) kit (Thermo Fisher Scientific, USA) and 96-well ELISA plates, according to the manufacturer's guidelines. The concentrations (pg/mL) were then adjusted to the total protein content (pg/mg total protein) using an ELISA microplate reader (BioTek ELx808). 26
Immunohistochemical Analysis
For immunohistochemistry analysis, we used a previously reported technique with minor changes. 27 After deparaffinization, slides were antigen-retrieved using an enzymatic technique, and then washed three times with PBS for five minutes each time. To quench endogenous peroxidase activity, the slides were submerged in 3% H2O2, and then washed in Phosphate buffer saline (PBS).The blocking serum was normal goat serum (5%) and the slides were incubated for 2 h. The slides were then treated overnight with Bcl2, Caspase 3, TNF-, and p-NFB primary antibodies. The next mornings, the slides were washed in PBS and incubated for 90 min with the secondary antibody, followed by 60 min in a humidified box with an ABC kit (Santa Cruz). After that, the slides were rinsed in Phosphate buffer saline PBS solution and stained with diaminobenzidine (DAB), followed by ethanol dehydration (70%, 80%, 90%, and 100%), slides were dehydrated and then treated with xylene before being covered with mounting medium. Images were captured using a light microscope and stored in TIFF format for subsequent analysis with Image J software. 28
Hematoxylin & Eosin (H&E) Staining
The tissue-coated slides were deparaffinized in 100% xylene before being rehydrated using a gradient ethanol concentration (100% to 70%). The slides were washed with distilled water and hematoxylin dye was rinsed for 10 min to find the nucleus. The slides were then placed in a glass jar and submerged in running water for 10 min before being treated with 1% HCl and 1% ammonia water, as previously reported.. After that, cytoplasmic staining with eosin solution was done for 5–10 min. The slides were washed with water and air-dried for a brief time once the time restriction was met. After being rehydrated with various degrees of ethanol, the slides were cleaned with xylene (70%, 95%, and 100%). Finally, mounting media was applied to the slides. The brain components were photographed using an Olympus light microscope (Japan). After that, imaging software was used to analyze the photos. Infiltrations, vacuole development, and neuronal survival were studied using five pictures per slide per group. TIFF images with the same threshold intensity were optimized for all groups. 29
in Vivo Anti-Oxidant Activity
Reduced Glutathione (GSH) Activity
The activity of reduced glutathione (GSH) was determined according to the procedure described in the reference provided by.28,30 The brain is carefully dissected and washed with ice-cold PBS. For tissue homogenization, the brain is placed in a buffer (0.1 M phosphate buffer, pH 7.4) and homogenized at 4 °C. The homogenate is centrifuged at 10,000 rpm for 10 min to collect the supernatant for the assays. For the GSH assay, the collected supernatant is deproteinized by mixing with 10% trichloroacetic acid (TCA) in equal volumes, followed by centrifugation at 10,000 rpm for 10 min to remove proteins. The supernatant is mixed with Ellman's reagent (DTNB) and incubated for 10–15 min at room temperature. The reaction produces a yellow compound that can be measured at 412 nm using a spectrophotometer. The concentration of GSH is then determined from a standard curve, with results expressed as nmol/mg protein or per gram of tissue. At a wavelength of 412 nm, absorbance was measured using a plate reader.
Glutathione-S-Transferase (GST) Activity
GST activity was assessed using CDNB as a substrate, as previously described with a minor change. 30 The supernatant is used directly without deproteinization. It contains phosphate buffer, reduced Glutathione (GSH), and 1-chloro-2,4-dinitrobenzene (CDNB). The absorbance is measured at 340 nm for 3 to 5 min, which reflect the conjugation of GSH to CDNB catalyzed by GST. Enzyme activity is calculated using the molar extinction coefficient of the conjugate product, with results expressed as nmol/min/mg protein or per gram of tissue.
Determination of Lipid Peroxidation (LPO)
The approach for determining lipid peroxidation in tissue was carried out as described previously. 27 Each rat's cortical and hippocampal tissues were homogenized separately in 10 mL of 20 mM Tris-HCl at 4 °C in the Polytron homogenizer while maintaining a pH of 7.4. After centrifuging the homogenate at 1000 g for 10 min at 4 °C, the supernatant was collected. A fresh ferric ammonium sulfate solution was made. The cortical and hippocampal tissues of each rat were homogenized individually in the Polytron homogenizer at 4 °C in 10 mL of 20 mM Tris-HCl while maintaining a pH of 7.4. The supernatant was obtained after centrifuging the homogenate at 1000 g for 10 min at 4 °C. It was necessary to make a new ferric ammonium sulfate solution. 40 microliters of the aforementioned solution were added to the collected supernatant, which was then incubated at 37 °C for 30 min. Then, to generate a 0.8% solution, 400 mg of 2-thiobarbituric acid (TBA) was dissolved in 50 mL of water. At a wavelength of 532 nm, a plate reader was utilized to detect absorbance.
Catalase Activity
The activity of catalase was determined by combining 3 mL of H2O2 with 0.05 mL of tissue supernatant. At 240 nm, the absorbance activity was measured against a blank containing only 3 mL of PBS. The absorbance is proportional to the amount of H2O2 present, which is reduced as catalase destroys H2O2. This is a measurement of H2O2 breakdown and is reported as mol H2O2 decomposed per mg of protein per minute. 31
Statistical Analysis
All experiments were conducted in triplicates, and data were expressed as mean ± standard deviation (SD). Statistical analyses were performed using GraphPad Prism 8.0 software. A one-way analysis of variance (ANOVA) was used to evaluate differences between groups. Additionally, a two-way ANOVA was carried out to compare variations among multiple factors.
For comparisons against the control group, statistical significance was represented by specific symbols: # for relevance and * for significant differences. A p-value of <0.05 was considered statistically significant. Graphical representations of data were created using GraphPad Prism to visually interpret the results.
Results
Total Flavonoid Content Test:
Its calibration curve was established by plotting absorbance versus concentration and a correlation y = 0.035x = 0.024 was obtained. Data is presented as mean value + SD and expressed as µg QE/mg extract respectively as shown in Figure 1 and data is presented in Table 1. The amount of flavonoid content found in plant extract was 39.45 µg /mg as shown in Table 2.
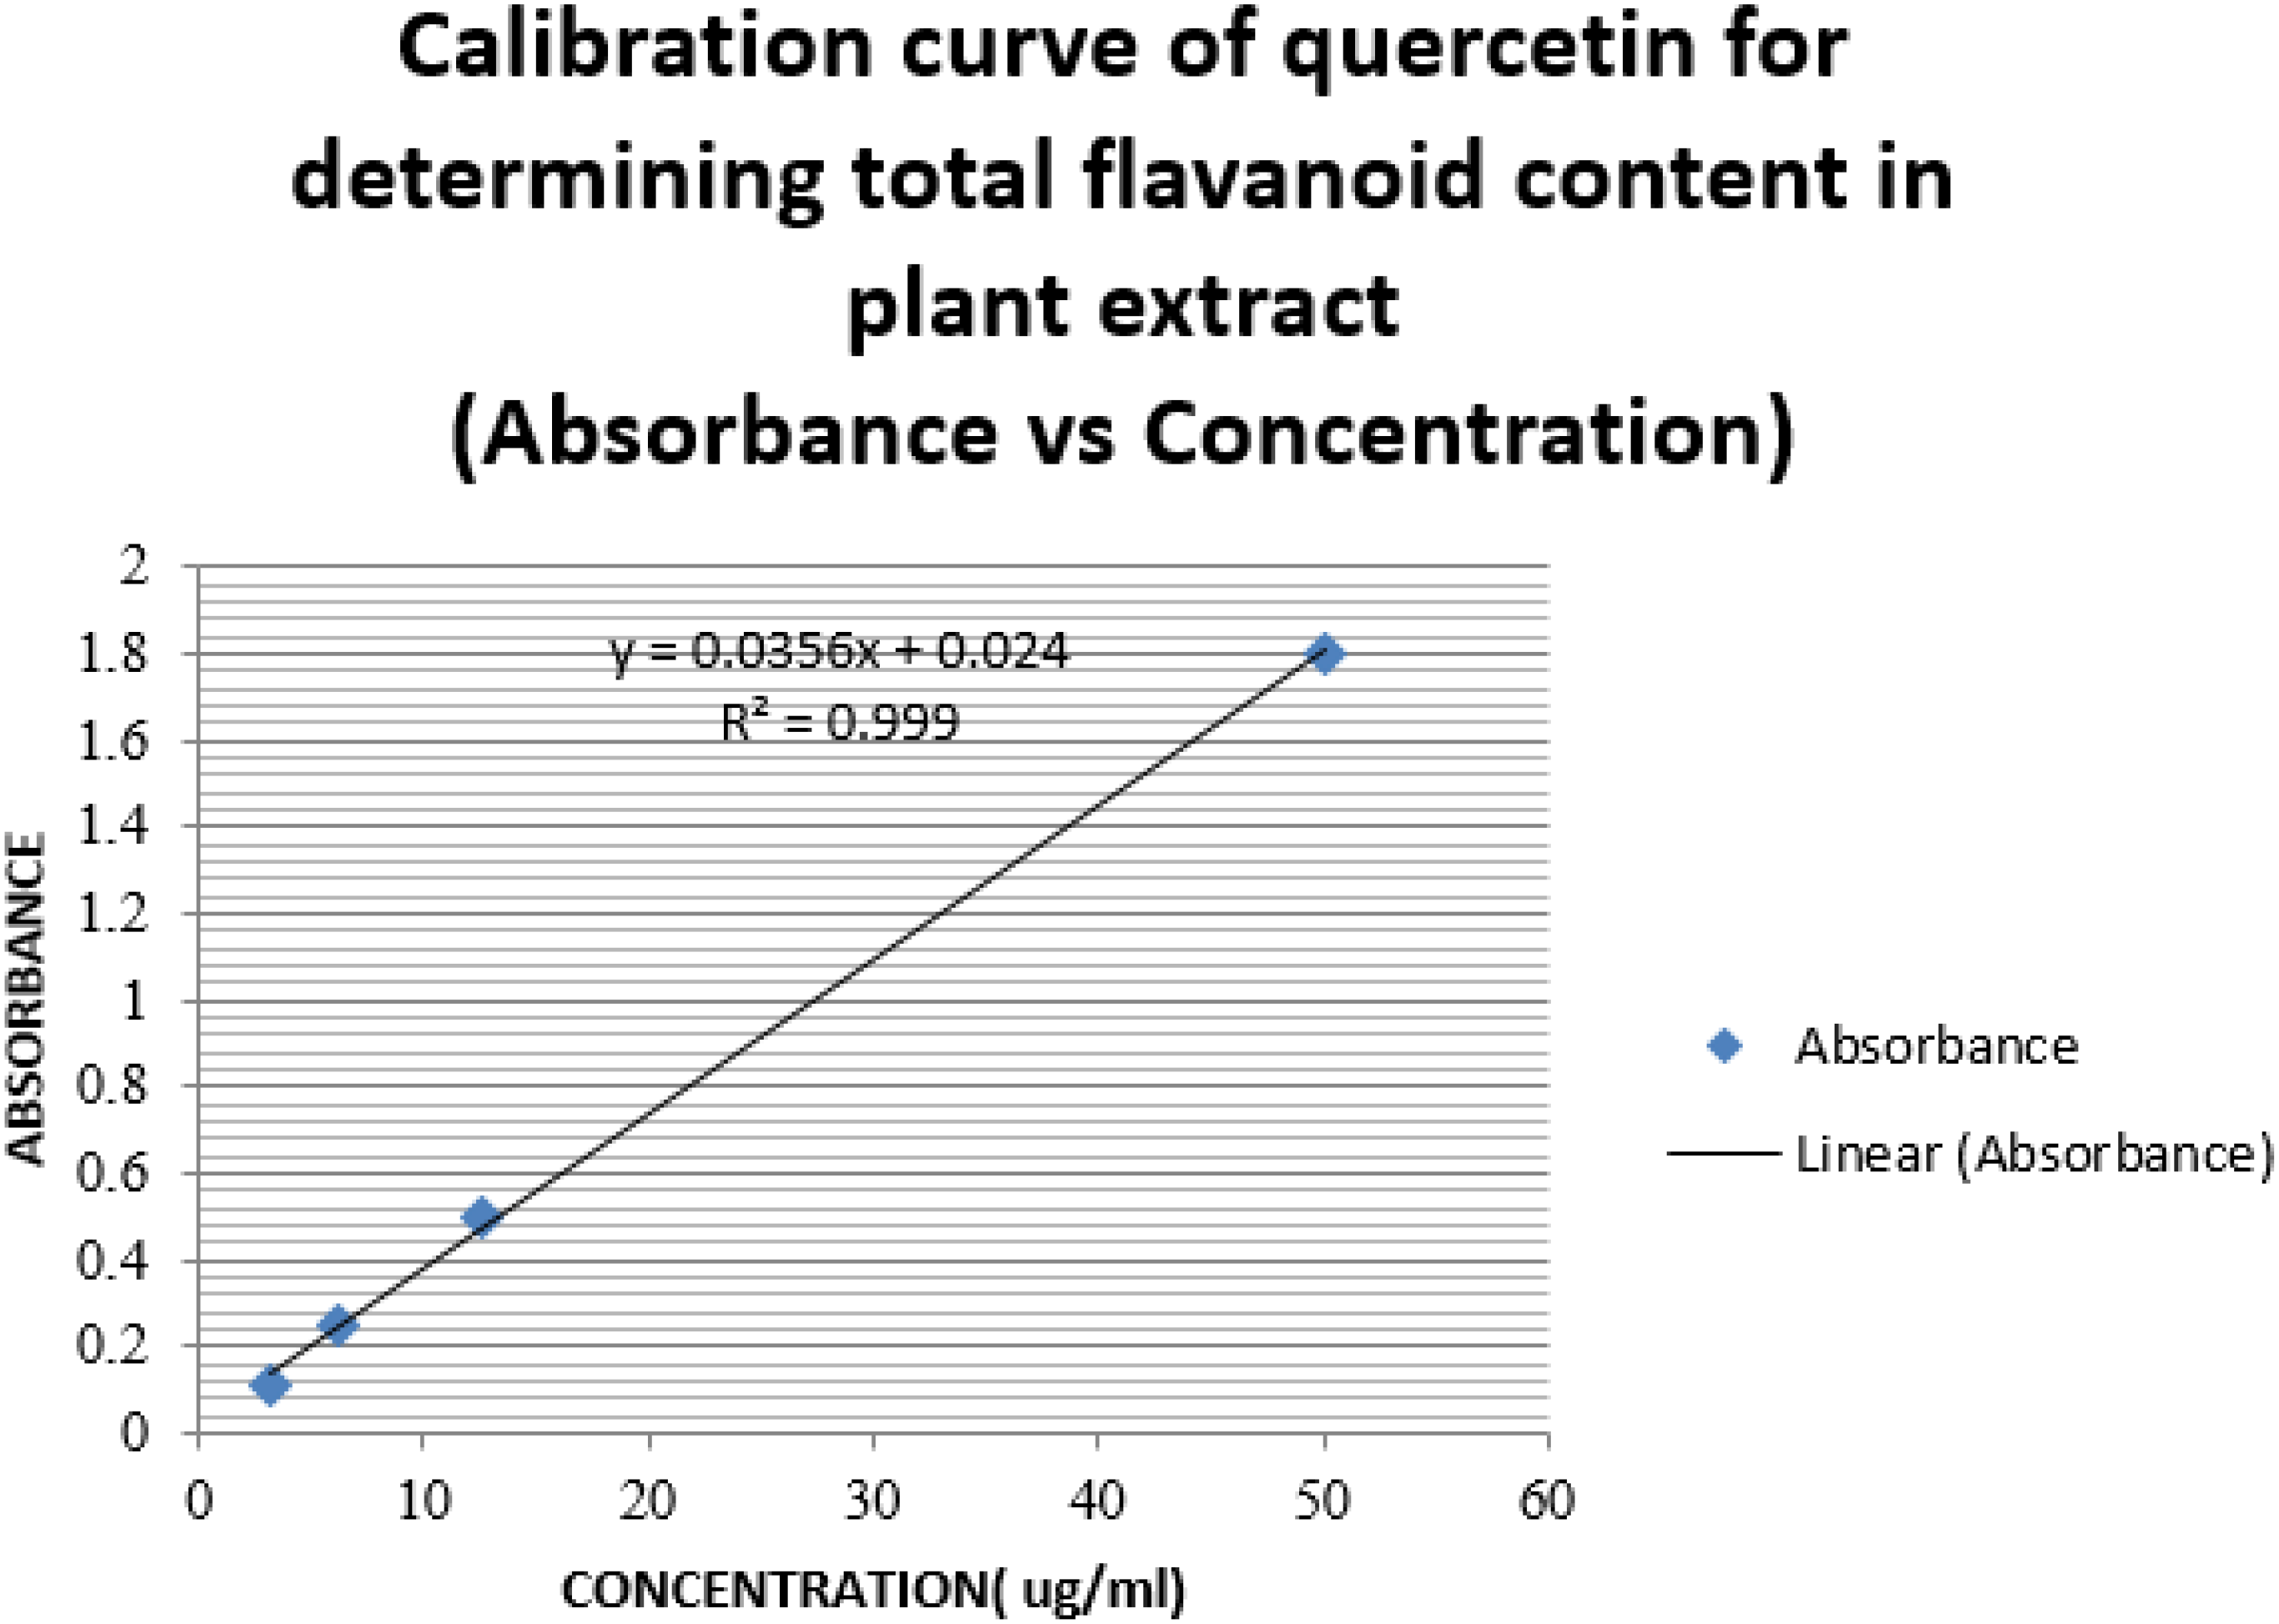
Calibration curve of Quercitin for determining total flavonoid content in plant extract absorbance on Y-axis and concentration on X-axis.
Absorbance values at different concentrations of Quercitin.
Amount of flavonoid content found in plant extract.

Total Phenolic Content Test
Different ug/ml concentrations of Gallic acid were taken; its UV absorbance was 760 nm as. Using these values calibration curve of Gallic acid was plotted.
Its calibration curve was established by plotting absorbance versus concentration and a correlation y = 0.075x = 0.022 was obtained. Data is presented as mean value + SD and expressed as µg QE/mg extract respectively as shown in Figure 2 and data is presented in Table 4. The amount of phenolic content found in plant extract was 39.45 µg /mg as shown in Table 3.

Gallic Acid standard curve obtained from phenolic assay.
Amount of Phenolic content found in plant extract.

Gallic Acid Concentration and its Absorbance Measured by UV Spectroscopy.

DPPH Free Radical Scavenging Assay
The antioxidant potential of Achillea millefolium extract at different concentrations and positive control is standard ascorbic acid. Plant extract shows best activity at 900 µg/mL 76% which is less than standard as the standard IC50 value was 92%.at 450 µg/mL. Methanol IC50 value was below 50%. The values of percentage inhibition at different concentrations are given in Table 5 and presented in the bar chart in Figure 3.

Show the antioxidant potential of Achillea millefolium extract at different concentrations and positive control is standard ascorbic acid. Plant extract shows best activity at 900 µg/mL 76% which is less than standard as the standard IC50 value was 92% at 450 µg/mL. Methanol IC50 value was below 50%.
Different concentrations of plant extract and IC50 value were calculated by formula along with the positive and negative controls.

Antiepileptic Activity
The diseased group n = 5 was given PTZ 75 mg/kg via intraperitoneal onset and the duration of the seizure was measured. The first jerk of seizure was at 36-s first dose PTZ. The duration of the tonic colonic seizure was 40 s After 30 mins all the mice in the diseased group were dead. The Achillea millefolium shows the best result at 600 mg/kg with zero mortality percentage. It prolongs the duration of seizure latency. Prolongation of duration of seizure latency was taken as an index of protection & indicates anticonvulsant activity. The T1, T2, and standard groups prolong the duration of seizure latency. The T2 600 mg/kg and standard group show zero mortality. There was the death of one mouse occurred in the T1 group. The onset, duration of seizures, and survival of animals are given in Table 6. And bar chart is given in given in Figure 4.

Time of commencement of myoclonic, tonic-clonic, and clonic seizure, as well as the duration of the clonic phase of the seizure (seizure latency) and animal survival status.
Time of commencement of myoclonic, tonic-clonic, and clonic seizure, as well as the duration of the clonic phase of the seizure (seizure latency).

Enzyme-Linked Immunosorbent Assays (ELISAs)
NFKB was measured by ELISA data were expressed by + SEM. ###p < 0.001 indicates a significant difference compared to the control group. Standard group ***p < 0.001 and treatment group **p < 0.01 significance difference to diseased group ###p < 0.001.as shown in Figure 5.
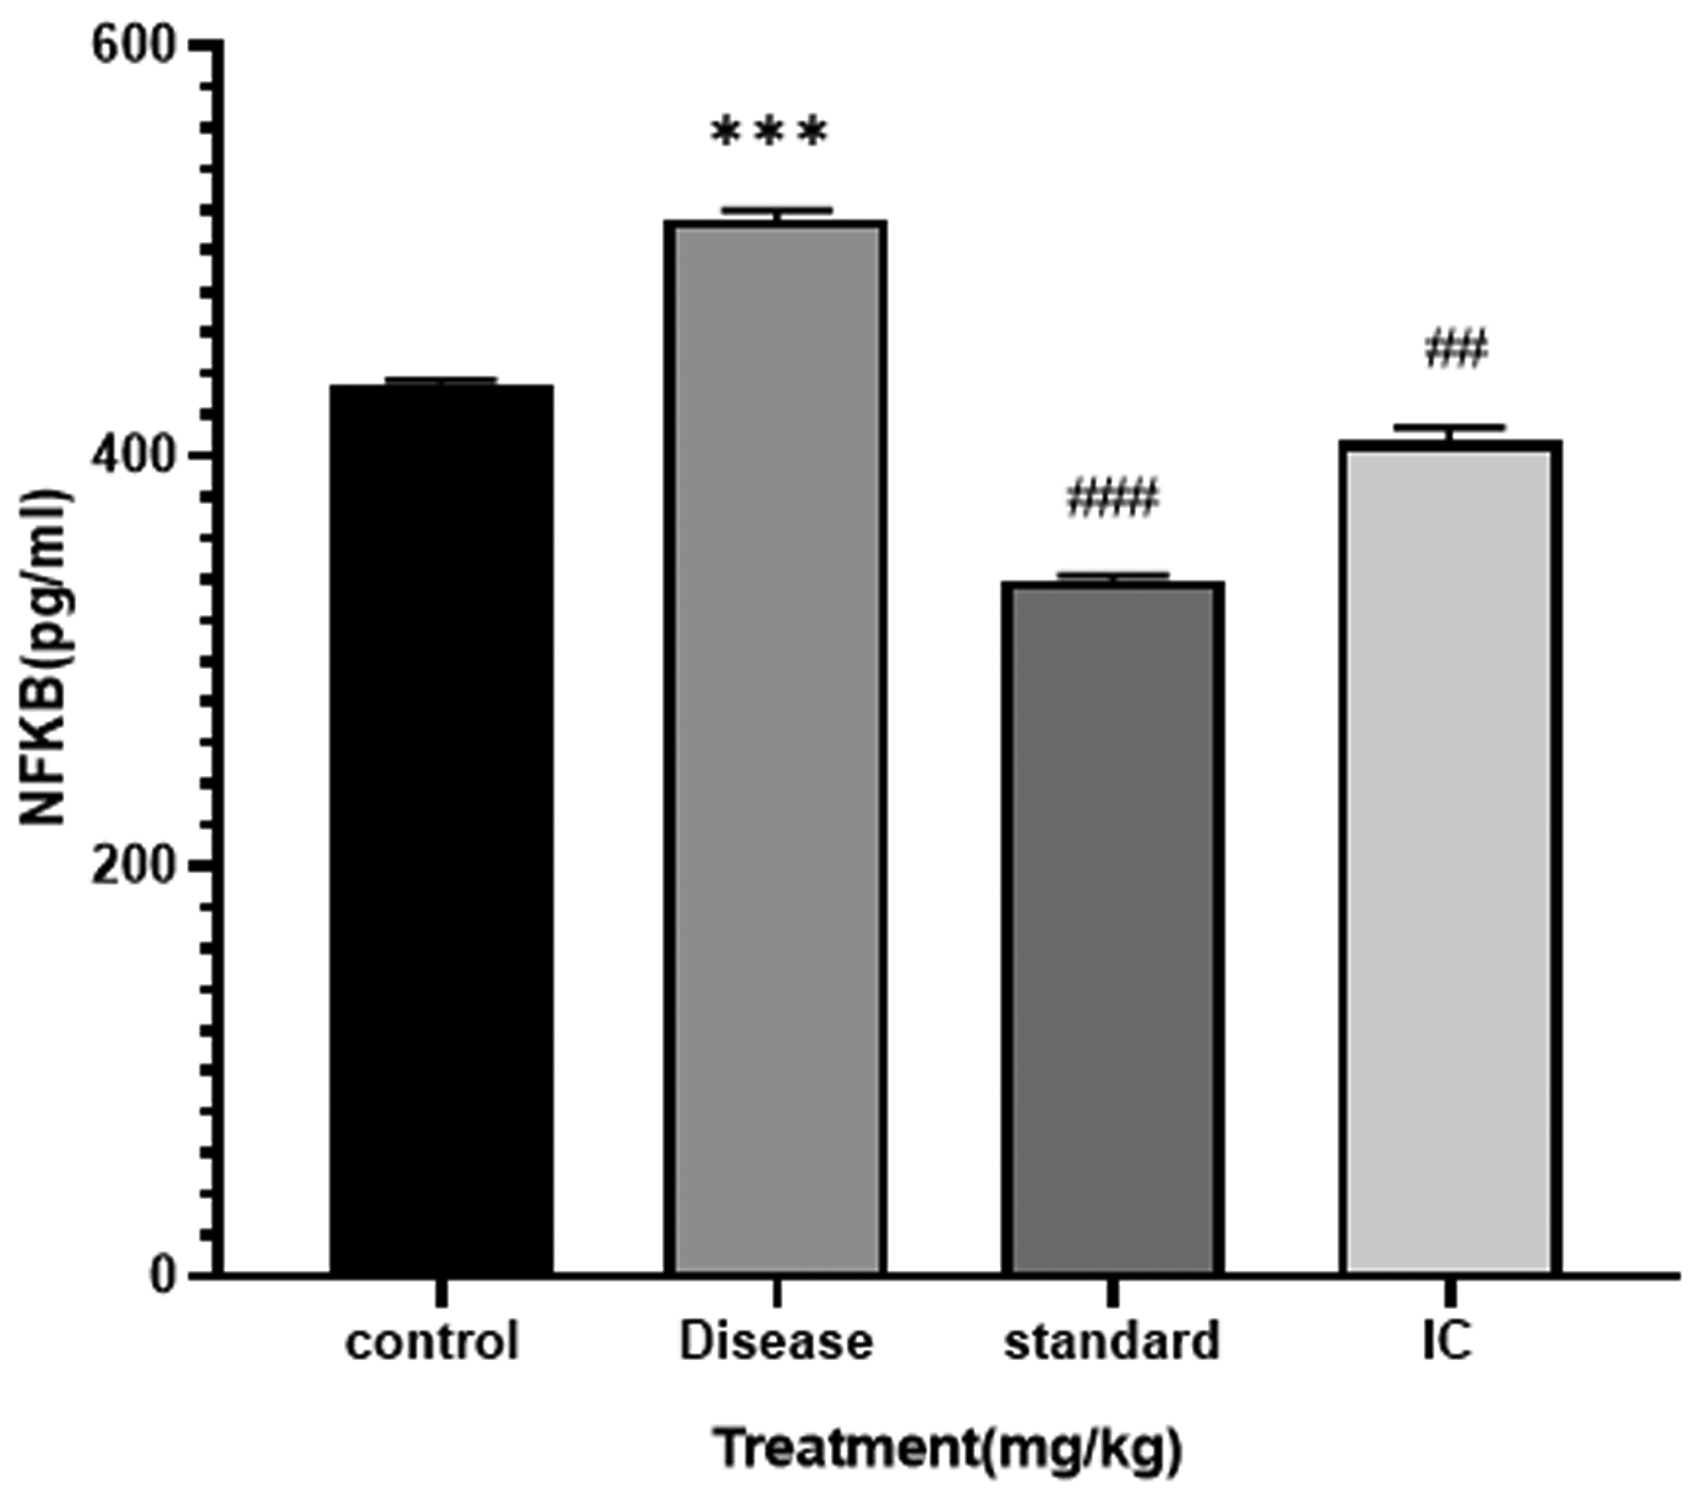
NFKB was measured by ELISA data were expressed by + SEM. ###p < 0.001 indicate a significant difference compared to the control group. Standard group ***p < 0.001 and treatment group **p < 0.01 significance difference to diseased group ###p < 0.001.
Immunohistochemical Analysis
Immunochemistry results for cox2 in the cortex region are explained by the above graph. Data expressed in + SEM.***p < 0.001 show a significant difference between the control group and the standard group. ##p < 0.01 and ##p < 0.01 indicates significant difference compared to the diseased group as shown in Figure 6. Immunochemistry results for NFKB in the cortex region are explained by the above graph. Data expressed in + SEM.***p < 0.001 show a significant difference between the control group and the standard group. ##p < 0.01 and ##p < 0.01 indicate significant differences compared to the diseased group Figure 7.

(A & B) Immunochemistry result for COX-2 in the cortex region expressed in + SEM.***p < 0.001 shows a significant difference between the control group and the standard group. ##p < 0.01 and ##p < 0.01.

(A & B) Immunochemistry result for nFkB in the cortex region expressed in + SEM.***p < 0.001 shows a significant difference between the control group and the standard group. ##p < 0.01 and ##p < 0.01.
Immunochemistry results for TNF-α in the cortex region are explained by the above graph. Data expressed in + SEM.***p < 0.001 show a significant difference between the control group and the standard group. ##p < 0.01 and ##p < 0.01 indicates significant difference compared to the diseased group Figure 8.

(A & B) Immunochemistry result for TNF-α in the cortex region expressed in + SEM.***p < 0.001 shows a significance difference between the control group and the standard group. ##p < 0.01 and ##p < 0.01.
Result data were expressed in + SEM. Diseased group ***p < 0.001 indicated a significant difference compared to the normal group. ###p < 0.001, ##p < .01 and ##p < 0.01 compared to the diseased group.
Hematoxylin & Eosin (H&E) Staining
Hematoxylin and eosin (H&E) staining of the cortex reveals the extent of surviving neurons. The graph mentioned above shows surviving neurons were high in the control group to which we have given only normal saline. After the control graph show standard group shows more. Results data are expressed as mean + SEM followed by One way ANNOVA. ###p < 0.001 reveals a substantial difference between the diseased and control groups.***p < 0.001 on standard group show significance from diseased group ###p < 0.001. Treatment 1 (400 mg/kg) plant extract **p < 0.01 and Treatment 2 (600 mg/kg) group **p < .01 indicates a significant difference between with standard and disease groups shown in Figure 9.

(A & B). Hematoxylin and eosin (H&E) staining of the cortex, results data are expressed as mean + SEM followed by one-way ANNOVA. A significant difference between disease and control###p < 0.001. The difference between disease and control showed significant ***p < 0.00. difference between Treatment 1 and Treatment 2 groups is shown **p < 0.01and **p < .01respectively.
In Vivo Anti-Oxidant Activity
Reduced Glutathione (GSH) Activity
Below the graph indicates there is a significant difference between the diseased group ***p < 0.001 compared with a control group and standard group with ##p < 0.001.###p < 0.001 and ###p < 0.01 indicates a significant difference compared to the control group as shown in Figure 10.
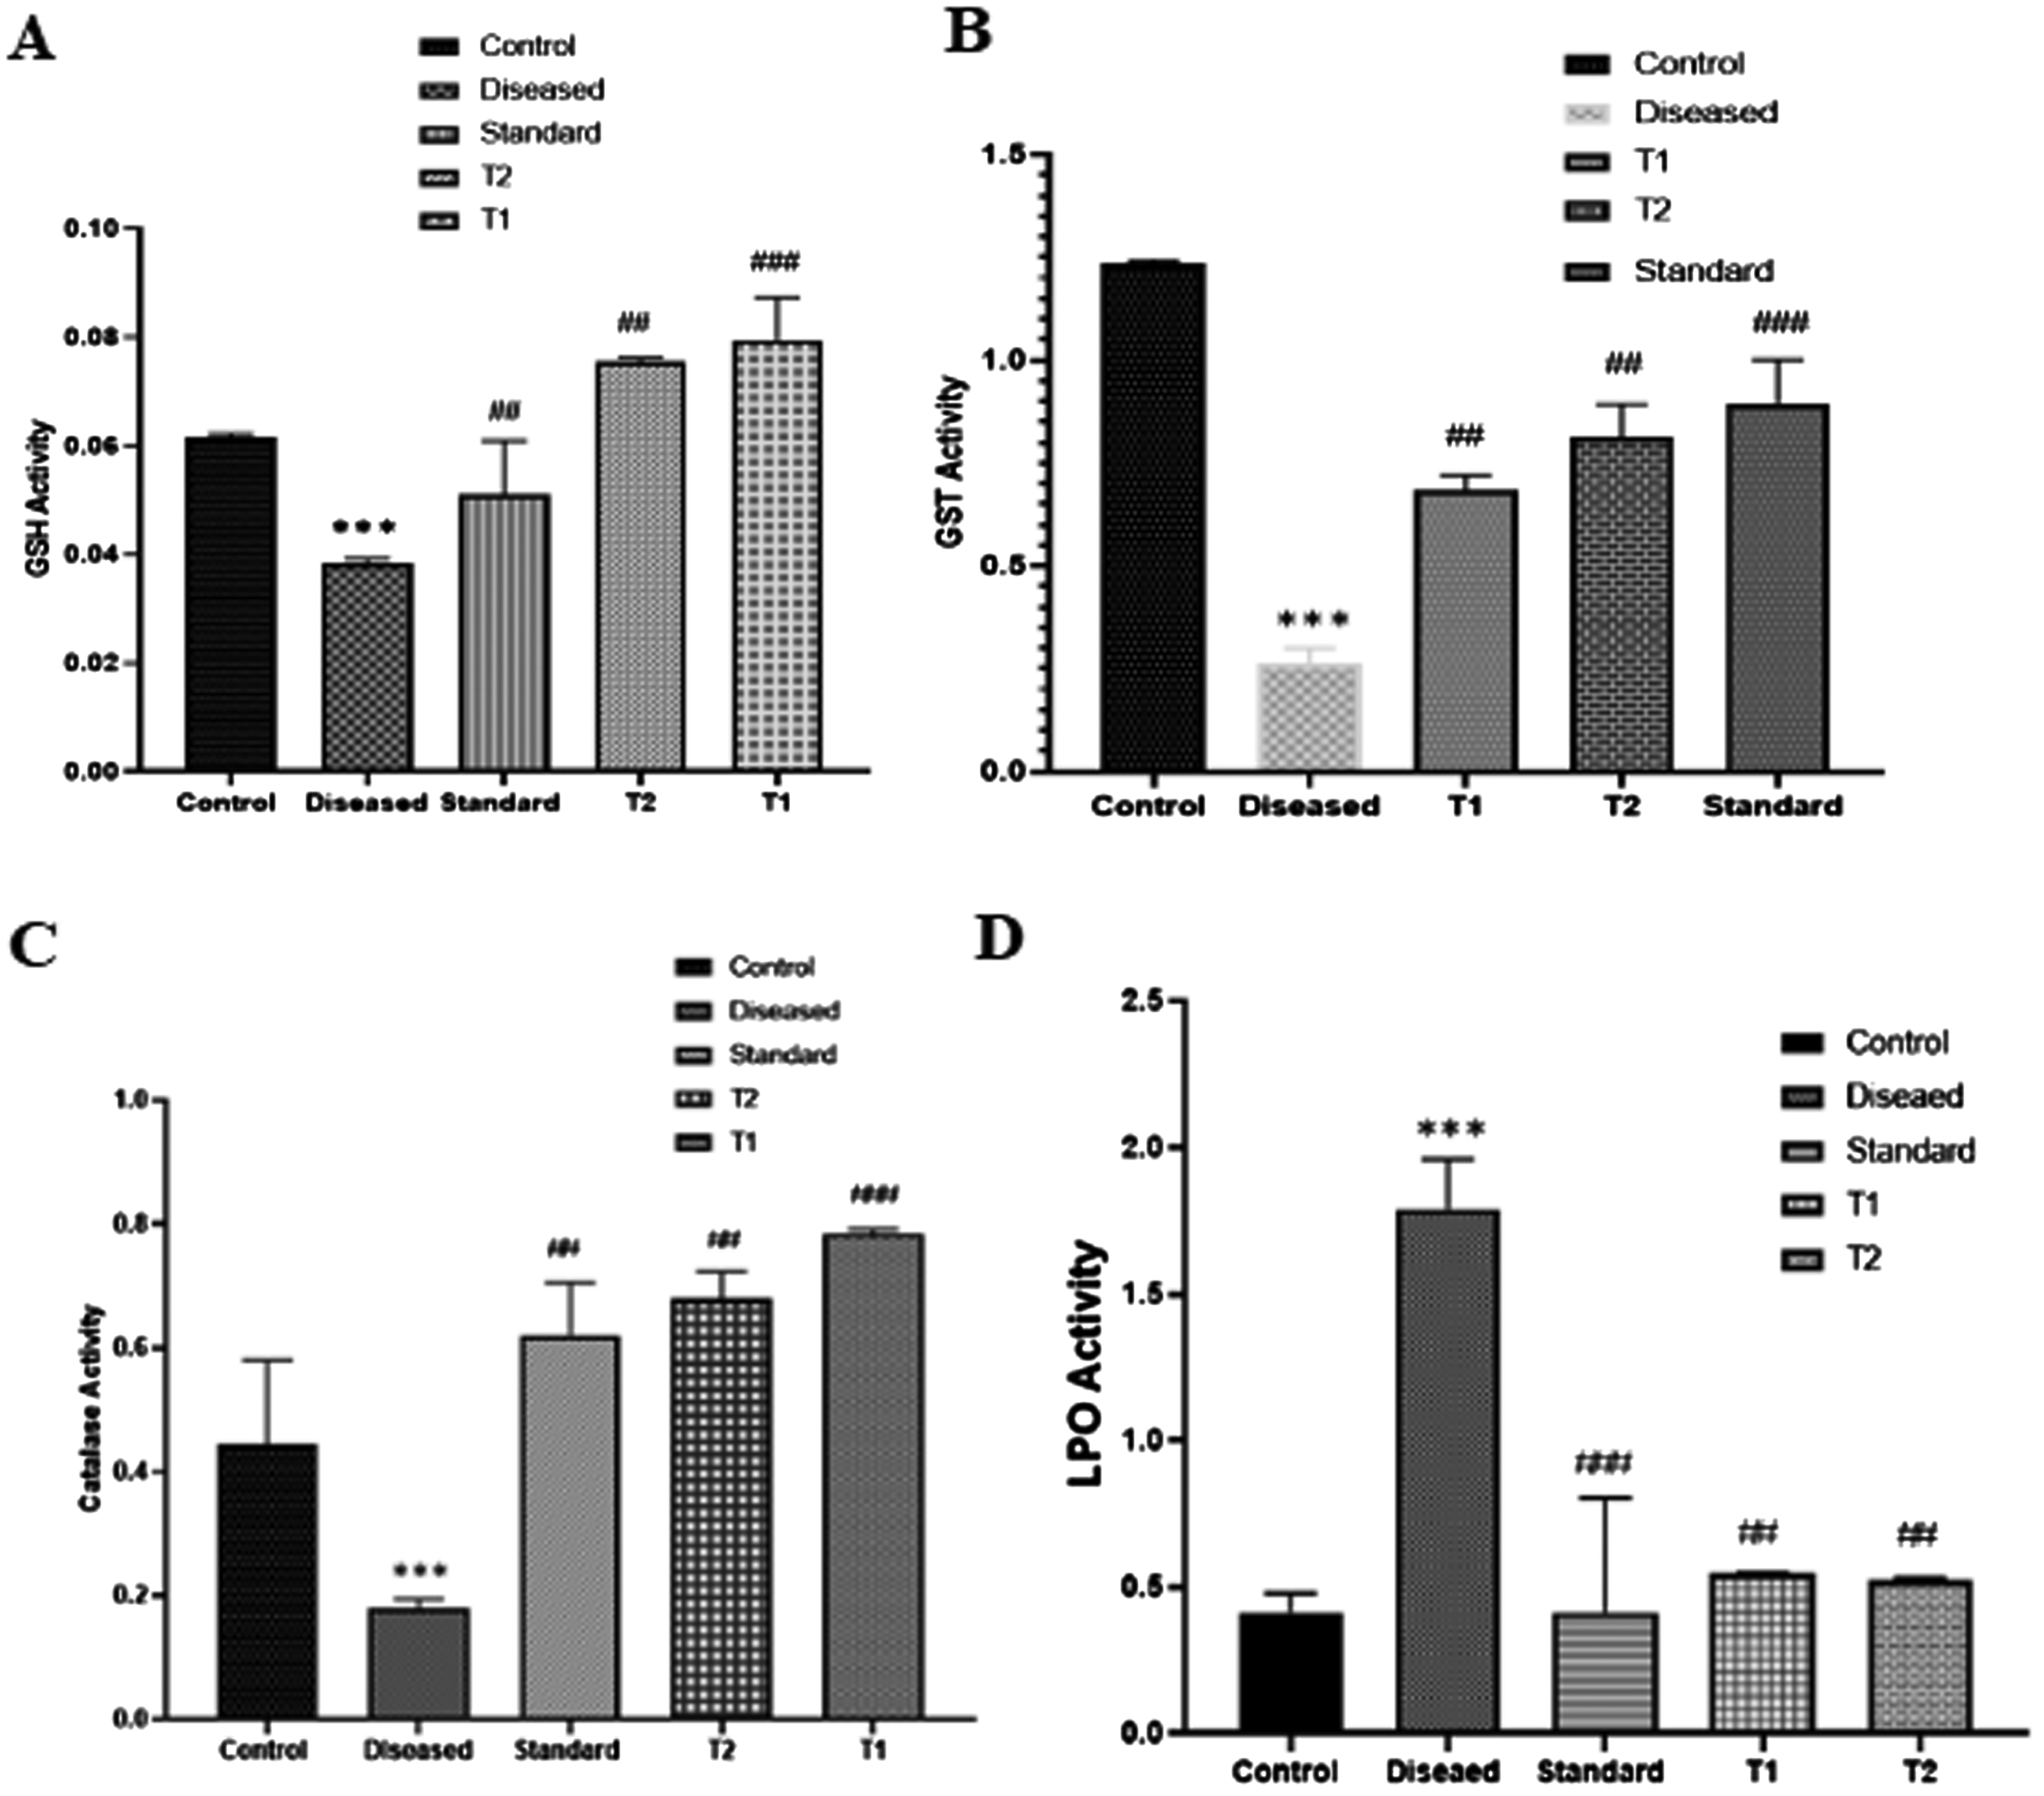
(A-D) The graph indicates a comparison of catalase activity, LPO assay, GST and GSH activities in 5 different groups of mice. If we compare diseased group with control group. Data was expressed in + SEM. there is a significance difference of diseased group ***p < 0.001 compared with control group and standard group with ##p < 0.001.###p < 0.001 and ###p < 0.01 indicates a significant difference compared to the control group.
Glutathione-S-Transferase (GST) Activity
The levels of GST in the prefrontal cortex were evaluated to determine the neuroprotective role of plant extract on antioxidant enzymes. Results data are expressed as mean + SEM followed by One way ANNOVA. The above graph indicates there is a significant difference between the diseased group ***p < 0.001 compared with a control group and standard group with ###p < 0.001.###p < 0.001 and ###p < 0.01 indicates a significant difference compared to the control group,
Determination of Lipid Peroxidation (LPO)
The effect of antioxidant enzyme Lipid peroxidation in the cortex region of mice's brains is explained by the graph mentioned above. Data was expressed in + SEM. There is a significant difference between the diseased group ***p < 0.001 compared with a control group and standard group with ##p < 0.001.###p < 0.001 and ###p < 0.01 indicates a significant difference compared to the control group.
Catalase Activity
The below graph indicates a comparison of catalase activity in 5 different groups of mice. If we compare the diseased group with the control group.
Discussion
In the context of our research, we conducted a literature review focused on Achillea millefolium, revealing a wide range of reported pharmacological activities and phytochemical compounds. These pharmacological activities include anti-inflammatory, antibacterial, anticancer, spasmolytic, antidiabetic, choleretic, hepatoprotective, wound healing, repellent, appetite regulation, anxiolytic, skin-rejuvenating, anthelmintic, hypotensive, vasodilator, bronchodilator, antiproliferative, antiulcer, and immunosuppressive properties, Alzheimer, Parkinson and neuroprotective effect. 8 Achillea millefolium contains various flavonoids and phenolic compounds such as choline, 1,3-dicaffeoylquinic acid (DCQA), apigenin 4-O-glucoside, chlorogenic acid, coumaric acid, stachydrine, carboxylic acid, salicylic acid, and pyrocatechol. 32 Additionally, key flavonoids found in the plant include luteolin, myricetin, naringin, naringenin, kaempferol, and quercetin. 33 In addition to flavonoids and phenol, A. millefolium is also a rich source of other bioactive compounds, including terpenoids, alkaloids, and essential oils. Notable constituents include sesquiterpene lactone ester A, sesquiterpene lactone ester B, sesquiterpene lactone-diol, camphor, borneol, carvacol,β-caryophyllene, chamazulene, as well as amino acids such as lysine, tyrosine, and tryptophan. 34 These findings suggest that the ethanolic extract of A. millefolium contains a potent combination of chemical constituents, which could be further explored as a natural antiepileptic agent.
Epilepsy's pathophysiology is associated with heightened neuronal excitability and the overproduction of free radicals. The brain is particularly vulnerable to free radical-induced harm because of its elevated oxidative metabolism, constrained antioxidant defenses, and abundant presence of polyunsaturated fatty acids. 35 The involvement of oxidative and nitrosative stress is considered pivotal in the development of epilepsy. Numerous investigations, spanning animal models and genetic studies, have demonstrated that prolonged seizures lead to heightened mitochondrial oxidative stress, precipitating cellular damage.36,37 The connection between free radicals and seizures may involve multiple mechanisms. For example, free radicals can trigger seizures by directly inactivating glutamine synthase, leading to an abnormal release of excitatory neurotransmitters such as glutamic acid. Additionally, oxygen-induced convulsions in animals have been linked to reduced levels of GABA in the brain cortex, which occurs due to the inhibition of the enzyme glutamate decarboxylase by oxygen free radicals. 38
In the context of ongoing efforts to discover new lead candidates for antiepileptic medications, this study aims to assess the potential antiepileptic and antioxidant properties of Achillea millefolium. Therefore, the principal aim of our research was to investigate its potential anticonvulsive properties using an animal model, specifically mice. We prepared an Achillea millefolium plant extract using the maceration method and subsequently subjected it to phytochemical and pharmacological evaluations.
Consequently, in the current study antioxidant activity of the plant extract was evaluated through the DPPH scavenging method. Additionally, we conducted quantitative assessments to determine the concentrations of phenolic and flavonoid compounds within the extract. Our DPPH assay revealed that the plant extract, at a concentration of 900 µg/ml, exhibited its maximum antioxidant activity at 76%. This efficacy surpassed that of the standard ascorbic acid, with an IC50 value of 92%. We measured the amount of phenolic compounds in the plant extract using the Folin Ciocalteu reagent for the phenolic content assessment. According to the findings, the concentration was 16.41 µg GAE/mg. Likewise, employing quercetin as the benchmark for the flavonoid content measurement, we ascertained that the plant extract contained 39.41 µg QE/mg of flavonoids. The results emphasize the substantial flavonoid and phenolic content of Achillea millefolium and underscore the plant's potential for potent antioxidant activity. Additionally, it is noteworthy that a diverse array of flavone derivatives could serve as crucial building blocks for synthesizing robust and specific benzodiazepine receptor ligands. Studies focused on neuroactive flavonoids present in herbal remedies have the potential to demonstrate the effectiveness of these substances as therapies for disorders mediated by GABAA receptors. 39
The antioxidant activity demonstrated in this study against DPPH in vitro may be associated with its anticonvulsant effect. 40
To assess the anticonvulsive potential, we administered Achillea millefolium extract at concentrations of 400 mg/kg and 600 mg/kg intraperitoneally to mice, inducing seizures with PTZ. The mice were categorized into five groups, each consisting of five individuals. Two groups received the plant extract (T1 and T2), one group received diazepam as a standard treatment, and the control group did not receive PTZ.
Following an hour of observation, the animals were sacrificed, and their brain tissues were collected for subsequent immunohistochemical analysis and H & E staining. Immunohistochemistry revealed a marked reduction in the expression of pro-inflammatory markers such as COX-2, TNF-α, and NF-kB in the test and standard groups, suggesting the effectiveness of the plant extract in preventing neurodegeneration.
H & E staining employed to identify various cell types and structural changes at the cellular level, displayed a higher number of surviving neurons in the treatment group compared to the diseased group, highlighting the plant extract's remarkable neuroprotective potential. Furthermore, we conducted in vivo antioxidant activity assessments on the mice brains, measuring various antioxidant enzymes such as GSH, GST, Catalase, and lipid peroxidation.
Reactive oxygen species (ROS)-induced oxidative stress is closely linked to neuroinflammation, which exacerbates neuronal disorders. Various inflammatory mediators and proinflammatory cytokines, such as TNF-α, COX-2, interleukin-6, interleukin-10, inducible nitric oxide synthase (iNOS), and nuclear factor kappa B (NF-κB), play key roles in neuroinflammation.41,42 Besides their free radical scavenging effects, the neuroprotective potential of Achillea millefolium may also be attributed to its ability to enhance endogenous antioxidant proteins, such as GST, GSH, and catalase, and to reduce lipid peroxidation (LPO) and proinflammatory mediators. Our data support the hypothesis that Achillea millefolium can mitigate PTZ-induced neuronal toxicity by modulating cytokine expression, inhibiting the inflammatory cascade, and boosting antioxidant enzyme activity.
Conclusions
The current research has concluded that Achillea millefolium aerial part ethanolic extract shows potential activity against PTZ-induced seizure. Flavonoid content assay and phenolic content assay was performed to the check amount of phenol and flavonoid in plant extract at different concentration. Data is presented as mean value + SD and expressed as µg QE/mg and µg GAE/g extract respectively. The flavonoid in the plant extract was 39.41 µg/mL. The amount of phenol in plant extract was 16.41 µg/mL. In vivo, studies like ELISA, IHC, and antioxidant assay were performed to check the effect of Achillea millefolium extract on mice's brain cortex region. All the results clearly indicate that Achillea millefolium is enriched with important chemical constituent's flavonoid and phenol. In vivo, result on mice brain shows that it has significant neuroprotective potential and its flavonoid component has antioxidant activity that protects against brain cell membrane damage.
Limitation:
The study focused on total flavonoid and phenolic content, yet the crude extract likely contains various other bioactive compounds that were not identified or quantified. Further isolation and characterization of individual components would provide a more comprehensive understanding of the extract's bioactivity. Second, the study was limited to an in vivo model using PTZ-induced seizures in mice, which may not fully replicate the complexity of epilepsy in humans. Additionally, while antioxidant and anti-inflammatory activities were measured, other potential mechanisms of action, such as interactions with neurotransmitter systems, were not explored in depth. Lastly, the absence of dose-response studies limits our understanding of the optimal therapeutic dose and safety profile of the extract. Further research, including clinical trials, is required to validate these findings.
Footnotes
Acknowledgements
The authors are thankful for the prodigious support of lab staff, the Pharmacology & Pharmaceutical Chemistry department of Riphah International University for providing lab facilities and human support.
Animal and Human Rights Statement
The authors declare that all the animal studies performed during this research was done under the guidelines of Research and Ethical Committee (REC) of Riphah International University Islamabad. Pakistan.
Authors’ Contributions
G.A.M: supervisor, idea generator, M.K: co-supervisor, review and edit the manuscript, S.H: writing original draft, Z.A & M.J.T: experimental work.
Availability of Data and Materials
Data will be made available on request.
Declaration of Conflicting Interests
The authors declared no potential conflicts of interest with respect to the research, authorship, and/or publication of this article.
Ethical Approval
During the experimentation stage, every procedure was carried out according to the protocols and approved by the Research and Ethical Committee (REC) at Riphah International University (Approval ID: Ref: No. REC/RIPS/ 2020/25).
Funding
The authors received no financial support for the research, authorship, and/or publication of this article.
Statement of Consent
The authors give their consent for personal information related to the subject to be published by SAGE publishing.