
Abstract
Background
The prevalence of obesity is rising worldwide. Due to the side effects associated with modern drugs, there is a need for an alternative treatment for obesity management. Triphala (TP), a polyherbal formulation from Ayurveda, is used by Ayurvedic physicians for weight loss.
Purpose
This study was designed to evaluate the effects of TP on obesity at the biochemical, histological, and molecular levels.
Materials and Methods
Male Wistar rats (125–150 g, 6–7 weeks old) were fed with a high-fat diet (HFD) for total of 48 days. From day 24 to day 48, along with HFD, rats were given an aqueous extract of TP (50, 100, and 200 mg/kg/day) or atorvastatin (1.2 mg/kg/day). Biochemical parameters were estimated in serum. Histopathology was done for the liver and adipose tissue. Levels of the genes involved in lipid metabolism were determined by quantitative real-time polymerase chain reaction (qRT-PCR). Monoamine levels were estimated from the brain tissue.
Results
At the end of the study (day 48), compared to only HFD receiving group (DC), all TP-treated groups showed a significant decrease in body weight, serum glucose, total cholesterol, triglycerides, leptin, interleukin-6, C-reactive protein, malondialdehyde, and noradrenaline levels. High-density lipoprotein, adiponectin, superoxide dismutase, serotonin, and dopamine levels were found to be increased compared to DC rats. Expression of various genes involved in lipid metabolism was found to be down regulated only in TP 100 group compared with DC. Additionally, all TP groups showed a reduction in adipocyte size and restored monoamine levels.
Conclusion
The aqueous extract of TP had shown an anti-obesity effect as demonstrated by lowering inflammation and oxidative stress, adipocyte size, and modulation of expression of genes involved in lipid metabolism.
Introduction
Triphala (TP; Tri = three and phala = fruits) is a polyherbal formulation from Ayurveda, an Indian traditional medicinal system. It contains fruits of three plants, namely Terminalia chebula, Phyllanthus emblica, and Terminalia bellirica in equal proportion (Jantrapirom et al., 2021). It is commonly prescribed for disorders of the gastrointestinal system (Peterson et al., 2017). Its safety is proven not only through a long history of safe use but also in well-planned toxicity studies. Lately, various pharmacological activities of TP have been reported, such as anti-hyperlipidemic (Saravanan et al., 2007), anti-diabetic (Prativadibhayankaram et al., 2008), antioxidant (Peterson et al., 2017), anti-inflammatory (Jantrapirom et al., 2021), and immunomodulation (Belapurkar et al., 2014).
TP is extensively used by Ayurvedic physicians for weight reduction (Banjare & Bhalerao, 2016). Its anti-adipogenic activity through the modulation of expression of lipogenic genes in 3T3-L1 pre-adipocytes and differentiated mature adipocytes has been reported (Banjare et al., 2017). TP has exhibited a reduction in body weight, energy intake, and percentage of body fat in a model of high-fat diet (HFD)-induced obesity in mice (Gurjar et al., 2012; Phimarn et al., 2021). In a clinical study, TP has shown a promising effect on the reduction of weight, circumferential measurements, and body fat (Salunke et al., 2019). In another clinical study from Iran, the effect of TP on reducing body weight along with waist and hip circumference as compared to the placebo was shown (Kamali et al., 2012). However, in-depth studies on the mechanism of anti-obesity action of TP are missing.
Obesity is an outcome of complex interactions between biological, psychosocial, and environmental factors, though its exact pathophysiology is not completely understood. Its prevalence is increasing rapidly worldwide due to changed lifestyle (Forhan & Gill, 2013). On the other hand, several pharmacological drugs developed for obesity management have been withdrawn from the market due to their adverse effects (Onakpoya et al., 2016). Currently “Orlistat” is the only available anti-obesity drug (Bansal et al., 2020). However, it is associated with undesirable effects such as abdominal pain and diarrhea (Bansal et al., 2020; Ioannides-Demos et al., 2011). Hence, there is a need for an evidence-based alternative to the management of obesity. With this background, we aimed to study the anti-obesity effect of TP at biochemical and molecular levels.
Materials and Methods
Procurement of Study Drugs
Standardized and powdered aqueous extract of TP was procured from Pharmanza Herbal Pvt. Ltd. (Gujarat, India). TP had a 9% gallic acid content (by high performance liquid chromatography (HPLC)) and a 60% tannin content. It was stored in an airtight container at room temperature. Atorvastatin, an anti-hyperlipidemic drug used as a positive control (PC), was procured from the local pharmacy (Lipvas, Cipla Ltd.).
Ethical Statement
This study was initiated after obtaining approval from the Institutional Animal Ethics Committee (IAEC) of Bharati Vidyapeeth (Deemed to be University) Medical College, Pune, India (BVDUMC/3293/2016/007/002) and was carried out following “Committee for the Purpose of Control and Supervision of Experiments on Animals” (CPCSEA) guidelines.
Animals and Treatments
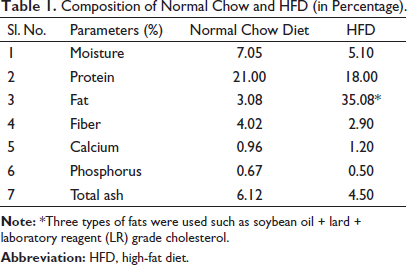
Thirty-six male albino Wistar rats (125–150 g, 5–6 weeks old) were procured and kept under standard laboratory conditions (temperature 22 ± 2°C, 12:12 h light and dark cycle, and 55 ± 5% humidity). After acclimatization, they were randomly divided into six groups (n = 6 per group). Of these six groups, group 1 served as normal control (NC) that received a normal chow diet, while other groups received HFD (35.80% fat) throughout the study duration. The composition of the normal chow diet and HFD is presented in Table 1.
Composition of Normal Chow and HFD (in Percentage).
Experimental Design
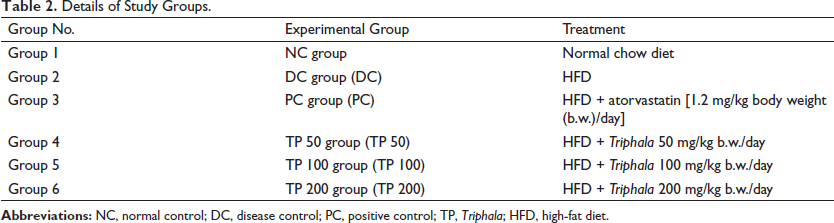
The details of the study groups are provided in Table 2. Except first group (NC), all the groups received HFD for the entire duration of the study (i.e., 48 days). Group 2 received HFD but no other treatment, served as disease control (DC). Group 3 received atorvastatin (1.2 mg/kg/day), which was the PC group, while groups 4–6 received TP in three different doses, such as 50, 100, and 200 mg/kg/day. These doses were selected on the basis of earlier reported studies on herbal drugs in a similar model (Meriga et al., 2017; Singh & Mani, 2015). Atorvastatin and TP were administered using oral gavage needles.
Details of Study Groups.
Blood was collected from these rats on day 0, 24, and 48 retro-orbitally after overnight fasting. On day 48, after sacrificing the rats, their liver, visceral adipose tissue, and brain were collected and stored appropriately till further use.
Biochemical Estimations from the Serum
From the serum separated from the collected blood, total cholesterol, triglycerides, high-density lipoprotein (HDL), and glucose were estimated using commercially available kits (Coral Clinical Systems, India). Leptin, adiponectin, interleukin-6 (IL-6), and C-reactive protein (CRP) were analyzed using enzyme-linked immunosorbent assay kits (ELISA kits, Cloud Clone, USA). For the estimation of oxidative stress in the liver, snap-frozen tissue was used. Lipid peroxidation as malondialdehyde (MDA) was measured in liver homogenates using the thiobarbituric acid reactive substances (TBARS) method (Melo et al., 2013). Superoxide dismutase (SOD) activity was assessed by McCord and Fridovich method in the liver homogenates (Wheeler et al., 1990).
Histological Examination of the Liver and Adipose Tissue
For histological examination, sections of the liver and visceral adipose tissue were immediately fixed in 10% neutral buffered formalin, and histological examination was carried out by hematoxylin and eosin staining. Additionally, in the case of adipose tissue, adipocytes diameter was measured using an EVOS inverted microscope (Thermo Fisher Scientific, USA). The method mentioned by Li et al. (2009) was followed with some modifications. Briefly, images from various fields of 5–7 µM thick sections of formalin-fixed adipose tissues from all the groups were taken using an EVOS inverted microscope at 40× magnification. Using ImageJ software, the diameters of adipocytes were manually measured from four different positions. The measured diameters were further used to calculate the mean diameter.
Gene Expression Study by Quantitative Real-Time Polymerase Chain Reaction (qRT-PCR)
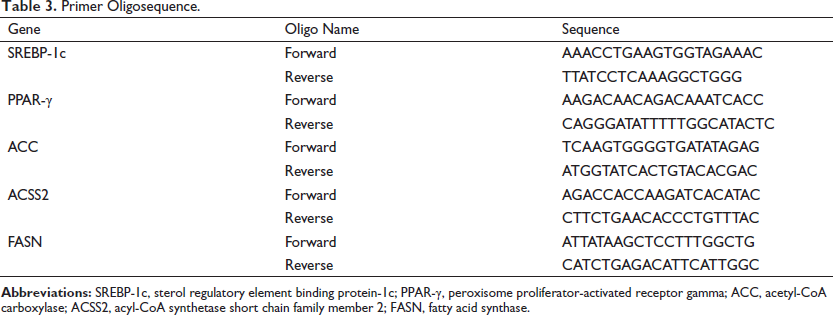
Transcription factors such as sterol regulatory element binding protein-1c (SREBP-1c) and peroxisome proliferator-activated receptor gamma (PPAR-γ) which regulate the expression of fatty acid metabolism genes, such as acetyl-CoA carboxylase (ACC), acyl-CoA synthetase short chain family member 2 (ACSS2), and fatty acid synthase (FASN) were selected for the study. Total RNA was extracted from the snap-frozen liver tissues using the TRIZOL method (Invitrogen, Carlsbad, CA, USA). The quality of RNA was assessed by agarose gel electrophoresis (Bio-Rad, Hercules, CA, USA). The quantification of RNA was done by ND-1000 UV spectrophotometer (Nanodrop Technologies, Wilmington, DE, USA). For qRT-PCR study, cDNA was synthesized from 2 µg of total RNA using the high-capacity reverse transcriptase kit (Invitrogen, USA). The qRT-PCR was performed with TB Green Premix SYBr green expression assays (TAKARA, Japan) in StepOne RT-PCR System (Applied Biosystems, USA). KicqStartۚ Primers were procured from Sigma-Aldrich (New York, USA) as per the sequence given in Table 3.
Primer Oligosequence.
In qRT-PCR study, the initial denaturation step was performed at 95°C for 10 min. This step was followed by 40 cycles of 95°C for 3 s (denaturation), 60°C for 30 s (annealing), and at 95°C for 15 s (extension). The final extension step was performed at 60°C for 0.15 s. The relative amounts of RNA were normalized with the housekeeping control, glyceraldehyde-3-phosphate dehydrogenase (GAPDH).
Monoamines Estimation from the Brain Tissue
As obesity is linked with alterations in neurotransmitter levels leading to obesity-associated neuropsychiatric complications, it was interesting to estimate the brain monoamines (neurotransmitters) (Labban et al., 2020). For the estimation of brain monoamines (dopamine, serotonin, and noradrenaline), the brain tissue was stored in 10% perchloric acid immediately after collection or after initial flash freezing at 2°C–8°C, and further processed using the HPLC method (Lakshmana & Raju, 1997).
Statistical Analysis
The data are presented as mean ± SD. Intra-group comparison was done using repeated measures analysis of variance (ANOVA) or paired t-test as applicable. Inter-group comparison of the parameters recorded on single time point was done using one-way ANOVA followed by post hoc test, while the parameters evaluated on more than two time points were analyzed using two-way ANOVA. The data were analyzed using GraphPad InStat (Version 3.5) and GraphPad Prism (Version 5.01).
Results
Effect of Triphala on the Body Weight
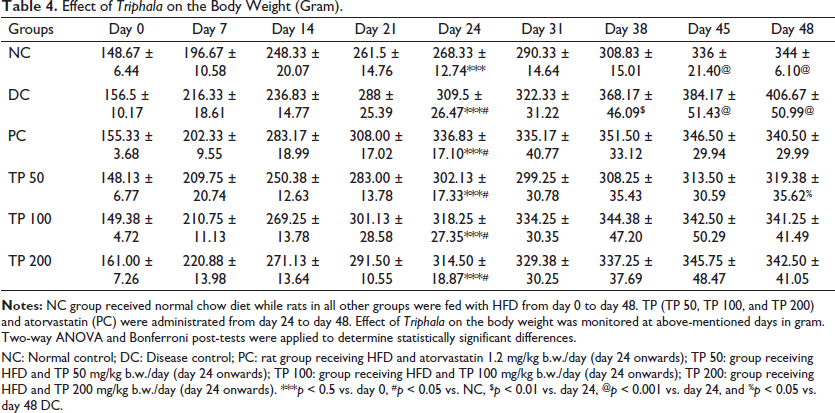
HFD is routinely used to induce obesity in the rats. Table 4 represents the body weight gain due to HFD treatment and effect of TP and standard drug (PC group) on the weight gain. On day 24, all the groups receiving HFD and a normal chow diet had significant weight gain. HFD receiving groups had significantly higher (p < 0.05) weight compared to NC. From day 24 to day 48, TP and standard drugs were administered along with HFD. From Table 4, it is clear that TP and PC groups resisted weight gain where weights for these groups were comparable to the weight of NC. In fact, TP 50 resisted the weight gain maximally. This group also showed a reduction in weight faster (from day 38 onwards) as compared to other treatment groups, where the weight of the rats was significantly lower (p < 0.01) as compared to DC. Other treatment groups showed significantly lower weight only on day 48.
Effect of Triphala on the Body Weight (Gram).
Effect of Triphala on the Blood Glucose and Lipid Profiles
The effect of TP on glucose and lipid profiles after HFD treatment is presented in Table 5. Table 5 represents the effect of TP on the blood glucose. Blood sugar levels for all the groups were comparable at day 0. On day 24, blood sugar in the HFD-fed groups showed a significant rise as compared to NC. On day 48, the difference between NC and DC was significant. However, there was no statistically significant difference between NC and other groups indicating normalization of glucose levels after treatment. A significant difference was noted between PC or other treatment groups and DC. There was no significant difference noted among the different doses of TP. When the intra-group comparison was done, blood glucose levels in PC and TP 200 groups on day 48 reduced significantly as compared to day 24.
Effect of Triphala on Blood Glucose.
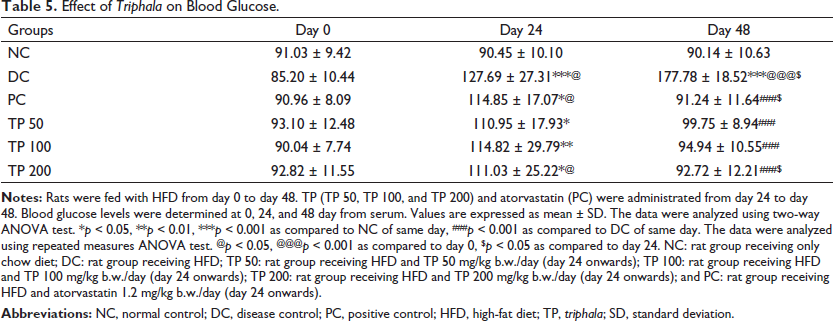
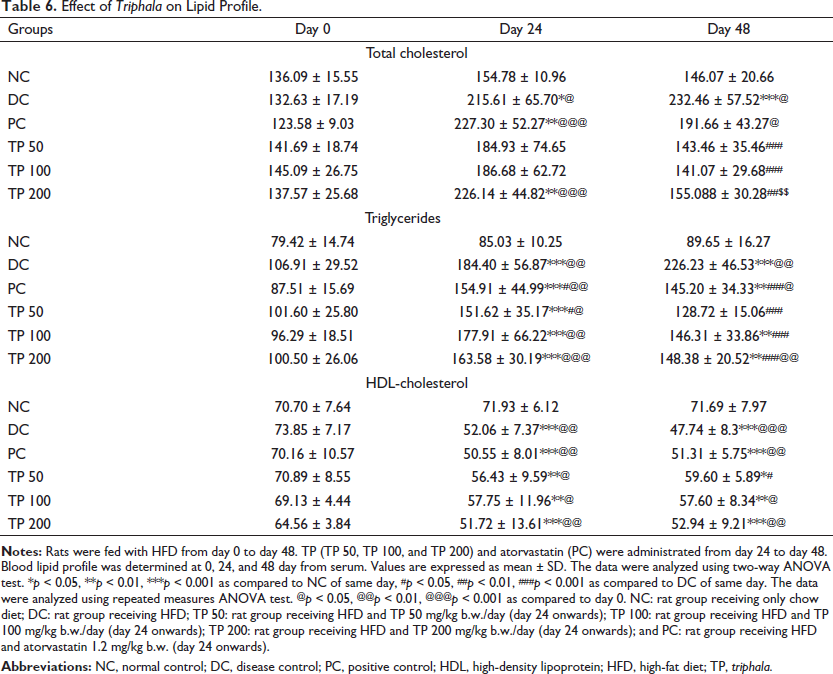
Table 6 represents the effect of TP on the blood lipid profile. Total cholesterol increased on day 24 in all HFD-fed groups. The increase was significant only in the DC, PC, and TP 200 groups as compared to NC. On day 48, no significant decrease was noted between NC and PC and TP 200. The DC group continued to be significantly different from NC. Like cholesterol, serum triglycerides were also found to be significantly increased in all the groups fed with HFD. On day 48, though all treatment groups (except DC) showed a reduction, only in TP 50 groups, the levels were normalized as evident from no significant difference with NC. HDL-cholesterol significantly decreased on day 24 in all HFD-fed groups. PC and TP treatment did not increase these levels except in TP 50, where the levels significantly increased as compared to DC. No significant difference was noted among the different doses of TP. In case of intra-group comparison, only TP 200 showed significant reduction in total cholesterol on day 48 as compared to day 24.
Effect of Triphala on Lipid Profile.
Effect of Triphala on the Adipokines Secretion
The effect of TP on adipokines secretion is represented in Table 7. HFD administration increased leptin levels, while it decreased adiponectin levels on day 24. After treatment with PC and different doses of TP, a decrease in leptin levels was observed on day 48. At this time point, leptin levels in the treatment groups were significantly lower than HFD group. There was no significant difference between NC and treatment groups indicating normalization of leptin levels after the treatment. In the case of adiponectin, all the treatment groups showed a significant increase as compared to DC.
Effect of Triphala on Leptin and Adiponectin Levels.
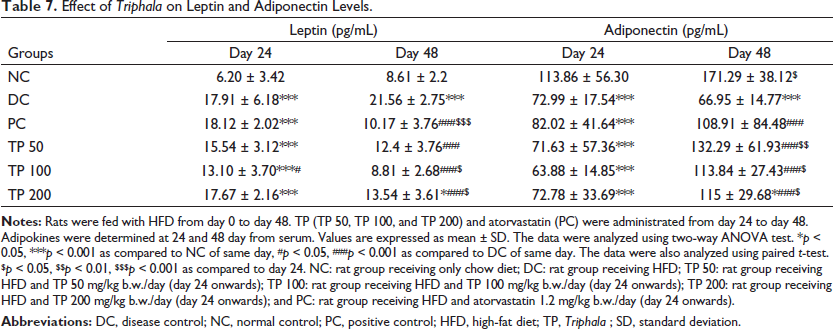
When the intra-group comparison was done, all treatment groups showed significant decrease in the levels of leptin, except TP 50. On the other hand, all treatment groups improved the adiponectin levels. However, PC group could not demonstrate a statistically significant elevation in adiponectin level.
Effect of Triphala on Inflammation
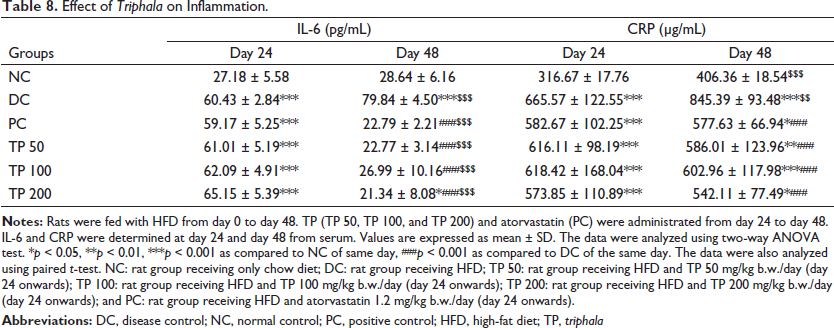
The effect of TP on inflammatory markers was determined from the serum, and the data are presented in Table 8. IL-6, an inflammatory cytokine, showed a similar trend to that of Leptin. Further, the levels on day 48 were significantly less as compared to day 24 of the same group. CRP was also found to be significantly increased with the administration of HFD. All the treatment groups prevented this increase further. Though there was a significant decrease on day 48 as compared to the DC group, no difference was observed as compared to day 24 of the same group.
Effect of Triphala on Inflammation.
Effect of Triphala on Histology of Liver and Adipose Tissue
Histological evaluation was performed on the formalin-fixed liver and adipose tissue, and the data are presented in Figure 1. In the case of liver, DC rats showed more number of lipid droplets and marked fatty changes as compared to NC rats. These fatty changes were less in the TP-treated groups.
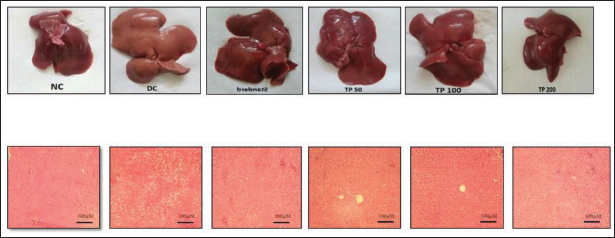
The size of adipocytes was increased in DC rats compared to NC, while a decrease was observed in all TP-treated and PC rats (Table 9).
Effect of Triphala on Adipocyte Diameter.
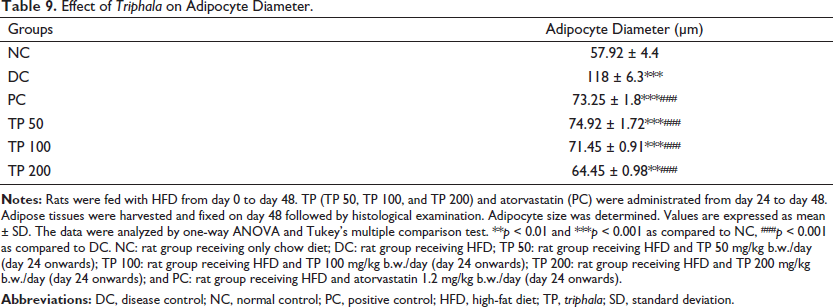
Effect of Triphala on Liver Oxidative Stress
Liver oxidative stress was evaluated by estimating MDA content (Figure 2A) and SOD activity (Figure 2B). MDA levels were significantly higher in DC as compared to NC. After TP treatment, these levels were found to be lowered. This reduction was statistically significant in TP 100 and TP 200 groups. PC rats also showed a reduction in MDA levels.
SOD activity was lowered (p ≤ 0.001) in DC as compared to NC. All TP-treated groups showed significant (p ≤ 0.001) elevation in SOD activity as compared to the DC group. PC also demonstrated significant increase in SOD activity.
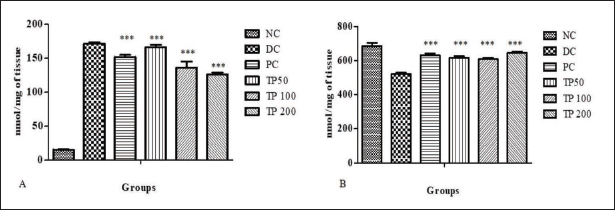
Effect of Triphala on Hepatic Gene Expression
The effect of TP on genes involved in lipid metabolism in the liver was determined by qRT-PCR, and the data are presented in Figure 3. In DC rats, PPAR-γ expression was upregulated by ∼5.26-fold, which was statistically significant (p ≤ 0.001) as compared to NC rats. All the studied doses of TP, such as 50, 100, and 200 mg/kg demonstrated its downregulation by ∼0.35-fold while atorvastatin (PC) downregulated the PPAR-γ expression by ∼0.25-fold (Figure 3A).
The expression of SREBP-1c gene was significantly (p ≤ 0.001) increased in DC rats by ∼10.19-fold as compared to NC rats. Only the TP 100-treated group showed decreased expression of SREBP-1c by ∼ 0.52-fold which was statistically significant (p ≤ 0.01). PC-treated rats also showed downregulation by ∼0.46-fold (Figure 3B).
DC group displayed upregulation of ACC gene by ∼2.62-fold as compared to NC group (Figure 3C). PC group showed downregulation of ACC gene by 0.86 fold. No such effect was observed in any of the TP-treated groups.
Expression of ACSS2 gene was elevated in DC rats by ∼1.7-fold compared to NC rats. A statistically nonsignificant downregulation of the gene expression was observed in PC, TP 100, and TP 200 groups (Figure 3D).
As compared to NC, DC showed increase in FASN gene expression by ∼1.83-fold (Figure 3E). Both PC and TP 100 significantly (p ≤ 0.01) decreased FASN by ∼0.55- and ∼0.65-fold, respectively.
Effect of Triphala on Brain Monoamines
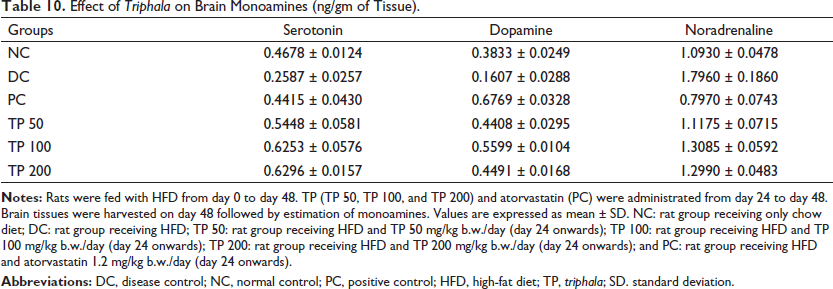
Monoamine levels were measured in the brain tissue after TP treatment. The monoamine levels of Control and treatment groups are presented in Table 10. DC rats showed lower levels of serotonin and dopamine while higher levels of noradrenaline as compared to NC rats. All groups treated with TP demonstrated an increase in serotonin and dopamine along with a decrease in noradrenaline. PC rats also exhibited similar trend.
Effect of Triphala on Brain Monoamines (ng/gm of Tissue).
Discussion
This study was carried out to investigate the anti-obesity effects of TP at biochemical and molecular levels in rat model of HFD-induced obesity. We observed that TP treatment decreased body weight, serum glucose, total cholesterol, triglycerides, leptin, IL-6, CRP, MDA, and noradrenaline levels along with a reduction in adipocyte diameter. Further, it increased serum HDL-cholesterol, adiponectin, SOD, serotonin, and dopamine levels. The alterations in the above-mentioned parameters were further confirmed by studying effect of TP on gene expression associated with lipogenesis.
We also assessed the effect of TP on adipokines such as leptin and adiponectin. Leptin controls the food intake and energy expenditure (Chrysafi et al., 2020; Klok et al., 2007), which in turn is associated with body fat mass (Klein et al., 1996). It is also a pro-inflammatory adipokine. TP treatment decreased the elevated levels of leptin. This decrease has further contributed to the reduction in weight. Adiponectin, another adipokine, plays an important role in the regulation of carbohydrate and fat metabolism (Díez & Iglesias, 2003). Lowered adiponectin levels are associated with an increase in insulin resistance and diabetes (Díez & Iglesias, 2003; Ozenoglu et al., 2008). The treatment with TP has increased adiponectin levels indicating improved insulin sensitivity, which is also reflected in the reduction of glucose levels. TP, thus corrected the adipose (tissue) dysfunction observed in obesity. The key feature of adipose dysfunction is hypertrophy of adipocytes (inflammatory phenotypes) that brings out abnormal secretion of adipokines. Interestingly, in TP-treated groups, adipocyte size was found to be decreased along with the correction of adipokine levels.
Adipose tissue secretes inflammatory mediator IL-6, which plays a key role in triglyceride release, lipoprotein lipase inhibition, and insulin sensitivity in obesity (Gani et al., 2009; Kojta et al., 2020). The increase in inflammation and insulin resistance leads to the increase in the secretion of CRP, an acute-phase protein, in the liver (Tanaka et al., 2011). The CRP levels are positively associated with adipose tissue mass (Faber et al., 2010). Maithili-Karpagaselvi et al. (2016) have reported that the HFD-fed rats showed increased body weight with concomitant increase in liver and adipose tissue weight. The increased weight of the organs basically due to excess fat accumulation caused infiltration of macrophages, which in turn resulted in the increased levels of TNF-α, CRP, monocyte chemoattractant protein-1 (MCP-1), leptin, and IL-6 and there by promoted low-grade inflammation (Maithili-Karpagaselvi et al., 2016). TP effectively reduced these inflammatory markers.
Lipid accumulation in the liver is a characteristic feature in the development of nonalcoholic fatty liver disease concomitantly associated with obesity (Pettinelli & Videla, 2011). This is also associated with upregulation of lipogenic genes such as SREBP-1c and PPAR-γ (Devarshi et al., 2013; Mandave et al., 2017). SREBP is a transcription factor that plays crucial role in lipid metabolism (Horton et al., 2002; Khadke et al., 2020). SREBP-1c expression is relatively higher in the liver and its over-expression is associated with an increase in the triglycerides level (Shiman et al., 1997). It is also involved in the regulation of different lipogenic genes such as ACC, ACSS2, and FASN which are found to be upregulated in obesity (Luong et al., 2000; Shimomura et al., 1999). In this study, fatty changes were observed in the liver after administration of HFD along with upregulation of SREBP and PPAR-γ. The expression of ACC, FASN, and ACSS2 was also found upregulated after HFD administration. These changes resulted in increased serum cholesterol and triglyceride levels in HFD-fed rats. All TP-treated groups downregulated the expression of lipogenic genes leading to an improvement in the lipid profile and also a reduction in the fatty infiltration in liver. In obesity along with lipid abnormalities, oxidative stress is routinely detected (Hasty et al., 2007). The reactive oxygen species react with polyunsaturated fatty acids and lead to increased lipid peroxidation through increased MDA levels. These fatty acids are important structural and functional components of the cells (Memişoğullari & Bakan, 2004). Ansari et al. (2012) studied the effect of pitavastatin and rosuvastatin on the obesity-induced oxidative stress. The possible mechanisms behind development of oxidative stress in obesity includes an increase in the blood glucose, lipid abnormalities, impaired antioxidant defenses, and hyperleptinemia (Vincent et al., 2007). We observed significant increase in MDA levels of the liver after HFD administration, which was normalized by TP treatment. TP improved the antioxidant mechanism as evidenced by improvement in the SOD activity.
Neurotransmitters play an important role in the obesity pathology. Serotonin controls feeding behavior through the stimulus to eat. Leptin-mediated regulation of appetite and energy expenditure takes place by inhibiting serotonin synthesis and release in the brainstem neurons (Oury & Karsenty, 2011). Dopamine plays a key role in hyperphagia. Noradrenaline is also involved in the stimulation of hunger and satiety as well as thermogenesis (Johnston, 1987). Brain imaging studies on rats and humans implicate the involvement of dopamine in eating behaviors, therefore new strategies are in line for targeting improvement in the dopamine function for the prevention and treatment of obesity (Bello & Hajnal, 2010). We observed decreased levels of serotonin and dopamine in HFD-fed rats, while the levels of noradrenaline were found elevated. TP reversed these changes. The improved levels of neurotransmitters must have resulted in normalization of hunger and thereby reduction in weight.
Conclusion
This study thus provides convincing evidence about anti-obesity effect of TP at biochemical and molecular levels. Since we did not observe any dose-dependent effects of TP, further studies with wider dose range are warranted. However, the findings of our study can be used for possible future applications of TP as an anti-obesity medicine.
Footnotes
Abbreviations
ACC: Acetyl-CoA carboxylase; ACSS2: Acyl-CoA synthetase short chain family member 2; CRP: C-reactive protein; DC: Disease control; FASN: Fatty acid synthase; HFD: High-fat diet; IL-6: Interleukin-6; MDA: Malondialdehyde; NC: Normal control; PC: Positive control; PPAR-γ: Peroxisome proliferator-activated receptor gamma; qRT-PCR: Quantitative real-time polymerase chain reaction; SOD: Superoxide dismutase; SREBP-1c: Sterol regulatory element binding protein-1c; TP 100: HFD + Triphala 100 mg/kg b.w./day; TP 200: HFD + Triphala 200 mg/kg b.w./day; TP 50: HFD + Triphala 50 mg/kg b.w./day; TP: Triphala.; TBARS: Thiobarbituric acid reactive substances; HPLC: High performance liquid chromatography; ANOVA: Analysis of variance; LR: Laboratory reagent; MCP-1: Monocyte chemoattractant protein-1.
Acknowledgments
The authors are thankful to M/s Pharmanza Herbal Ltd. for providing the aqueous extract of Triphala. We also thank Dr. Megha Salunke and Jyotibala Banjare for their help in data collection.
Author’s Contribution Statements
SB: Concept, design, definition of intellectual content, statistical analysis, manuscript editing and review.
AJ: Data interpretation, manuscript drafting and review.
SK: Gene expression studies and analysis.
AS: Study design and monitoring, tissue-based experiments, manuscript review.
Declaration of Conflicting Interests
The authors declared no potential conflicts of interest with respect to the research, authorship, and/or publication of this article.
Funding
The authors acknowledge Central Council for Research in Ayurvedic Sciences (CCRAS), Ministry of Ayush, Government of India for the financial support.