
Abstract
Background
Throughout the world, diabetic nephropathy has been treated by managing hyperglycemia and hypertension with antidiabetic and antihypertensive drugs, but the potency of reversing the diabetic nephropathy-induced complications is still questionable.
Materials and Methods
This study was focused on elucidating the nephroprotective effect of purpurin, a natural anthraquinone, against diabetic nephropathy induced in an in vivo model. Diabetic nephropathy was induced in rats by injecting streptozotocin (STZ) and then treating them with purpurin. The rats were analyzed for food intake, body weight gain, fasting blood glucose (FBG), glycated hemoglobin (HbA1c), serum insulin, and homeostasis model assessment of insulin resistance (HOMA-IR) to analyze the anti-glycemic effect of purpurin on diabetic nephropathy-induced rats. The lipid profile, blood urea nitrogen (BUN), serum creatinine, and lactate dehydrogenase (LDH), and kidney injury molecule-1 (KIM-1) levels were assessed. Proinflammatory cytokines, such as tumor necrosis factor α (TNF-α), interleukin 1β (IL-1β), and interleukin 6 (IL-6), were quantified to determine the anti-inflammatory effect of purpurin on diabetic nephropathy-induced rats. Finally, histopathological analysis of kidney tissue was performed.
Results
Purpurin effectively decreased the body weight, FBG, HbA1c, HOMA-IR values, and increased insulin levels. It significantly decreased lipid profiles while increasing high-density lipoprotein (HDL) in diabetic nephropathy-induced rats. It also decreased the BUN, creatinine, LDH, and KIM-1 levels. The reduction in proinflammatory cytokine levels was observed in the purpurin-treated diabetic nephropathy rats. Finally, the histopathological analysis confirms the nephroprotective effect of purpurin.
Conclusion
Taken together, our results conclude that purpurin possesses therapeutic potency to ameliorate diabetic-induced nephropathy, and it can be a promising drug for diabetic nephropathy in the future.
Introduction
Chronic kidney disease is one of the most threatening worldwide health issues, affecting more than 17 million global population.1, 2 The annual rate of chronic kidney diseases incidence increases by 8%, and it is more prevalent in developing countries than in developed countries.3, 4 Global Burden of Disease study has reported that chronic kidney disease-related mortality has increased drastically, and it has been ranked as the 12th leading cause of mortality and one of the 10 causes that lead to poor life quality.5, 6 Comparatively, patients with chronic kidney disease have a more miserable life than depression or diabetic or osteoarthritis patients. 7 The most prevalent causes of chronic kidney disease are diabetes and hypertension.
Diabetic nephropathy, a microvascular complication, was reported in both type 1 and type 2 diabetic patients. 8 Diabetic-induced nephropathy triggers kidney-related diseases and increases the incidence of cardiovascular and arterial complications. 9 Most of the mortalities reported in diabetic patients are associated with chronic kidney disease.10, 11 Diabetic nephropathy is characterized by progressive loss of renal function, increased proteinuria, interstitial fibrosis, and disruption of glomeruli. 12 Although the disruption in metabolism, hemodynamics of the kidney, excess activation of renin-angiotensin, and inflammation are the identified pathogenesis of diabetic nephropathy, 13 the exact mechanism has yet to be elucidated.
Patients with prolonged hyperglycemia 14 and hypertension 15 are more susceptible to the initiation and progression of diabetic nephropathy. Lifestyle factors such as increased protein and fat intake, smoking, lack of exercise, and obesity are also assumed to be risk factors for diabetic nephropathy.16, 17 Glomerular hyperfiltration and dyslipidemia are reported to trigger the progression of nephropathy. Genetic factors also play a major role in the initiation and progression of nephropathy in diabetic patients. 18 Activation and recruitment of immune cells are the hallmark events involved in diabetic nephropathy pathogenesis. Inflammatory cytokines, growth factors, chemokines, adhesion molecules, and immune cells play a vital role in diabetic mellitus and its associated complications.19, 20 Proinflammatory cytokines such as tumor necrosis factor α (TNF-α), interleukin 1 (IL-1), and interleukin 6 (IL-6) were reported to be increased in experimental diabetic nephropathy in vivo models. Immune monocytes and macrophages, as well as mesangial, endothelial, dendritic, and renal tubal cells, produced TNF-α.21, 22 Interleukins were produced by the adipocytes, leukocytes, mesangial cells, and endothelial cells. The overexpression of IL-6 and IL-1 have been reported in experimental diabetic nephropathy, which is supported by increased albumin excretion and renal hypertrophy. 23
At present, managing hyperglycemia and hypertension are the vital therapies prescribed to diabetic nephropathy patients. Antihypertensives, such as ACE inhibitors and angiotensin receptors, are considered to be the gold-standard treatment for diabetic nephropathy patients.24, 25 These therapies are effective in patients with slow progression, but they render only limited recovery in diabetic nephropathy patients. 26 These drugs are also not potent in reversing the established complications; hence, it is necessary to develop a much more potent drug to treat diabetic nephropathy.
Purpurin is a naturally occurring anthraquinone found in the roots of Rubia cordifolia, a perennial plant distributed worldwide. Purpurin is a polyketide derivative of the anthracenedione ring. 27 It possesses various medicinal properties, such as neuromodulatory, antioxidant, anti-inflammatory, photodynamic, and antigenotoxic. 28 In this study, we assessed the protective role of purpurin against diabetic-induced nephropathy in the streptozotocin (STZ)-induced diabetic experimental model.
A recent study revealed that purpurin effectively ameliorated hepatotoxicity, 29 suppressed atopic dermatitis, 30 protected hepatorenal injury, 31 and demonstrated neuroprotective effects 32 in various study models.
Materials and Methods
Experimental Animals
Adult healthy male Wistar rats weighing about 220 ± 50 g were housed in standard laboratory conditions with 22 ± 3°C and 45± 5% humidity and a 12 h light/dark cycle. All the animals were given free access to a laboratory rat pellet diet and hygienic water. The rats were acclimatized for 10 days before the initiation of the experiment.
Experimental Protocol
Once the acclimatization period was completed, the rats were grouped into four groups with six rats. Group I: Control rats were treated with only saline. Group II: Diabetic nephropathy-induced rats were intraperitoneally injected once with 45 mg/kg STZ dissolved in 10-mM sodium citrate buffer. Group III: Low-dose purpurin-treated rats are the STZ diabetic-induced rats, which were confirmed as diabetic in animals and then orally treated with 50 mg/kg purpurin for 8 weeks. Group IV: Standard control rats (the diabetic rats) were treated with the standard diabetic drug metformin for 8 weeks. The diabetic rats were induced as per the protocol for Group II rats. The diabetic induction in rats was confirmed by the blood glucose levels greater than 16 mmol/L. After the treatment period, the rats were anesthetized using pentobarbital sodium, a blood sample was drawn with a cardiac puncture, and the kidney tissue was collected for further analysis.
Assessment of Food Intake and Body Weight Gain
Every day at 10.00 am, the rats were fed 200 g of the standard laboratory rat pellet diet and allowed free access to the diet. On the next day, by 10.00 am, the remaining food was collected and weighed. The remaining pellet weight was noted daily, and the body weight was measured twice weekly for the entire treatment period and recorded.
Estimation of Fasting Blood Glucose
The rats were subjected to overnight fasting before the fasting blood glucose (FBG) was assessed. Orbital sinus blood was carefully collected, and the samples were subjected to glucose estimation using the glucose estimation kit purchased from Randox Laboratories Ltd, UK.
Quantification of Glycated Hemoglobin
The levels of glycated hemoglobin (HbA1c) in experimental animals were quantified using the commercially available ELISA kit (Abbexa, UK). The serum samples were subjected to experiments as per the guidelines of the manufacturer. The final product was measured at 450 nm using a microplate ELISA reader, and the yellow color intensity was directly proportional to the HbA1c concentration in the sample.
Quantification of Insulin Levels
The insulin levels in the experimental animals were quantified using a commercially available ELISA kit (Sigma Aldrich, USA). All the reagents and the samples were cooled down to room temperature before the initiation of the experiment. The standards and the samples were run in triplicates as per the procedure provided. The final absorbance of the standard and sample was measured at 450 nm immediately after the addition of the stop solution using a microplate ELISA reader.
Insulin Resistance Detection
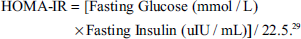
The plasma insulin resistance in the experimental animals was detected using the homeostasis model assessment of insulin resistance (HOMA-IR). HOMA-IR was calculated with fasting glucose and insulin levels using the following formula:
Assessment of Total Lipid Profile
The total lipid profile was assessed in experimental animals, and the levels of total, high-density lipoprotein (HDL), low-density lipoprotein (LDL), very low-density lipoprotein (VLDL) cholesterol, triglycerides (TG), and free fatty acids (FFA) were quantified in the serum samples using a colorimetric assay kit (Sigma Aldrich, USA). The experiments were performed in triplicates as per the procedure provided by the manufacturer.
Assessment of Renal Dysfunction Marker Levels
The kidney profile in the experimental animals was assessed by measuring the levels of blood urea nitrogen (BUN), serum creatinine, and lactate dehydrogenase (LDH). BUN levels were measured spectroscopically using the urease method with a colorimetric assay kit (Elabscience, USA). The ammonia content measured at 580 nm is directly proportional to the urea content. Serum creatinine levels were measured using a colorimetric assay kit (Elabscience, USA), and the final absorbance was measured at 515 nm. The creatinine content was indirectly proportional to the final absorbance detected. The LDH activity was quantified using a colorimetric assay kit procured from Abcam, USA. The LDH reduces NAD to NADH, which in turn interacts with the specific probe to form the color intensity, which was measured at 450 nm.
Quantification of Kidney Injury Molecule-1 Protein
Kidney injury molecule-1 (KIM-1), a marker of nephrotoxicity, was quantified in the experimental animals using the ELISA kit (MyBiosource.com, USA). The kidney tissue homogenate from the experimental animals was prepared and used for the estimation of KIM-1 analysis. The final enzyme-substrate reaction was terminated with a stop solution, and the final yellow color intensity was measured at 450 nm. The OD value was directly proportional to the level of KIM-1 protein in the experimental samples.
Quantification of Proinflammatory Cytokines
Proinflammatory cytokines, which are the markers of inflammation, were quantified using an ELISA kit (Abcam, USA). TNF-α, interleukin 1β (IL-1β), and IL-6 were measured using the Sandwich ELISA method; the plasma samples were added to the precoated ELISA plates, and the test was performed as per the protocol of the manufacturer. Finally, the 3,3′,5,5′-Tetramethylbenzidine (TMB) substrate was added to the wells develops the color intensity, which is directly proportional to the cytokine levels. The reaction was further arrested with a stop solution, and the final yellow color intensity was measured at 450 nm.
Renal Histopathological Analysis
The kidney tissue of the experimental animals was fixed with 10% buffered formalin overnight and then subjected to tissue processing. The processed tissue was embedded in paraffin, and the paraffinized tissue was sectioned into slices of 4-micron thickness. The sliced sections were deparaffinized and fixed onto albumin-coated glass slides. The section was stained with hematoxylin and eosin stains, and the stained sections were viewed and imaged under a light microscope for further histopathological analysis.
Statistical Analysis
To assess the difference between the control and treatment groups, the data of the experiments were statistically analyzed with one-way ANOVA followed by the post hoc test Newman–Keuls test using the SPSS 17.0 version software. All the experiments were repeated three times, and the statistically analyzed data were represented as the mean ± SEM. The difference with p-values < 0.05 was considered significant.
Results
Effect of Purpurin on Food Intake and Body Weight in Diabetic Nephropathy-induced Rats
Figure 1A and B depicts the initial and final food intake of rats after the induction of diabetic nephropathy with STZ. Initially, in the first week of the treatment period, the control rats consumed about 20 ± 0.8 g of food, whereas in the eighth week, the consumption increased to 42±0.6. Diabetic nephropathy-induced, untreated rats drastically increased their food consumption from 40 ± 1.2 g to 78 ± 1.3 g. Purpurin and the standard diabetic drug metformin significantly reduced the food consumption in the eighth week to 69 ± 1.2 g and 46 ± 0.9 g, respectively, compared to the diabetic nephropathy-induced, untreated rats.
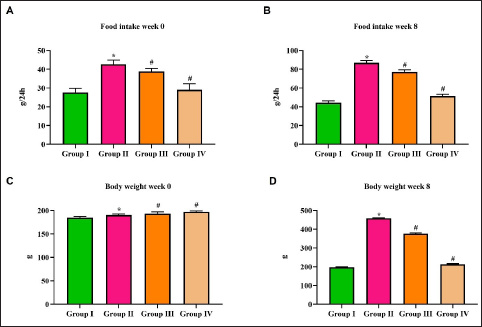
Figure 1C and D represents the initial and final weight gain in rats after the induction of diabetic nephropathy with STZ. The untreated, diabetic nephropathy-induced showed a substantial increase in their body. On the eighth week of treatment, the diabetic nephropathy-induced, untreated rats showed about 330 ± 5 g increase in their body weight, whereas the control and purpurin-treated rats showed only 15 ± 0.8 g and 10 ± 0.7 g of weight gain, respectively. Metformin treatment showed a significant decrease in body weight, with rats losing 60 ± 2 g by the eighth week of treatment.
Effect of Purpurin on the FBG and HbA1c Levels in the Diabetic Nephropathy-induced Rats
Figure 2A and B illustrates the results of fasting blood sugar levels in the control and diabetic nephropathy-induced rats. The diabetic-induced, untreated rats showed an extensive increase in their fast blood glucose 55 ± 0.9 mmol/L compared to the normal control, which was only 8 ± 0.08 mmol/L. Whereas on the eighth week of treatment, the diabetic untreated rat showed a decrease in its fasting blood sugar level of 44 ± 0.7 mmol/L. No significant difference in the fasting blood sugar level was observed in both purpurin and metformin treatments in the eighth week compared to the first week of treatment.
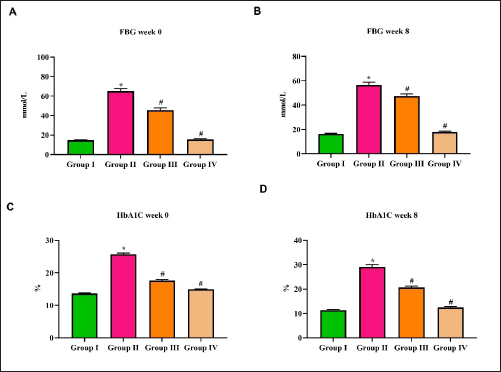
Figure 2C and D represents the levels of HbA1c in the control and diabetic-induced rats. The levels of HbA1c in control rats decreased during the eighth week of the treatment period. Although a significant increase in the HbA1c levels was observed in diabetic nephropathy-induced untreated rats, purpurin-treated rats and metformin-treated rats on the eighth week of treatment.
Effect of Purpurin on the Serum Insulin and HOMA-IR Levels in Diabetic Nephropathy-induced Rats
The serum insulin level on the initial and final week of treatment in diabetic nephropathy-induced rats is depicted in Figure 3B. The control rats exhibited 26 ± 0.8 µU/mL of insulin on the first week of treatment, whereas in the final week, it increased to 32 ± 0.3 µU/mL. Diabetic nephropathy-induced untreated rats showed a significant increase of 28 ± 0.6 µU/mL of insulin in the eighth week, whereas it was only 18 ± 0.2 µU/mL. The metformin treatment also increased the level of serum insulin from 35 ± 0.7 µU/mL in the first week to 46 ± 0.5 µU/mL in the eighth week. A minimal increase in the levels of insulin was observed in purpurin-treated patients, which increased from 31 ± 0.6 µU/mL in the first week to 34 ± 0.8 µU/mL in the eighth week of treatment.
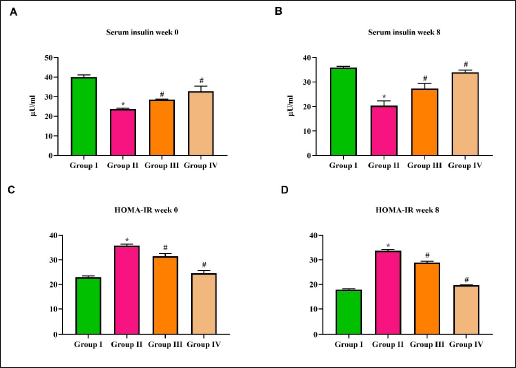
The insulin resistance in control and diabetic nephropathy-induced rats was calculated using the HOMA-IR method, and the values are depicted in Figure 3C and D. No significant change was observed in the HOMA-IR value was observed in the control and diabetic nephropathy-treated rats on the first and eighth week of treatment. It decreased from 28 to 26 in purpurin-treated rats and from 24 to 19 in metformin-treated rats on the eighth week of treatment. The diabetic nephropathy-induced, untreated rats showed an increased value of 30 compared to all the other groups.
Effect of Purpurin on the Lipid Profiles of Diabetic Nephropathy-induced Rats
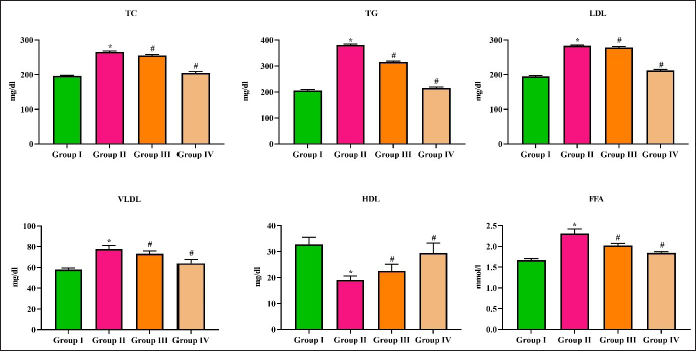
The total lipid profile in control and diabetic nephropathy-induced rats has been assessed using the values depicted in Figure 4. Diabetic nephropathy-induced, untreated rats showed a significant increase in the levels of total cholesterol (TC) (255 ± 7 mg/dl) and TG (320 mg/dl) compared to the control rats (185 ± 5 mg/dl and 180 mg/dl), respectively. Both purpurin and metformin treatments significantly decreased the TC (230 ± 6 and 210 ± 5 mg/dl, respectively) and TG (280 and 270 mg/dl). The LDL and VLDL were significantly increased to 280 ± 1.8 mg/dl and 72 ± 3 mg/dl, respectively, in diabetic nephropathy-induced untreated rats compared to the control rats (170 ± 2.3 mg/dl and 55 ± 4 mg/dl, respectively), whereas the HDL levels were decreased to 22 ± 5 mg/dl in diabetic nephropathy untreated rats. Both purpurin and metformin decreased the levels of LDL and VLDL and increased the levels of HDL significantly compared to the diabetic nephropathy-induced levels in the untreated rats. Purpurin treatment significantly decreased the levels of FFA to 1.9 ± 0.04 mmol/L compared to the untreated diabetic nephropathy-induced rats, which showed 2.2 ± 0.02 mmol/L of FFA.
Effect of Purpurin on the BUN, LDH, and Creatinine Levels in the Diabetic Nephropathy-induced Rats
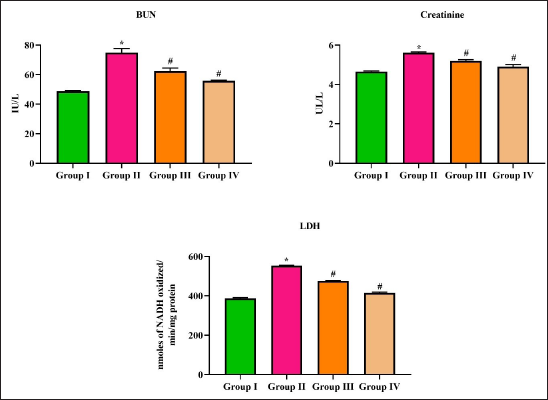
Kidney biomarkers BUN, creatinine, and LDH were quantified in the control and diabetic nephropathy-induced rats, and the results are depicted in Figure 5. BUN levels were significantly increased to 65 ± 2 IU/L in diabetic nephropathy induced in untreated rats compared to the control rats, which showed 52 ± 4 IU/L. No significant difference in BUN levels was observed between control and purpurin-treated rats. Metformin significantly decreased the BUN levels to 42 ± 3 IU/L compared to the control rats. Creatinine levels were significantly increased to 5.7 ± 0.07 U/L in diabetic nephropathy-induced rats compared to control (4.5 ± 0.03 U/L), purpurin-treated (4.9 ± 0.04 U/L), and metformin-treated (4.2 ± 0.03 U/L) rats. Both the purpurin and metformin treatments significantly decreased the levels of LDH to 470 ± 2 U/mg protein and 360 ± 4 U/mg protein, respectively, compared to the diabetic nephropathy-induced untreated (585 ± 3 U/mg protein) rats.
Effect of Purpurin on KIM-1 Level in the Diabetic Nephropathy-induced Rats
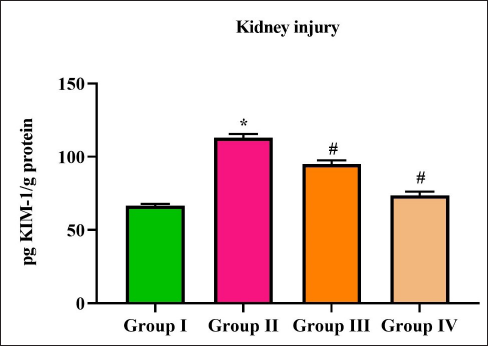
Figure 6 illustrates the results of KIM-1 protein levels in the control and diabetic nephropathy-induced rats. Diabetic induction significantly increased the levels of KIM-1 protein to 93 ± 0.8 pg KIM-1/g compared to the control 49 ± 0.6 pg KIM-1/g. Purpurin and metformin treatment significantly decreased the levels of KIM-1 protein to 78 ± 0.4 and 55 ± 0.6 pg KIM-1/g protein, respectively, in the diabetic nephropathy-induced rats.
Effect of Purpurin on Inflammatory Markers Level in Diabetic Nephropathy-induced Rats
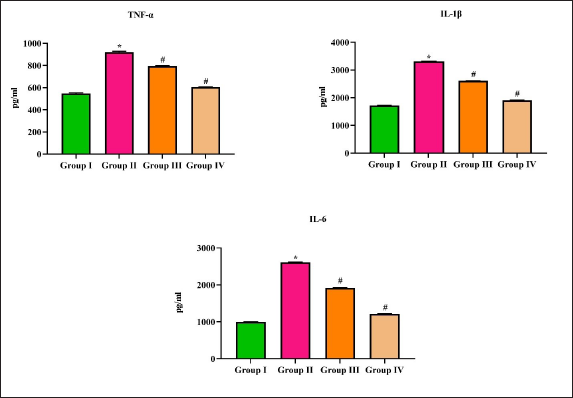
The levels of proinflammatory cytokines TNF-α, IL-1β, and IL-6 were quantified in the control and diabetic nephropathy-induced rats and the results were depicted in Figure 7. Diabetic-induced untreated rats showed a significant increase in the levels of all three TNF-α (985 pg/mL), IL-1β (3050 pg/mL), and IL-6 (2750 pg/mL) cytokines compared to the control rats (520, 1670, and 1020 pg/mL, respectively). The treatment with purpurin significantly decreased the levels of TNF-α (720 pg/mL), IL-1β (2900 pg/mL), and IL-6 (1450 pg/mL) compared to diabetic nephropathy-induced untreated rats.
Effect of Purpurin on the Histopathological Analysis of Renal Tissues in Diabetic Nephropathy-induced Rats
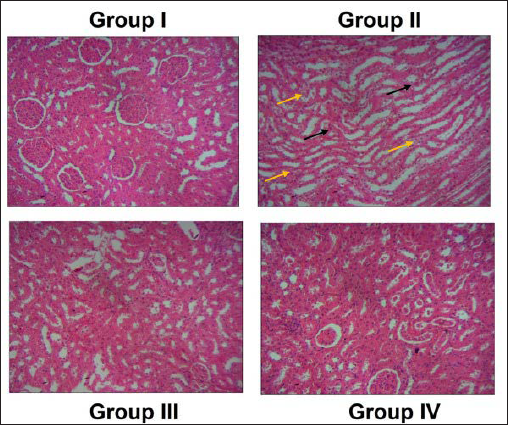
The representative images of H&E-stained section of control (A), diabetic nephropathy-induced untreated (B), purpurin-treated (C), and metformin-treated rats (D) are depicted in Figure 8. The control normal renal histoarchitecture with uniform glomerular thickness and mesangial matrix, whereas the diabetic nephropathy-induced untreated rats showed increased glomerular basement membrane thickness with the expanded mesangial matrix. Compared to the diabetic nephropathy-induced untreated rats, the purpurin-treated and the metformin-treated rats decreased the glomerular basement thickness, and the mesangial matrix was decreased.
Discussion
A predominant microvascular complication reported in diabetic patients is diabetic nephropathy, which further leads to renal failure and end-stage renal disease. 30 Diabetes tends to be the leading cause of renal failure-induced mortality and morbidity in developing countries. Both type 1 and type 2 diabetes play a crucial role in renal failure, whereas it is more prevalent in type 2 diabetes patients.20, 31 Antiglycemic and antihypertensive drugs, such as ACE inhibitors, Angiotensin II receptor blockers, were not so potent and still, and the incidence of diabetic nephropathy remains increasing. Most of the discovered drugs failed during the clinical Phase III trials,32, 33 hence it is necessary to discover a potent drug to ameliorate diabetic nephropathy.
Obesity is closely linked with various diseases, such as diabetes, hypertension, cardiovascular diseases, atherosclerosis, and chronic kidney disease.34, 35 Globally, the incidence rate of chronic renal disease is prevalent in obese diabetic patients. 36 Obesity alone is considered an independent risk factor for the initiation and progression of nephropathy. 37 A high body mass index was reported to be prevalent in patients with diabetic nephropathy. 38 Hence, in this study, we analyzed the role of purpurin on weight gain in rats with diabetes induced by STZ. Initially, between the diabetic-induced untreated and purpurin-treated rats, there was no significant difference in food intake or body weight gain; whereas, in the final week of treatment, the diabetic-induced untreated rats had increased food intake and significantly gained weight than the purpurin-treated rats, indicating that purpurin had significantly prevented weight gain in diabetic-induced rats (Figure 1).
Hyperglycemia causes renal cell growth impairment via the production of growth factors, which in turn disrupts the extracellular matrix. 39 Increased intracellular glucose levels activate the diacylglycerol-protein kinase pathway, hexokinase, and cause oxidative stress, resulting in diabetic kidney disease. 40 The changes in the metabolic and hemodynamic function due to hyperglycemia cause renal failure. Hyperglycemia causes increased binding of glucose molecules to the amino acids, thereby increasing the production of advanced glycosylated end products. These advanced glycosylated end products bind to the collagen protein, thereby leading to renal failure.41, 42 In our study, purpurin treatment significantly reduced the FBG, increased the serum insulin, and decreased the HbA1c, thereby maintaining the glycemic levels in diabetic-induced rats (Figure 2). It also decreased the levels of HOMA-IR, which confirms that purpurin had prevented the diabetic rats from developing insulin resistance, a severe complication that must be treated in diabetic patients.
Dyslipidemia is the most often underdiagnosed condition in patients with chronic kidney disease. The altered lipoprotein metabolism causes dyslipidemia, which leads to the accumulation of atherogenic particles.43, 44 The levels of TC, TG, oxidized LDLs, and elevated levels of apolipoprotein ß-containing lipoproteins were reported in chronic kidney disease patients. 45 Impaired HDL and impaired HDL metabolism were also observed during chronic kidney disease.46, 47 Purpurin treatment significantly decreased the levels of TC, TG, FFA, and LDL and increased the levels of HDL in diabetic-induced rats (Figure 4), indicating the hypercholesteremic effect of purpurin against diabetes-induced rats.
KIM-1 is a transmembrane protein present in the epithelial cells. These KIM-1 proteins are biomarkers for renal proximal tubular damage, ischemic kidney diseases, and proteinuria conditions.48, 49 It is considered to be a more potent biomarker than serum creatinine levels during renal injury. 50 During post-ischemic kidney conditions, the KIM-1 protein recognizes the dead cells and initiates phagocytosis. The elevated KIM-1 protein leads to renal tubular cell damage. 51 Therefore, in our study, we analyzed the levels of KIM-1 protein in diabetic-induced rats. Purpurin significantly decreased the levels of KIM-1 as well as the BUN, serum creatinine, and LDH levels in the diabetes-induced rats, confirming the nephroprotective role of purpurin against STZ-induced diabetes.
Excessive accumulation of lipids causes adipocyte stress due to hypertrophy and hyperplasia; this condition in turn leads to hypoxia in cells, causing inflammation. The increased infiltration of macrophages and pro-inflammatory cytokine release aggravates insulin resistance in diabetic conditions.52, 53 The proinflammatory cytokines TNF-α, IL-6, and IL-1 further stimulate the synthesis of other cytokines and activate NF-κB. The activated NF-κB maintains a hyperglycemic condition that affects glucose uptake and enhances insulin resistance during diabetic conditions. 54 Therefore, attenuating inflammatory cytokines play a crucial role in diabetes and its related complications. Purpurin treatment significantly decreased the levels of TNF-α, IL-6, and IL-1 in diabetic-induced rats this may be the reason for reduced HOMA-IR levels and insulin resistance in diabetic-induced rats. Furthermore, our histopathological analysis of renal tissue in diabetic-induced rats confirms that purpurin significantly reduced hypertrophy of glomerular and tubular cells, thereby preventing glomerular lesions in STZ-induced diabetic rats.
Conclusion
Our findings revealed that purpurin effectively decreased the blood glucose and cholesterol levels, prevented insulin resistance, and decreased the levels of kidney injury markers BUN, creatinine, LDH, and KIM-1 levels in the diabetic nephropathy-induced rats. It also attenuated pro-inflammatory cytokines and prevented the renal tissue damage induced by STZ. Therefore, it was clear that purpurin can ameliorate diabetic nephropathy in rats. However, additional studies are still needed in the future to understand the exact therapeutic potential of purpurin in diabetic nephropathy.
Summary
Diabetic nephropathy, a microvascular complication, is reported in most of the diabetic patients and causes increased mortality if untreated on time.
Purpurin effectively decreased blood glucose and cholesterol levels, preventing insulin resistance and decreased the levels of kidney injury markers BUN, creatinine, LDH, and KIM-1 protein.
Histopathological analysis of renal tissue in diabetic-induced rats confirms that purpurin significantly reduced hypertrophy of glomerular and tubular cells, thereby preventing glomerular lesions in STZ-induced diabetic rats.
Footnotes
Abbreviations
Ethical Approval
This work has been approved with the ethical approval No: (No. SXBH-2022-P2-026).
Declaration of Conflicting Interests
The authors declared no potential conflicts of interest with respect to the research, authorship, and/or publication of this article.
Funding
This study was supported by the Shanxi Academy of Medical Sciences, Tongji Shanxi Hospital, Third Hospital of Shanxi Medical University, Taiyuan, 030032, China.