
Abstract
Background
Leaves, flowers and young shoots of yellow Camellia species are often used as a substitute for green tea in Vietnam. Yellow Camellia species contain high levels of polyphenol compounds, and have shown activities such as antioxidant, anticancer, and cytotoxic.
Objectives
We qualitatively screened phytochemicals, quantified total polyphenols of 70% ethanol (EtOH) extracts of leaves, young shoots, and flowers of Camellia vuquangensis and Camellia hatinhensis in Ha Tinh Province, Vietnam. Furthermore, these extracts have been evaluated for lipid peroxidation inhibitory activities at the in vivo level in the BALB/c mouse model, and in vitro cytotoxic activities.
Materials and Methods
Chemical methods and thin-layer chromatographic (TLC) analysis were used for the qualitative screening of phytochemicals. High-performance liquid chromatography (HPLC) was used to determine total polyphenols. Cell survival was determined through optical density (OD) measured when the protein composition of the cells was stained with sulforhodamine B (SRB). Inhibition of lipid peroxidation was evaluated by determining the content of malondialdehyde (MDA), which is a product of membrane lipid peroxidation.
Results
The total polyphenol contents of all parts of the two species were comparable to that of green tea with values between 319.3 and 342.6 mg gallic acid equivalents (GAE/g) dry weight. Extracts of leaves, flowers of C. vuquangensis and C. hatinhensis showed strong lipid peroxidation inhibitory activities (IC50: 7.92–17.45 µg/mL) and moderate cytotoxic activities against cell lines HepG2, A549, MCF7, SK-Mel-2, HT-29, and AGS (IC50: 34.73–80.58 µg/mL).
Conclusion
These two tea species may be considered as herbal teas with various health benefits.
Keywords
Introduction
Lipid peroxidation is the cause of membrane damage including assembly, composition, structure, and dynamics of lipid membranes. 1 The degradation of products that are produced during peroxidation can indirectly damage other components of the cell. 2 Brain oxygen consumption during adenosine triphosphate (ATP) synthesis produces a high quantity of reactive oxygen species (ROS) as a byproduct, and biological cell membranes contain polyunsaturated fatty acids (PUFAs), which are easily peroxidized. 3 Previous studies confirmed lipid peroxidation as the cause of diseases of the brain and the central nervous system. 1 In addition, peroxidation is involved in the pathogenesis of other human diseases such as ischemia-reperfusion injury, various types of cancers, Alzheimer’s disease, rheumatoid arthritis, renal dysfunction, ocular degeneration, and diabetes mellitus. 2
Cancer is a global disease, the latest WHO report recorded 18.1 million new cases of cancer and 9.6 million deaths worldwide. 4 Breast cancer is the leading cause of cancer death for women. 5 In 2020, there were 685,000 deaths globally out of a total of 2.3 million women diagnosed with breast cancer. 6 The incidence of breast cancer in men accounts for 0.5%–1% of all cases. 6 Liver cancer is the most common cancer globally, accounting for 9.1% of all cancer deaths, with over 80% of diagnosed cases in underdeveloped countries. 7 Globally, lung cancer is the most common cancer with 1.2 million new cases annually, responsible for 17.8% of all cancer deaths. 8 Every year there are about 1.2 million new cases of colon cancer and about 600,000 deaths. 9 In 2018 Gastric cancer was the cause of 784,000 deaths, and it is estimated that there are about 1 million new cases every year. 10 About 2–3 million new cases are diagnosed with non-melanoma skin cancers, of which at least 132,000 malignant melanomas are diagnosed globally each year. 11
Camellia Linnaeus (1753) has between 120 and 280 species, distributed mainly in Asia; Vietnam and China are the two countries that are recording the largest number of species. 12 Most of the studies on chemical composition and biological activities have focused on three species with high economic value, namely Camellia sinensis (L.) Kuntze, Camellia japonica L., and Camellia oleifera Abel due to products such as tea and seed oil. 12 The secondary metabolites present in C. sinensis are mainly alkaloids, steroids, terpenoids, saponins, and polyphenols. Studies have shown that Camellia species exhibit activities such as antioxidant, antimicrobial, antifungal, antiviral, antitumor, and other health benefits. 13 This study aims to qualitatively investigate phytochemical constituents, flavonoids, coumarins, tannins, saponins, polysaccharides, amino acids, alkaloids, quantification of epigallocatechin gallate (EGCG), and total polyphenols, lipid peroxidation inhibitory and cytotoxic activities of 70% ethanol extracts from different parts of two Camellia species growing wild in Vietnam. The results of this study may be used to compare with previously studied Camellia species, and to guide further studies on these two species.
Materials and Methods
Plants
Fresh shoots (leaf bud including two youngest leaves, NVQ), young leaves (third to fifth leaves, LVQ) and flowers (HVQ) of Camellia vuquangensis Luong, Tran and L. T. Nguyen were collected at Vu Quang National Park, Ha Tinh Province (18°13′27.290388″N; 105°20′20.08428″E; 130 m). Fresh shoots (leaf bud including two youngest leaves, NHT), young leaves (third to fifth leaves, LHT), and flowers (HHT) of Camellia hatinhensis Luong, Tran and L. T. Nguyen were collected at Vu Quang National Park, Ha Tinh Province (18°18′57.92472″N; 105°20′47.51736″E). The fresh materials were washed with tap water and dried at 60°C for 2 days.
Animals and Cell Lines
Purebred BALB/c mice were provided by Biological Laboratory, Institute of Biotechnology—Vietnam Academy of Sciences. Healthy mice, disease-free, with experimental weights of 23–26 g at 12 weeks old were used for the Lipid Peroxidation inhibition test. The cancer cell lines Michigan Cancer Foundation-7 (MFC-7), human lung carcinoma (A549), human hepatocellular carcinoma (HepG2), human colorectal adenocarcinoma (HT-29), human melanoma (SK-Mel-2), and human gastric adenocarcinoma (AGS) were provided by Prof. Chi-Ying Huang, National Yang Ming Chiao Tung University, Taiwan.
Chemicals
Trolox, thiobarbituric acid (TBA), EGCG, galic acid, and ellipticine were purchased from Sigma-Aldrich. Acetonitrile and phosphoric acid were purchased from Merck. DMEM (Dulbecco’s Modified Eagle Medium) supplemented with
Extracts Preparation
Dried materials were milled to a size of 3 mm, then soaked with methanol (MeOH) (Singapore) three times for 7 days each. Methanol extracts were evaporated with an Eyela N-1300V-W (Japan) at 50°C until they were completely dried, and stored at 4°C until further analysis.
Phytochemical Screening of Extracts
Accurately-weighed 100 mg samples of extracted residues were added to 25 mL of 70% ethanol, sonicated for 15 min, filtered, and the filtrates were used for in vitro qualitative reactions.
Test for Flavonoids
Shinoda’s Test (Cyanidin Reaction)
Two milliliters of each filtrate was placed into a test tube, metallic magnesium powder was added, and then a few drops of concentrated hydrochloric acid were added. The test tube heated in a water bath for a few minutes and a purple-red color appears (positive reaction). 14
Ferric Chloride Test
Two milliliters of each filtrate was placed into a test tube, then 3 drops of FeCl3 5% were added. A green-blue coloration indicated the presence of a phenolic hydroxyl group. 14
Sodium Hydroxide Test
One milliliter of each filtrate was placed into a test tube, then 3 drops of NaOH 10% were added. A yellow coloration indicated the presence of flavonoids. 14
Test for Flavonoids by Thin-Layer Chromatography (TLC)
Accurately-weighed 100 mg samples of extracted residues were added to 10 mL of distilled water in a glass beaker, sonicated for 10 min, then shook with 5 mL of n-butanol. The n-butanol extracts were evaporated with an Eyela N-1300V-W at 50°C until they were completely dried. The extracted residues were dissolved in 1 mL of methanol for chromatographic analysis. TLCs were developed for 20 min on 10 × 10 cm Silica gel 60 GF254 (Merck, Germany) with ethyl acetate–acid formic–methanol–water (25:1:1:1, v:v:v:v) mobile phase. After growing the mobile phase to 8 cm, the TLCs were solvent-dried, sprayed with boric acid/oxalic acid reagent, and dried until the spots were visible. TLCs were observed under ultraviolet light at 366 nm, the chromatogram obtained with the test solution should have brighter luminescence spots than the chromatogram obtained with the test solution before the reagent was sprayed. The boric acid/oxalic acid reagent was prepared by mixing 10% boric acid solution and 10% oxalic acid solution in a ratio of 2:1 (v/v). 15
Test for Coumarins
Lactone Ring Opening/Closing Reaction
One milliliter of the filtrate in 2 test tubes, into the first tube was added 0.5 mL of 10% NaOH solution, the second tube was not. After both test tubes were heated in a boiling water bath for several minutes, first tube with a yellow color appears. Then, adding 2 mL of distilled water to each tube, the first tube was clearer than the second, but after they were acidified with a few drops of concentrated HCl, both tubes were equally turbid (positive reaction). 16
Reaction with Diazo Reagent
One milliliter of the filtrate was added to the test tube, then 2 mL of 10% NaOH solution was added to the test tube. Test tubes were heated to boiling, cooled, added a few drops of diazo reagent (freshly prepared), brick red precipitate was observed (positive reaction). Diazo reagent was prepared according to the following protocol. 0.90 g of sulfanilic acid was dissolved in 9 mL of concentrated hydrochloride acid by heating, then diluted with water to 100 mL. Next, 10 mL of the above solution was soaked in ice, then 10 mL of pre-cooled 4.5% sodium nitrite solution (by immersion in ice) was added. The mixture was soaked in ice water for about 15 min, after which 20 mL of 10% sodium carbonate solution was added.
Test for Coumarins by TLC
Ten milliliters methanol was used to dissolve about 10 mg extracted residue, sonicated for 5 min, filtered, obtained TLC analytical solution. TLCs were developed for 20 min on 10 × 10 cm Silica gel 60 GF254 (Merck, Germany) with toluene–ethyl acetate–acetone–formic acid (5:2:2:1, v:v:v:v) mobile phase. After growing the mobile phase to 8 cm, the TLCs were solvent-dried, sprayed with 2% KOH/ethanol reagent, and dried until the spots were visible. TLCs were observed under ultraviolet light at 366 nm, the chromatogram obtained with the test solution should have brighter luminescence spots than the chromatogram obtained with the test solution before the reagent was sprayed. 15
Test for Tannins
The First Test Tube
Two milliliters of filtrate was put into the test tube, then 2 drops of 5% FeCl3 solution were added. The reaction is positive when a greenish-black or light-brown precipitate is present. 14
The Second Test Tube
Two milliliters of filtrate was put into the test tube, then 2 drops of 10% Pb(C2H3O2)2 solution were added. The reaction is positive when a precipitate is present.
The Third Test Tube
Two milliliters of filtrate was put into the test tube, then 5 drops of 1% gelatin solution were added. The reaction is positive when a white precipitate appears.
Test for Saponins
Observation of Foaming
One milliliter of the filtrate was put into a test tube of 20-mL capacity, to which 10 mL of distilled water was added. Test tubes were thumb-cap, shaken vigorously vertically for 5 min, then left to stand still and observe. The reaction is positive when the foam is stable after 10 min. 14
Salkowski’s Test
One milliliter of the filtrate was added to the test tube, and the filtrate was evaporated to obtain residue. The residue was dissolved in 1 mL of acetic anhydride, then 0.5 mL of chloroform was added to the solution. One to two milliliters of H2SO4 was slowly dripped into the wall of the test tube with a pipette. The reaction is positive when a purple-red ring appears on the interface. 17
Test for Saponins by TLC
Ten milliliters methanol was used to dissolve about 10 mg extracted residue, sonicated for 5 min, filtered, obtained TLC analytical solution. TLCs were developed for 20 min on 10 × 10 cm Silica gel 60 GF254 (Merck, Germany) with chlorform–methanol–water (65:35:10, v:v:v) mobile phase. After growing the mobile phase to 8 cm, the TLCs were solvent-dried, sprayed with 10% H2SO4/ethanol reagent, and dried until the spots were visible. TLCs have been observed under normal light, the chromatogram of the test solution should have pink, purple spots. 15
Standard Test for free Reducing Sugar (Fehling’s Test)
One milliliter of the filtrate was added to the test tube. Then 0.5 mL Fehling A and 0.5 mL Fehling B were added to the test tube. Test tubes were boiled in a water bath for several minutes until a brick red precipitate appeared (positive reaction). Fehling A reagent was prepared by dissolving 7.0 g CuSO4·5H2O in distilled water containing 2 drops of dilute sulfuric acid solution. Fehling B reagent was prepared by dissolving 35 g of potassium tartrate (C4H4K2O6) and 12 g of NaOH in 100 mL of distilled water.14, 17
Test for Polysaccharides (Iodine Test)
The first test tube was composed of 4 mL of distilled water and 5 drops of Lugol reagent. The second test tube was composed of 4 mL of filtrate and 5 drops of Lugol reagent. Observed that the color of second test tube is darker than first test tube, the reaction is positive. Lugol reagent was prepared according to the following protocol. Ten gram of potassium iodide (KI) dissolved in about 20–30 mL of distilled water. Next, 5 g of iodine was added and gently heated, with constant stirring, until the iodine was dissolved, then diluted with distilled water to 100 mL to obtain reagent Lugol. Store in amber sealed glass bottle in a dark place. 18
Test for Amino Acids
One milliliter of the filtrate was put into the test tube, then a few drops of 3% ninhydrin reagent was added, boiled the test tube for about 2 min in a water bath, the solution in the test tube turned purple (reactive, positive response). 19
Test for Alkaloids
One hundred milligrams of extracted residue was put into a 50 mL conical flask, 15 mL of 2% H2SO4 solution was added, then boiled for a few minutes. The solution was cooled, the extract was filtered into a decanter, the filtrate alkalinized with 6N NH4OH solution to alkaline pH. The alkaloids were extracted with chloroform (CHCl3) three times, 5 mL each. The CHCl3 extract was pooled and shaken with 2% H2SO4 solution. Acidic water layer was added to 3 test tubes, each tube was about 1 mL and the following reactions were carried out:
Mayer reagent was added to the first test tube. Mayer reagent was prepared by dissolving a mixture of 1.36 g of mercuric chloride (HgCl2) and 5 g of potassium iodide (KI) in 100 mL of water. Bouchardat reagent was added to the second test tube. Bouchardat reagent was prepared by dissolving 2 g of iodine and 4 g of potassium iodide in 10 mL of distilled water, after the iodine had dissolved, add enough water to make 100 mL. Dragendorff reagent was added to the third test tube.
The Dragendorff reagent was prepared according to the following protocol: 0.5 g of Bismuth nitrate was dissolved in 10 mL of concentrated hydrochloric acid, then mixed in a 1:1 (v/v) ratio with a solution containing 4 g of KI in 10 mL of distillate. 17
Test for Alkaloids by TLC
One hundred milligrams of extracted residue was put into a 50 mL conical flask, 15 mL of 2% H2SO4 solution was added, then boiled for a few minutes. The solution was cooled, filtered into a decanter, alkalinized with 6N NH4OH solution to alkaline pH. The alkaloids were extracted with chloroform (CHCl3) three times, 5 mL each. The CHCl3 extracts were combined, completely evaporated, residue was dissolved in 2 mL of methanol, and the obtained solution was used for analysis by TLC. TLCs were developed for 20 min on 10 × 10 cm Silica gel 60 GF254 (Merck, Germany) with chloroform–methanol–NH4OH solution with concentration of 6N (7:1:0.1) mobile phase. After growing the mobile phase to 8 cm, the TLCs were solvent-dried, sprayed with Dragendorff reagent. The TLCs were observed under normal light, the chromatogram of the test solution should show yellow-orange spots. 15
Qualitative Analysis of Epigallocatechin Gallate (EGCG) from Extracted Residues Using High-Performance Liquid Chromatography (HPLC)
Five milligrams extracted residue was accurately weighed and completely dissolved with 10 mL methanol under ultrasonic wave conditions. One milligram of EGCG was accurately weighed, then completely dissolved with 10 mL of methanol under ultrasonic conditions. Samples were filtered through a 0.45 µm filter before chromatography.
Samples were analyzed for EGCG by HPLC containing Agilent C18 column (5 µm particle size, 4.5 – 250 mm). Ten microliters of each sample were injected and the column temperature was 40°C. The 0.1% acetonitrile–phosphoric acid mobile phase (ratio 10/90) was used with a flow rate of 1 mL/min. Qualitative analysis of EGCG was carried out by ultraviolet (UV) detector at 270 nm. 15
Quantitative Analysis of Total Polyphenols
Prepare of Standard Solution
Fifty milligrams of standard gallic acid was accurately weighed into a 100 mL brown volumetric flask, and enough water was added to the mark for dissolution. Five milliliters of the above solution was accurately aspirated into a brown 50 mL volumetric flask, just enough water was added, and the solution was shaken to obtain a solution with a concentration of gallic acid about 0.05 mg/mL.
Preparation of Test Solution
One hundred milligrams extracted residue was accurately weighed into a 25 mL brown volumetric flask, 20 mL of water was added and ultrasound for 15 min, added just enough water, and mixed well. The solution was filtered and the first 10 mL of the filtrate was discarded.
Investigation of optical absorption: 1.6 mL of standard solution and 0.8 mL of test solution were accurately aspirated into a brown 10 mL volumetric flask; then 0.4 mL of Folin-Ciocalteu reagent, 4.0 mL of distilled water and Na2CO3 solution were added to each flask to make up to 10 mL, and shaken well. The UV absorption spectrum of the analytical solutions were scanned in the wavelength range from 400 to 850 nm, the maximum absorption wavelength was selected for analysis.
Constructing a Calibration Curve for Gallic Acid
Preparation of Gallic Acid Calibration Solutions.
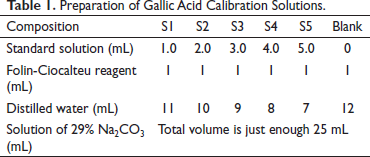
The absorbances of the solutions were determined and a calibration curve was constructed with absorbance as the vertical axis and the solution concentration as the horizontal axis.
Quantitative Analysis of Total Polyphenols
The 0.8 mL of test solution was accurately aspirated into a brown 10 mL volumetric flask, then 0.4 mL of Folin-Ciocalteu reagent, 4.0 mL of distilled water and Na2CO3 solution were added to make up 10 mL, and was shaken well. The absorbances of the solutions were measured. The concentration of the photometric analytical solution of the test sample is calculated by the formula:
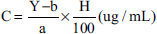
where C is the concentration of the photometric solution of the test sample (µg/mL); A is the absorbance of the test solution; a, b are the coefficients of the standard curve equation for gallic acid; H is the purity of the standard substance (%).
The polyphenol content in the extracted residue sample was determined according to the formula:
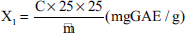
where X is the total polyphenol content in extracted residue samples calculated by gallic acid (mg GAE/g); C is the concentration of the photometric analytical solution of the test sample (µg/mL); m is the mass of extracted residue (mg).
Cytotoxic Activity Assay
Cell Culture
The cancer cell lines were cultured according to the routine guidelines of ATCC (American Type Culture Collection). 20 Specifically, six experimental cancer cell lines were grown in culture medium DMEM supplemented with 2 mM L-glutamine and fetal bovine serum (10% FBS) and other necessary components at 5% CO2 condition, at 37°C. All cell lines (MCF-7, A549, HepG2, HT-29, SK-Mel-2, and AGS) were subcultured after three days.
Process subculture was performed as follows: first, the possibility of development of the cell line was examined by the microscope. The cells were washed with PBS to remove the original culture medium. Trypsinization with trypsin–ethylenediaminetetraacetic acid (EDTA) was carried out at 37°C for 1–3 min to separate the adherent cells, then 5 mL of culture medium was added to stop the effect of trypsin. The suitable subculture ratio was determined by cell density counting using an erythrocyte counting chamber. Trypsin was removed by centrifugation at 9000–1000 rpm for 5 min, then the solution was removed and the residue was retained. The cell residue was diluted with the necessary culture medium to obtain a cell density suitable for cell growth. The culture flasks containing the cells were maintained in the culture chamber at 37°C and 5% CO2. During culture, for non-adherent cell types, trypsinization was not performed.
Cytotoxic Activity Assay for Monolayer Cultured Cells
The cytotoxic activities were performed according to the method of Monks (1991). 21 The test was carried out to determine the total cellular protein content based on the optical density (OD) measured when the protein composition of the cells was stained with sulforhodamine B (SRB). The more cells (more protein) the greater the OD value because the measured OD value is directly proportional to the amount of SRB bound to the protein molecule.
The solution of extracted residue or pure compound (10 µL) was diluted in 10% dimethyl sulfoxide (DMSO), then put into a 96-well tray to achieve a series of concentrations of 100 µg/mL, 20 µg/mL, 4 µg/mL, 0.8 µg/mL, and 0.16 µg/mL. Cells were separated by trypsinization, then counted in a counting chamber to adjust the density to suit the assays. The test wells were added to the appropriate amount of cells (in 190 µL of medium). Another 96-well tray containing no extracted residue or pure compound but containing cancer cells (180 µL) was used as a day 0 control. After 1 h, in the day 0 control tray the cells were fixed with trichloracetic acid (TCA). After the growth period in the CO2 incubator, cells were fixed to the bottom of the wells with TCA for 1 h and were stained with 0.4% SRB for 30 min at 37°C. SRB was removed from the test wells, then the test wells were washed three times with acetic acid and then air-dried at room temperature. The bound SRB was dissolved using 10 mM unbuffered Tris base, then the protein molecules were stained, put on a plate shaker and gently shaken for 10 min and used an ELISA Plate Reader (Bio-Rad) to read the results of the color content of the SRB dye through the absorption spectrum at 515 nm. The viability of cells in the presence of extracted residue or pure compound was determined by the following formula:
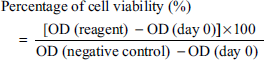
The assays were repeated three times to ensure accuracy. Ellipticine was used as a positive control and tested at concentrations of 10 µg/mL, 2 µg/mL, 0.4 µg/mL, and 0.08 µg/mL. The 10% DMSO solution was used as the negative control.
Lipid Peroxidation Inhibitory Activity (MDA Assay)
The antioxidant activity assay through inhibition of membrane lipid peroxidation (MDA assay) was performed according to the protocol previously described with slight variation.21–23 The ability of the sample to inhibit lipid peroxidation was determined by determining the content of malondialdehyde (MDA), which is a product of membrane lipid peroxidation. MDA is able to react with TBA to form trimethin complex (pink color) with maximum absorption peak at λ = 532 nm.
All experimental procedures that involved mice were conducted in accordance with the “Guideline for the Care and Use of Laboratory Animals” which was approved by the Institute of Biotechnology—Vietnam Academy of Science and Technology.
Preparation of Test Sample
The extracted residue or pure compound was weighed accurately, then diluted to concentrations of 10,000 µg/mL, 2000 µg/mL, 400 µg/mL, 80 µg/mL, and 16 µg/mL. Then 0.1 mL of test sample at the test concentrations was reacted with 1 mL of brain homogenate and added 0.8 mL of phosphate buffer, 0.1 mL of Fenton system, the final concentrations of the sample in the test tube were reduced 20 times to 500 µg/mL, 100 µg/mL, 20 µg/mL, 4 µg/mL, and 0.8 µg/mL. The standard set of Fenton reagents we used for the experiments including ammonium iron (II) sulfate hexahydrate [(NH4)2Fe(SO4)2·6H2O] (Sigma Ultra, minimum 99% pure); 0.5 M EDTA solution, pH 8.0 (Ambion); (+) Sodium L-ascorbate (Sigma), 30% hydrogen peroxide (Sigma Aldrich), thiourea (Sigma), and H2O.
MDA Assay
Mouse brain was separated and crushed homogeneous in phosphate buffer solution (pH = 7.4) in the ratio 1:10 at temperature 0–4°C. One milliliter (1 mL) of brain homogenate was added and 0.1 mL of test sample at different concentrations, 0.8 mL of phosphate buffer and 0.1 mL of Fenton reagent (FeSO4 0.1 mM:H2O2 15 mM in the ratio 1:1). The mixture was incubated at 37°C for 15 min. One milliliter (1 mL) of 10% trichloroacetic acid was added to stop the reaction, then centrifuged at 12,000 rpm for 5 min. The clear solution was reacted with 1 mL of 0.8% TBA (in a ratio of 2:1) and incubated at 100°C for 15 min. After cooling, the absorbance was measured at λ = 532 nm. Trolox was used as a positive control. Percentage inhibition was calculated with the formula:
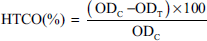
where ODC is the optical density of the control well without the test sample; ODT is the optical density of the test specimen.
Statistical Analysis
The IC50 values (concentration that inhibits 50% of cell growth) were determined using Table-Curve 2D computer software, version 4.0. ANOVA testing was performed using Minitab version 19 software.
Results
Yield of the Extraction Processes
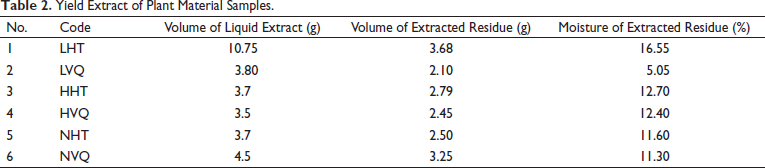
The yields of the studied samples are presented in Table 2. The yields of the studied samples were not significantly different and varied between 2.10 and 3.68 g.
Yield Extract of Plant Material Samples.
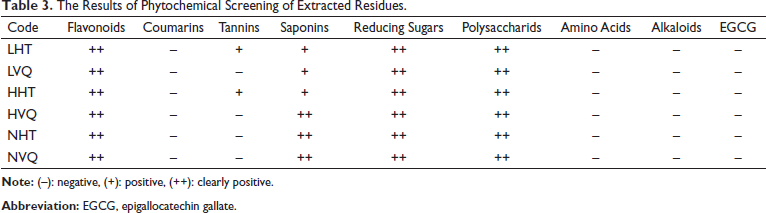
Phytochemical Screening of Extracted Residues
The results of phytochemical screening of extracted residues are summarized in Table 3. None of the samples showed the presence of amino acids, alkaloids, coumarins or EGCG. Two samples of LHT and HHT tested positive for tannins, while the other samples were negative.
The Results of Phytochemical Screening of Extracted Residues.
Quantification of Total Polyphenols
The results of scanning the spectrum of standard solutions and test solutions on a spectrophotometer in the wavelength range from 300 to 800 nm have shown absorption peak values at wavelengths 737.0–740.0 nm. Therefore, 740.0 nm was selected as the analytical wavelength (Figure 1).
Absorption Peak Values of Extracted Residues and Calibration Curve of Standard Gallic Acid.
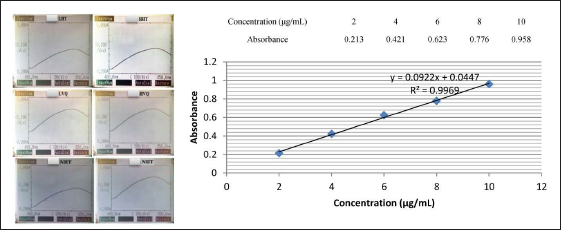
The result of the standard curve construction according to the gallic acid are presented in Figure 1.
The quantitative results of total polyphenols in the extracted residues were between 319.30 and 342.60 mg GAE/g (Table 4). The total polyphenol contents of the samples HVQ, NVQ, LHT, NHT, and HHT were similar and all of them were lower than that of LVQ (p = .001).
Total Polyphenol Contents in Extracted Residues (mg GAE/g).
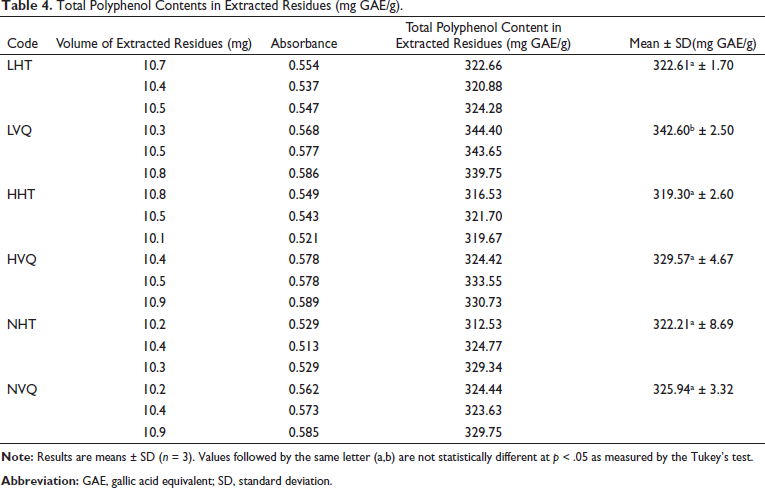
Phenolic compounds are present in all the different parts of Camellia species (such as fresh green leaves, fresh tea buds, or flushes), and the total polyphenols content corresponding to the quality of the teas (Table 5).
Total Polyphenols of Some Camellia Species that were Previously Reported.
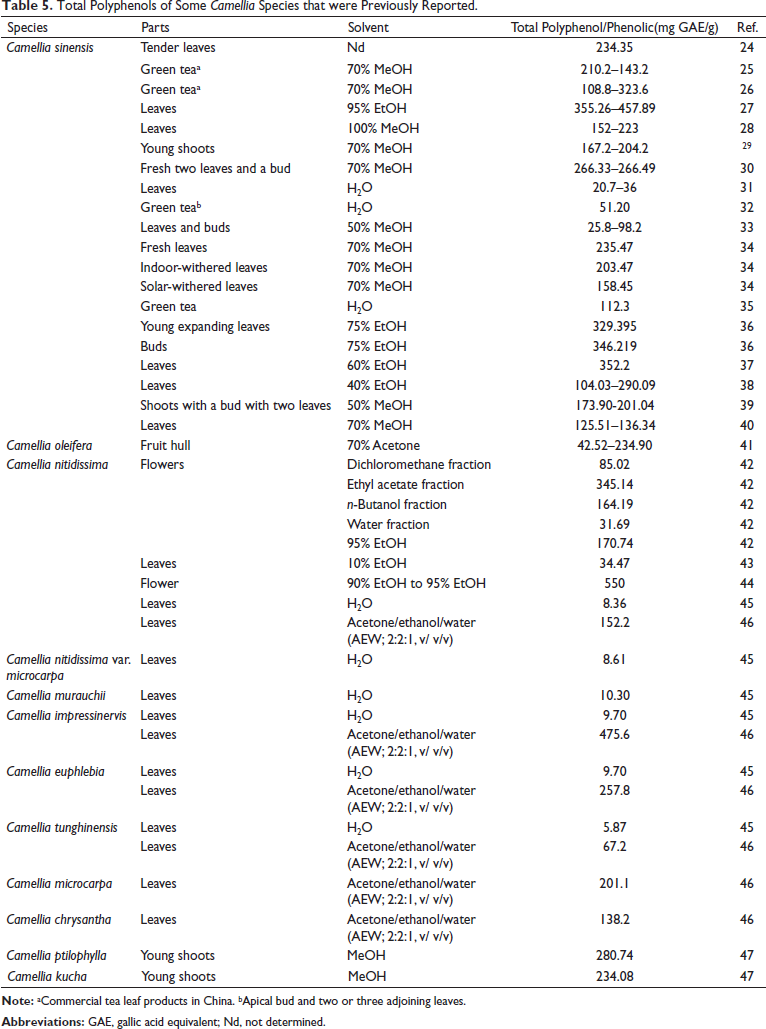
Polyphenols are the main constituents in tea, accounting for 20%–30% of the dry weight of tea, of which catechins are the dominant group with 60%–80% of total polyphenols. 48 Table 5 shows that EtOH is the best solvent to extract polyphenols from Camellia species. The total polyphenols in the leaves, flowers, and buds of C. vuquangensis and C. hatinhensis ranged from 319.3 to 342.6 (mg GAE/g), which are comparable to the total polyphenols of different parts of C. sinensis,26, 35, 36 and lower than flowers of Camellia nitidissima. 44
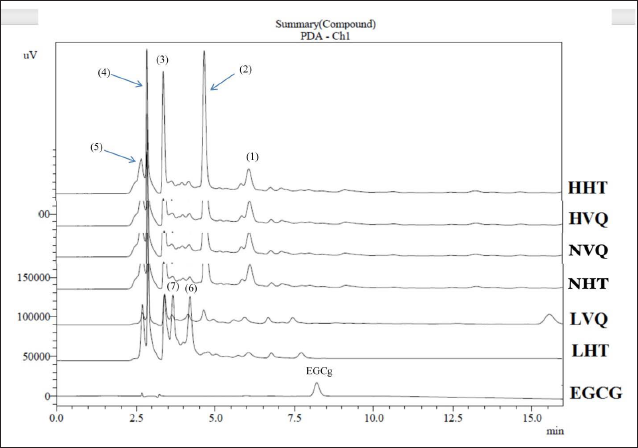
EGCG is the most important polyphenol of C. sinensis,48, 49 fresh bud and the first two leaves contain the highest amount which represents approximately 8–12% of dry weight.48–51 All parts (leaves, flowers, shoots) of C. vuquangensis and C. hatinhensis in this study did not have the presence of EGCG, gallocatechin gallate (GCG), epicatechin gallate (ECG), or catechin gallate (CG) (Figure 2).
HPLC Chromatogram of Extracted Residues at 270 nm..
Cytotoxic Activity
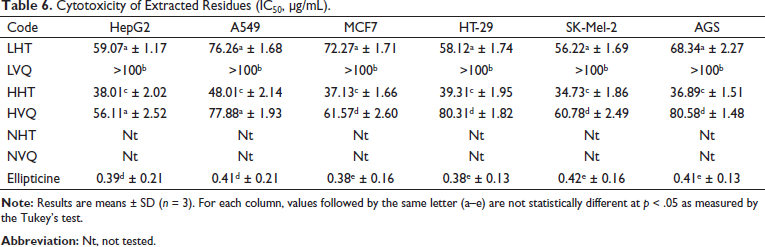
The results of cytotoxicity assessment against cancer cell lines are summarized in Table 6. The samples HHT, LHT, HVQ showed moderate cytotoxic activity against different cancer cell lines HepG2, A549, MCF7, SK-Mel-2, HT-29, and AGS with IC50 values in the range 38.01–59.07 µg/mL, 48.01–77.88 µg/mL, 37.13–72.27 µg/mL, 34.73–60.78 µg/mL, 39.31–80.31 µg/mL, and 36.89–80.58 µg/mL, respectively. Meanwhile, sample LVQ showed weak activity with IC50 values > 100 µg/mL for all cell lines that were tested. According to the standards of the US National Cancer Institute (NCI), the extract is considered to have good activity with IC50 ≤ 20 µg/mL, while the purified substance is considered to have good activity when IC50 ≤ 5 µM. 52
Cytotoxicity of Extracted Residues (IC50, µg/mL).
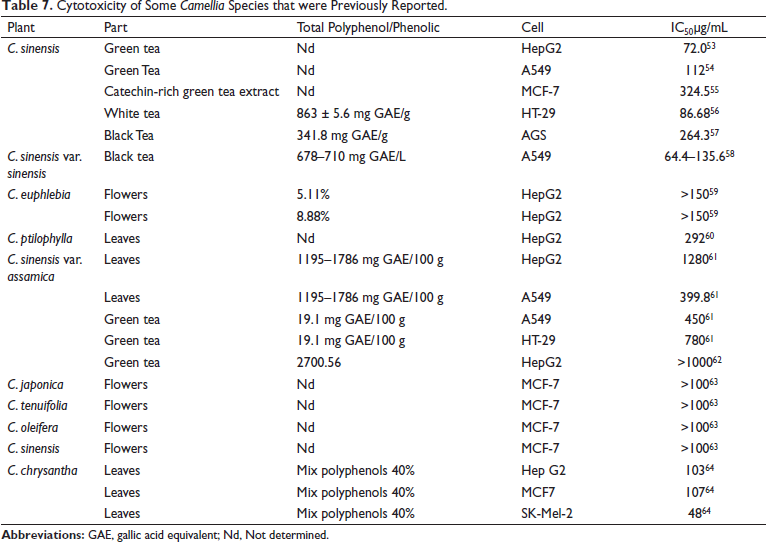
The cytotoxic activities of several species of Camellia that have been reported by other authors are summarized in Table 7, which showed stronger cytotoxic activity of C. vuquangensis and C. hatinhensis compared with other previously reported species. The cause of the strong cytotoxicity of C. vuquangensis and C. hatinhensis may be related to their high total polyphenols, but EGCG, GCG, ECG, and CG were not responsible.
Cytotoxicity of Some Camellia Species that were Previously Reported.
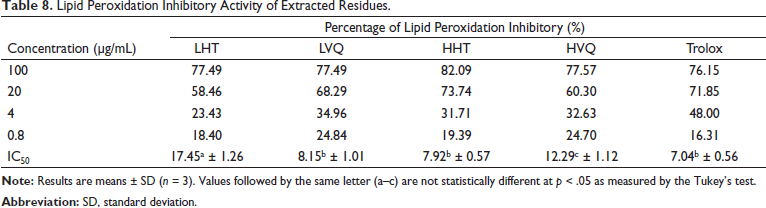
The results of the determination of antioxidant activity through inhibition of membrane lipid peroxidation (MDA assay) are presented in Table 8. All samples LHT, LVQ, HHT, and HVQ showed strong lipid peroxidation inhibitory activity comparable to positive control with IC50 values in the range 7.92–17.45 µg/mL.
Lipid Peroxidation Inhibitory Activity of Extracted Residues.
Discussion
Jiang et al. analyzed the polyphenols in petals, stamens and sepals of the full flowering flowers of 22 species of yellow Camellia by HPLC and showed that EGCG was only a minor component or was absent in many species. 65 For Camellia ptilophylla, EGCG acted as a minor component in low concentrations.47, 66 Our results are in agreement with published results by Wang et al. who reported on catechins and the bioactivity of Camellia sasanqua. 67 The leaves of the yellow Camellia species in the study of Lin et al. contained significantly high levels of EGCG. 45 EGCG has also been found with high content in the leaves of Camellia assamica, 46 Camellia kucha, 47 and Camellia taliensis. 68 The 60% ethanol extracts of the leaves of C. japonica showed α- and β-anomers of pedunculagin, catechin, and epicatechin (EC). 69
The LVQ sample exhibited the weakest cytotoxic activities, which may have been related to the absence of components corresponding to the peaks (1) and (2), at the same time with a low content of the component corresponding to the peaks (3) and (5) (Figure 2). The high content of components corresponding to peaks (2) and (3) may have been responsible for the strong cytotoxic activities of the HHT sample. The cytotoxic activities of the LHT sample may have been related to the components with peaks (6) and (7), respectively. Many studies have shown that catechin compounds were not primarily responsible for the cytotoxic activities, rather, flavonoid glycosides may have played a major role.45,58,59,62,63
MDA is an indicator of lipid peroxidation. The concentrations of MDA in the liver, brain, and blood of the rats treated with green tea (EGCG (337 mg/L), epigallocatechin (EGC) (268 mg/L), EC (90 mg/L), ECG (60 mg/L), and caffeic acid (35 mg/L) were significantly reduced compared with the control group, especially in the brain, which was decreased more than two times. 70 Green tea catechin polyphenols reduced MDA levels in the cerebral cortex of rats with intermittent hypoxia by 40%. 71 Total flavones of Camellia at doses of 40 and 80 mg/kg reduced MDA level in brain tissues. 72 The MDA was significantly reduced in the brains of mice treated with gallic acid and green tea leaf extract. 73 The 95% ethanol extract obtained from fresh leaves of C. sinensis at a dosage of 200 mg/kg significantly reduced serum and hepatic MDA concentration in rats. 74 Ethanolic extracts obtained from fresh flowers of C. japonica at doses of 40, 80 mg/kg significantly reduced serum MDA levels in rats. 75 The C. japonica bee pollen ethyl acetate extract (including gallic acid, p-hydroxybenzoic acid, ferulic acid, ellagic acid, quercetin and kaempferol) at doses of 2 and 4 g/kg showed a significant decrease in liver MDA contents in mice liver. 76 Biflavonoids and kaempferol from shells of C. oleifera at a dose of 200 mg/kg reduced levels in blood serum of mice in each group by nearly 50%. 77 Thus, the strong lipid peroxidation activity of the two Camellia species in our study may have been due to the flavonoid or/and phenolic compounds.
Conclusion
Research on polyphenols, lipid peroxidation and cytotoxic activities of two species C. vuquangensis and C. hatinhensis showed no presence of compounds EGCG, GCG, ECG, and CG, but biological activities of these two species were stronger when compared with previously reported Camellia species. The total polyphenol content of the shoots, leaves, and flowers were comparable to that of green tea. Further research is necessary to have evaluate the seasonal variation and the effect of different extraction methods on total polyphenol content to consider them as new sources of tea with economic value. Further studies on structural determination of polyphenol compounds and their biological activities are also needed in the future.
Summary
The total polyphenol contents of leaves, flowers, and young shoots of two yellow Camellia species, C. vuquangensis and C. hatinhensis were comparable to that of green tea.
Extracts of leaves, flowers of C. vuquangensis and C. hatinhensis showed strong lipid peroxidation inhibitory activities (IC50: 7.92–17.45 µg/mL).
Extracts of leaves and flowers of C. vuquangensis and C. hatinhensis showed moderate cytotoxic activities against cell lines HepG2, A549, MCF7, SK-Mel-2, HT-29, and AGS (IC50: 34.73–80.58 µg/mL).
Footnotes
Abbreviations
Declaration of Conflicting Interests
The authors declared no potential conflicts of interest with respect to the research, authorship, and/or publication of this article.
Ethical Approval
All experimental procedures that involved animals (mice) were conducted in accordance with the “Guideline for the Care and Use of Laboratory Animals” which was approved by the Medical-Biological Research Ethics Committee of Institute of Biotechnology Scientific Council (No.140/QĐ-CNSH dated April 13, 2011), Vietnam.
Funding
This research was funded by Ministry of Natural Resources and Environment, Vietnam, grant number TNMT.2022.05.07.
Informed Consent
There are no human subjects in this article and informed consent is not applicable.