
Abstract
Fridericia platyphylla (Cham.) L.G. Lohmann (FP) has cytotoxic, anti-inflammatory, and analgesic properties. We aimed to characterize the cytotoxic and antiproliferative effects of FP extract on normal (GAS) and tumor-derived (ACP02 and HepG2) cell lines. The effective concentrations (EC50s) by tetrazolium bromide assay (MTT) were 56.16, 43.68, and 42.57 µg mL−1 and 69.38, 41.73, and 52.39 µg mL−1 by neutral red assay for GAS, ACP02, and HepG2 cells, respectively. The extract decreased nuclear division indices, which was not reflected in cell proliferation curves. Flow cytometric analyses showed that even 30 µg mL−1 extract (shown to be noncytotoxic by MTT assay) increased the sub-G1 population, indicating cell death due to apoptosis and necrosis. A cytokinesis-block micronucleus cytome assay showed that 30 µg mL−1 of the extract increased the frequency of nuclear buds in tumor cells. Real-time quantitative polymerase chain reaction showed CCND1 upregulation in doxorubicin-treated GAS cells and BCL-XL, BIRC5, and MET downregulation in 5 or 30 µg mL−1 in FP extract-treated ACP02 cells. In conclusion, FP extract modulated apoptosis- and cell cycle-related genes and presented selective cytotoxicity toward tumor cells that deserves further investigation by testing other cell types. Our results demonstrated that even medicinal plants exert adverse effects depending on the extract concentrations used and tissues investigated.
Introduction
Cancer is a disease with high incidence and clinical relevance, for which there is a dearth of specific and effective therapies. In many patients, the disease rapidly progresses to a metastatic state. Gastric cancer is an aggressive type of cancer that has a daunting impact on global health. It is often diagnosed at an advanced stage, so that in addition to surgery, chemotherapy is always required. 1 The adverse effects of this treatment include weakness (in 95% of treated patients), fatigue (90%), nausea (77%), hair loss (76%), and vomiting (75%). 2
Natural products continue to provide alternatives to traditional medicine for various devastating diseases including diabetes, cardiovascular diseases, cancer, and others. 3 Around 80% of the populations of developing countries currently use medicinal plants for healing purposes. These plants are considered a rich resource of compounds which can be used in drug discovery and development. 4 The most common reasons for use of herbal drugs include health promotion, poor outcomes of other therapies, limited treatment options, and the belief that herbal and natural products are better or safer.
Fridericia platyphylla (Cham.) L.G. Lohmann (FP) (synonym Arrabidaea brachypoda) is a Bignoniaceae vine shrub native to the Brazilian savanna “Cerrado” 5 popularly known as “cipó-una.” 6 In folk medicine, Brazilian people consume its roots to treat kidney stones, joint pains, 6 and gastric ulcers (the most common disorder of the upper digestive tract). 7 In addition to these traditional uses, FP extract has been investigated for other biological activities. Recent in vivo studies have revealed its anti-inflammatory, analgesic, and gastroprotective activities. 7,8 The present study aimed to investigate whether FP extract affects cell viability and/or induces DNA damage in normal (GAS) and tumor (ACP02) gastric cells and to quantitate the selectivity of FP for gastric cancer cells as a measure of its viability for use in cancer treatment. The effects of FP extract on redox state, cell cycle kinetics, and gene expression were also analyzed to explore its mechanisms of action.
Materials and methods
Plant material and preparation and analysis of FP extract
The roots of FP Bureau (the plant name was verified with http://www.theplantlist.org) were collected in April 2013 from “Cerrado” areas at the Sant’Ana da Serra farm in João Pinheiro, Minas Gerais, Brazil (location: 17˚4404500 S, 46˚1004400 W). The plant was identified using macroscopic and microscopic methods at the Instituto de Ciências Exatas e Biológicas by Maria Cristina Teixeira Braga Messias from the José Badine Herbarium of the Federal University of Ouro Preto (UFOP), Minas Gerais, Brazil. A voucher specimen (no. 17935) was deposited at the same Herbarium at UFOP.
The dried roots (1000 g) were extracted by iterative percolations, at room temperature, with 70% ethanol (EtOH) in H2O. Crude hydroethanolic extracts were obtained as described by Rocha et al. 9 and were they diluted to obtain working concentrations described relative to the maximum dilution made in phosphate buffered saline (PBS), which was also employed as a negative control in all tests. For dereplication purposes, the FP extract was analyzed by liquid chromatography-mass spectrometry (LC/MS), and its metabolite profile was compared to that of a previously investigated hydroalcoholic extract. 7 This allowed unambiguous identification of the previously isolated compounds brachydin A, brachydin B, brachydin C, brachydin D, brachydin E, brachydin F, brachydin G, brachydin H, brachydin I, and brachydin J (Table 1).
Identification of compounds in the roots from FP by LC/MS.

a[M-H] in m/z.; FP: Fridericia platyphylla.
Chemical compounds
MTT salt, 3-[4,5-dimethylthiazol-2-yl]-2,5-diphenyl tetrazolium bromide (CAS: 298-93 -1), cytochalasin b (CAS: 14930-96-2), doxorubicin (CAS: 25316-40-9), and neutral red (CAS: 553-24-2) were obtained from Sigma-Aldrich (St Louis, Missouri, USA). Lactate dehydrogenase assays (CAS: 86-2-30—Labtest, Lagoa Santa, Minas Gerais, Brazil), Giemsa (CAS: 1.09204.0500, Merck®, Rio de Janeiro, Brazil), and CM-H 2 DCFDA probe (5-[and-6]-chloromethyl-2′,7′-dichlorodihydrofluorescein diacetate, acetyl ester (Life technologies, Eugene, Oregon, USA) were also employed in the present study. All other chemicals used were of analytical grade.
Cell lines and culture conditions
Tumor (ACP02) and normal human gastric primary cells obtained by biopsy (GAS) were provided by Dr Rommel Burbano (Federal University of Pará, UFPA, Brazil) 10 and were cultivated in Dulbecco’s Modified Eagle’s Medium high-glucose supplemented with 10% fetal bovine serum (FBS) (Gibco, Grand Island, New York, USA) and 1.0% penicillin and streptomycin (Sigma-Aldrich) in a 5% carbon dioxide atmosphere at 37°C and 96% relative humidity. Human hepatocellular carcinoma cells (HepG2) were kindly provided by the Laboratory of Nutrigenomics of FCFRP of University of São Paulo (USP)—Brazil and were cultivated under the same conditions as the other gastric cell lines, except that they were supplemented with 15% FBS. Three independent cultures were used to evaluate all parameters, and all treatments except for assessment of proliferation curves were performed in serum-free medium.
Cell viability assays
For all cell viability assays (MTT, neutral red, and LDH), 1.0 × 10⁴ cells/well were seeded into 96-well plates and treated with the FP extract (5.00–500 µg mL−1) for 24 h. Because cytotoxicity was observed at the lowest concentration, a new MTT test was performed at concentrations ranging from 5.00–100 µg mL−1). This concentration range was used for both the other cell viability assays. Considering the cytotoxicity observed at low concentrations, the FP extract was also tested in a system with high xenobiotic metabolic activity (HepG2 cells).
MTT assays were conducted primarily as described by Mosmann 11 and neutral red assays were performed according to the method of Repetto et al. 12 with modifications standardized by our research group. 13 –15 The results are expressed as the percentage (%) of viable cells relative to those in the negative control group (PBS). EC50 (mean effective concentration) values were calculated for both tests.
For lactate dehydrogenase (LDH) release assays, positive control cells were treated with 1% Triton 100×. After treatments, samples were analyzed using a commercial LDH kit following the manufacturer’s recommendations and methods previously standardized in our laboratory. 15 Absorbances were measured twice at λ = 340 nm with an interval of 1 min, using a microplate spectrophotometer. For each sample, LDH activity was expressed as U mL−1 and calculated using the following equation: LDH release = (A1 − A2)/2, where A1 is the first absorbance measured and A2 is the absorbance measured after 1 min. The values obtained were multiplied by a calibration factor of 10.119.
Apoptosis evaluation by flow cytometry of cells stained with acridine orange and ethidium bromide
The protocol described by McGahon et al. 16 was applied to distinguish between viable, apoptotic, and necrotic cells in normal and cancerous gastric cell lines; 1.0 × 10⁵ cells/well were seeded into 12-well plates and treated for 1.0, 3.0, 6.0, 12, or 24 h with the FP extract (5.0, 30, or 60 µg mL−1) or vehicle (PBS) and doxorubicin (DXR 0.2 µg mL−1). Cells were trypsinized, and 25 μL of cell suspension was mixed with 1.0 μL of staining solution containing 100 µg mL−1 acridine orange (AO) and 100 µg mL−1 ethidium bromide (EB). A total of 600 cells were analyzed with a 40× objective lens using a Nikon fluorescence microscope (Tokyo, Japan) with an excitation wavelength of 515–560 nm and a 590 nm barrier filter. Cells were divided into three categories as follows: living cells (normal green nucleus), apoptotic cells (bright green nucleus with condensed or fragmented chromatin), and necrotic cells (uniformly orange-stained cell nuclei).
Induction of cell death was also measured by fluorescence-activated cell sorting using the Annexin V binding method. For analysis by flow cytometry (Guava easyCyte 8HT; Millipore, Guava Technologies, Hayward, California, USA), cells were cultivated and treated by the same procedure used for AO/EB analysis. However, sampling was performed after only 24 h of treatment. After treatments, cells were harvested and prepared using an FITC Annexin V/dead cell apoptosis kit with FITC annexin V and PI, for flow cytometry (CAT: V13242; Invitrogen, Carlsbad, California, USA) according the manufacturers protocol. Cells were acquired and data analyzed using Guava CytoSoft 4.2.1 Software.
The results of both tests are presented as percentages of viable, apoptotic, and necrotic cells.
Cytostatic evaluation
Cell proliferation was evaluated using a method described by da Costa Lopes et al. 17 and standardized in our lab. 18 Briefly, 2.5 × 10⁴ cells/well were seeded into a 24-well plate and exposed to two noncytotoxic concentrations (5.0 and 30 µg mL−1) and one cytotoxic (60 µg mL−1) concentration of the FP extract based on previously performed cell viability assays. Cells were harvested after treatment for 24, 48, 72, 96, or 120 h, and cell proliferation curves were drawn based on cell counting and total protein content.
DNA content was also analyzed by flow cytometry. Cells were treated as described to generate cell proliferation curves, except that treatment time was reduced to 24 h. Samples were prepared using the Cycle Test Plus DNA kit (BD Biosciences, Heidelberg, Germany) according to the manufacturer’s instructions. Readings were obtained using a Guava EasyCyte Mini Flow Cytometer (Guava Technologies, Hayward, California, USA). A total of 5000 events were acquired per sample. Results were presented as the percentage of cells in each phase of the cell cycle: G1, S, and G2/M. The subG1 population was also quantitated to represent cells undergoing DNA fragmentation.
The nuclear division index (NDI) was evaluated in conjunction with the cytokinesis block micronucleus cytome (CBMN-cyt) DNA instability assay. 19 Briefly, 1.0 × 10⁶ cells were stabilized in 25-cm3 culture flasks (Corning, Lowell, Massachusetts, USA) and treated with the FP extract (5.0, 15, or 30 µg mL−1) or vehicle. After treatment, cultures were exposed to 3 µg mL−1 cyt-B for 30 h and harvested using 1.0% sodium citrate as a hypotonic solution. After fixation (methanol: acetic acid, 3:1, v/v), slides were prepared and stained with 5.0% Giemsa diluted in phosphate buffer (0.06 M Na2HPO4 and 0.06 M KH2PO4, pH 6.8) for 10 min, then analyzed under a light microscope (Nikon Eclipse E200, Tokyo, Japan) at 400× magnification. A total of 1500 viable cells were scored to calculate the NDI. To score micronuclei (MNis), nucleoplasmatic bridges (NPBs), and nuclear buds (NBUDs), 3.000 binucleated cells were analyzed per experimental point in the same slides of NDI.
Measurement of intracellular reactive oxygen species levels
The oxidative capacity of the FP extract was evaluated by quantifying intracellular reactive oxygen species (ROS) levels using CM-H2DCFDA as a probe. Cells were seeded into sterile black plates and exposed to vehicle (PBS), positive control (1 mM H2O2), or 5.0, 30, or 60 µg mL−1 of FP extract for 1.0, 3.0, 6.0, 12, or 24 h. After treatment, we used an experimental protocol previously described. 13,15 Results are presented as fluorescence intensities.
Gene expression analysis by RT-qPCR
Cells were treated using the same protocols employed in the CBMN-cyt assays using vehicle, positive control, or 5.0, 30, or 60 µg mL−1 of FP. RNA was extracted using a PureLink® RNA Mini Kit (Life Technologies, Carlsbad, California, USA). The quantity and quality (ratio of absorbance at 260/280 between 1.7 and 2.0) of each RNA were determined by spectrophotometry (NanoDrop 2000C—Thermo Scientific, San Jose, California, USA). RNA integrity was assessed by electrophoresis in a 1% agarose gel. 20 RNA samples (1 μg) were treated with DNase I (1 U μL−1; amplification grade; Invitrogen) and reverse-transcribed using the SuperScript III First Strand Synthesis System, Oligo-DT, 12 –18 and random primers following manufacturer’s protocol (Invitrogen).
Reference genes were selected using the electronic normalization program NormFinder. The primers for GAPDH (glyceraldehyde-3-phosphate dehydrogenase) and HPRT1 (hypoxanthine guanine phosphoribosyl transferase 1) as well as the genes of interest, TP53 (tumor protein P53), CCND1 (cyclin D1), BAX (B-cell lymphoma 2-associated X protein), BCL-XL (B-cell lymphoma-extra-large), BIRC5 (Baculoviral inhibitor of apoptosis repeat containing 5), and MET (hepatocyte growth factor receptor) were designed using Gene Runner Software Version 3.05. 21 Primer sequences are listed in Table 2. Primers for the CAT (catalase, NM_001752), GSR (glutathione reductase, NM_000637), GPX1 (glutathione peroxidase 1, NM_00058), and NFE2 L2 (nuclear factor, erythroid 2-like 2, NM_001136023) genes were obtained from KiCqStart® SYBR Green Primers (Sigma-Aldrich).
List of primers sequences used for RT-qPCR.

RT-qPCR: real-time quantitative polymerase chain reaction; %GC: Percentage of guanine and cytosine.
PCR analyses were performed using a Techne Quantum™ Real Time PCR Cycler System (Staffordshire, UK) with Platinum® SYBR® Green qPCR SuperMix UGD (Invitrogen). The final volume was 10 µL containing 200 mmol of each primer and 10 ng of cDNA template. The reaction mixture was subjected to the following amplification program: 95°C for 5 min, followed by 50 cycles of 95°C for 15 s, 60°C for 15 s, and 72°C for 15 s. Finally, a melting curve was generated in the range of 50–95°C.
Statistical analyses
Sample homogeneity was tested using Bartlett’s test. One-way analysis of variance followed by Tukey’s test was performed with GraphPad Prism 5® software (La Jolla, California, USA). All data are presented as mean ± standard deviation with p ≤ 0.05 indicating significance. Gene expression data were analyzed with Quantsoft V.1.1.30™ Software (Staffordshire, UK) and normalized using the cycle threshold (C t) for each sample in the linear region of the amplification plot. The ΔC t values were determined relative to GAPDH and HPRT1 levels. The ΔΔC t values were calculated using the means of the treated groups (FP) relative to the negative control group (PBS). Fold changes in expression were calculated from ΔΔC t values. 22 Differential gene expression was considered to be significant when p ≤ 0.05 compared to the control when analyzed by Student’s t-test.
Results
Cell viability
Cell viability assays were performed in xenobiotic metabolizing (HepG2) and non-metabolizing (normal and cancerous gastric) cell lines to evaluate the effect of metabolism on the cytotoxicity of FP extract.
The FP extract decreased the viability of tumor cells at 50 µg mL−1 and that of normal cells at 100 µg mL−1 (Figure 1(a)). To establish more accurate effective concentration (EC50s—the concentration of a drug that gives half-maximal response) and therapeutic index, the MTT test was repeated for each cell line using extract concentrations ranging from 5.00 to 100 µg mL−1 (Figure 1(b)). These assays indicated that the extract was more cytotoxic to the tumor cell lines (40 µg mL−1) than to the normal cell line (50 µg mL−1). The calculated EC50 values were 56.16 µg mL−1 for normal cells (R 2 = 0.9794), 43.68 µg mL−1 for gastric tumor cells (R 2 = 0.9632), and 42.57 µg mL−1 for HepG2 cells (R 2 = 0.9568).
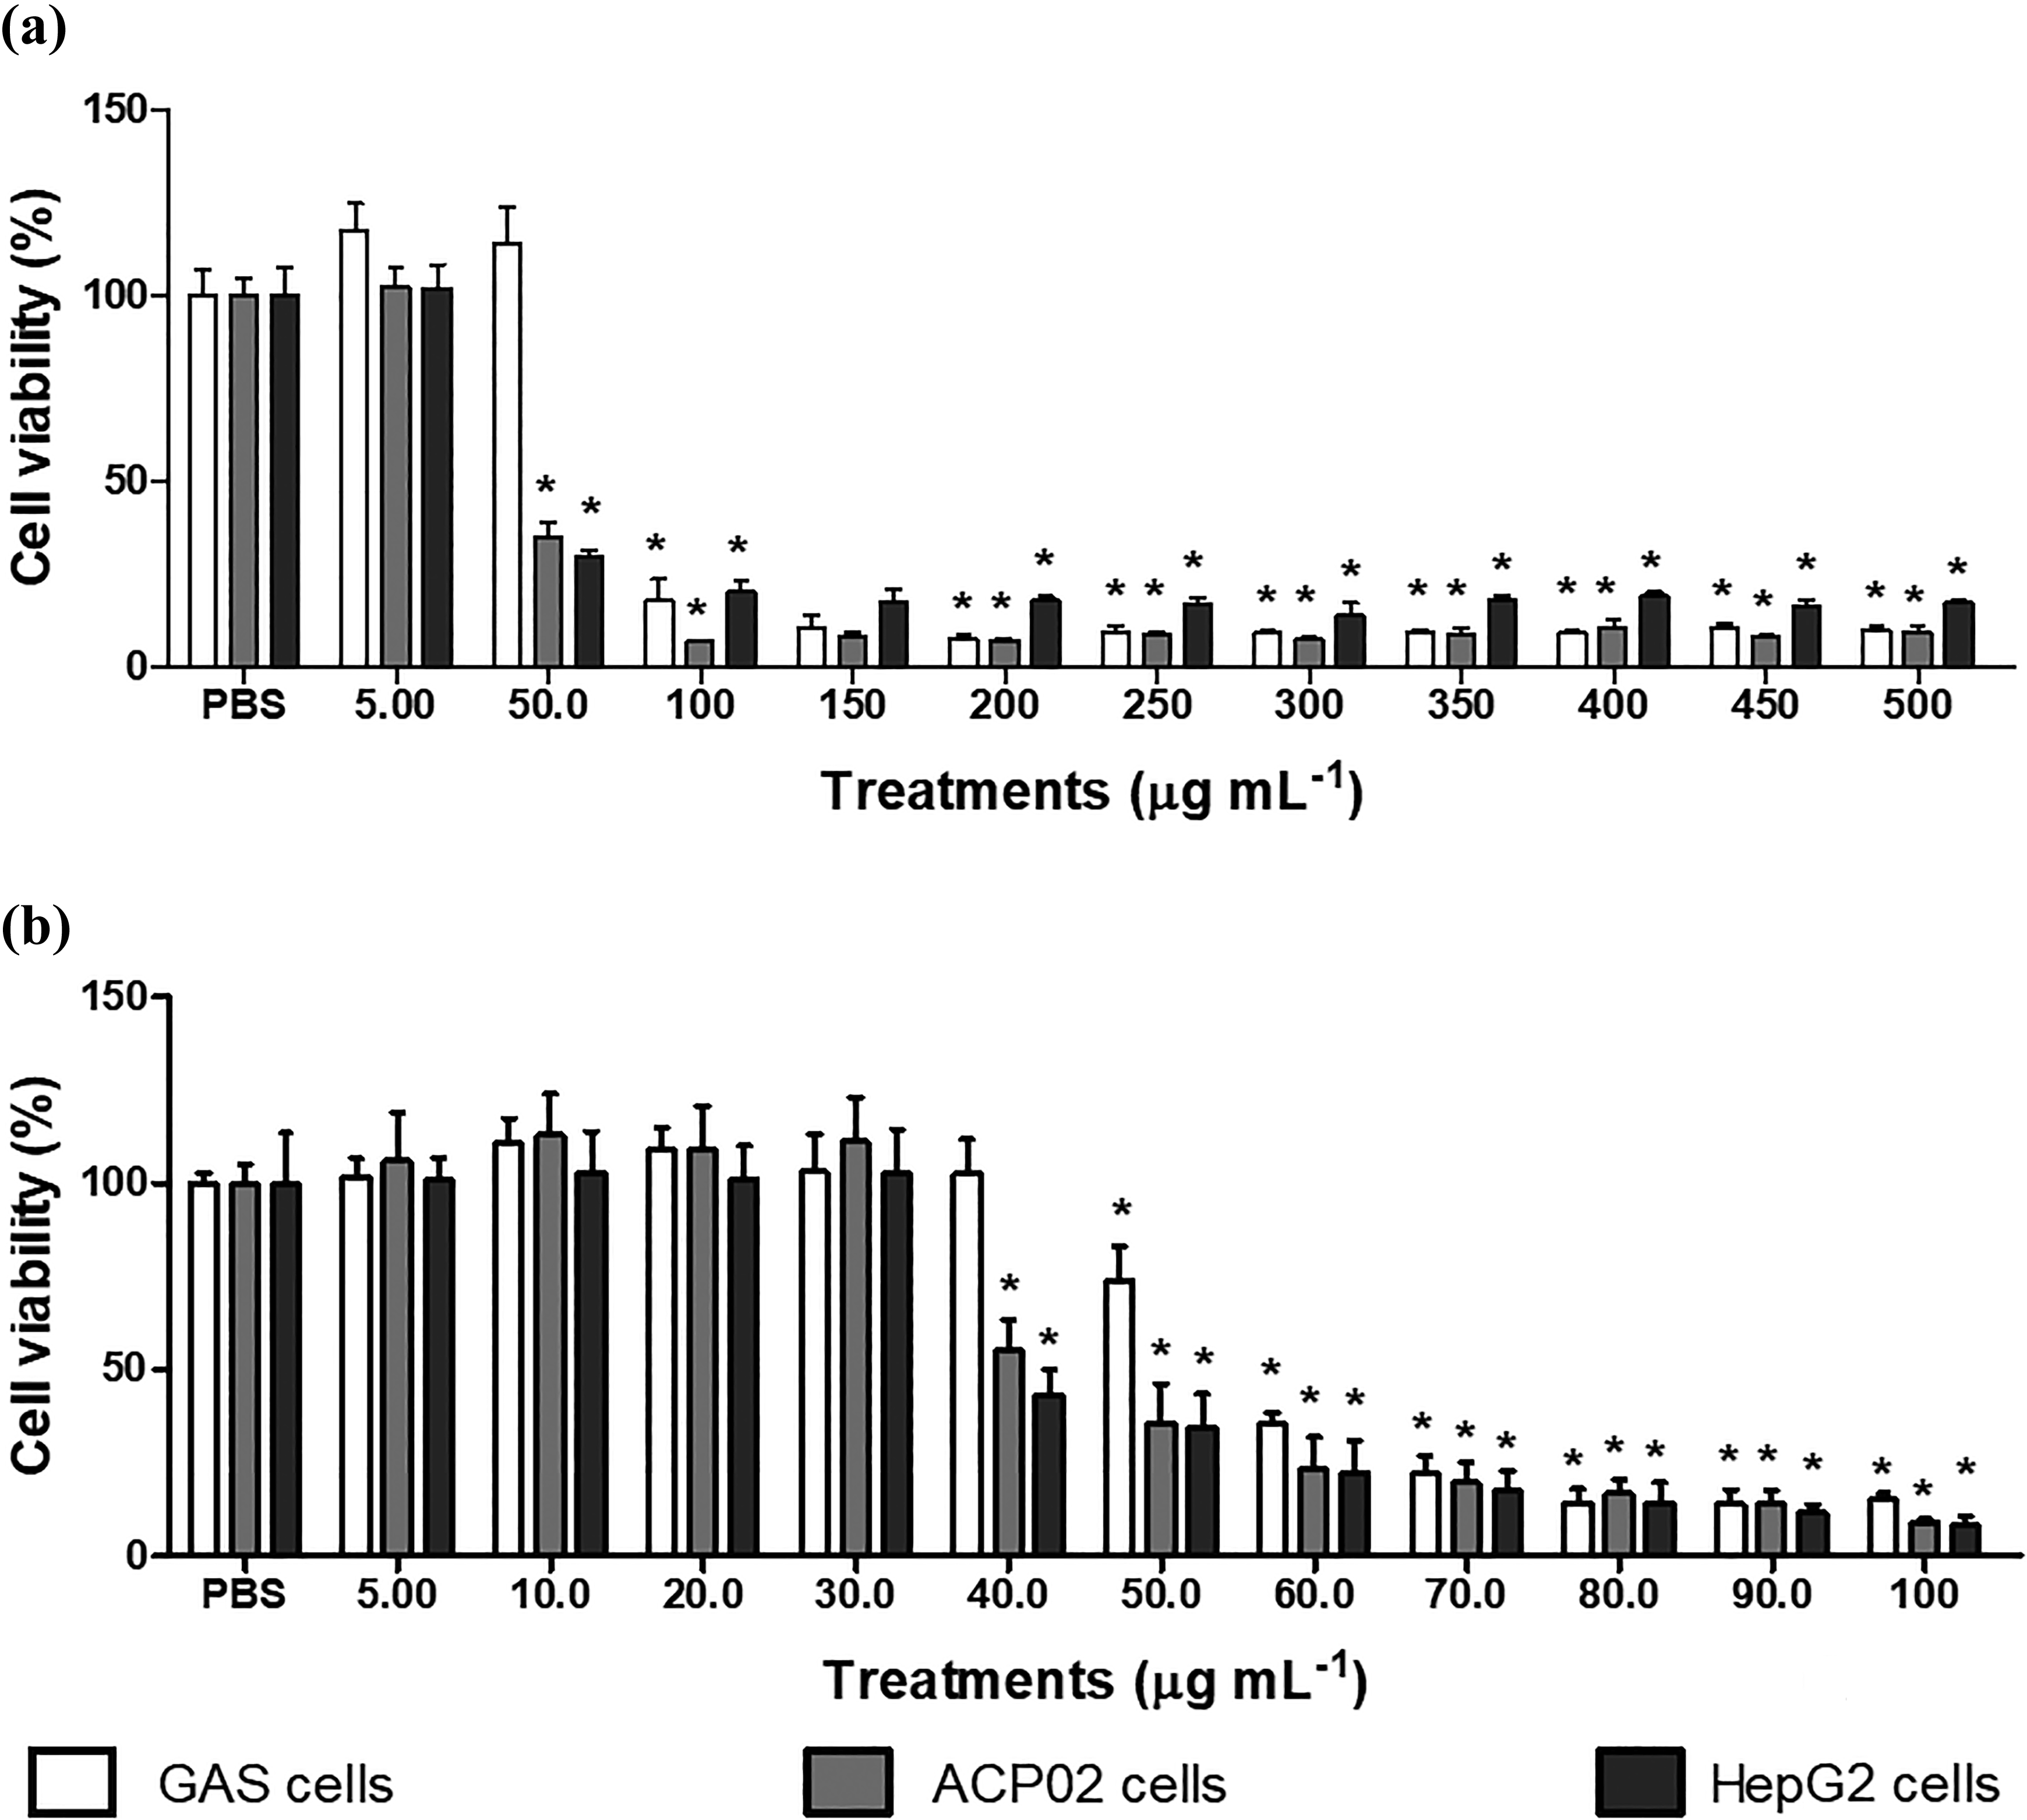
Percentage of viable normal, gastric tumor (ACP02), and hepatic cancer (HepG2) cells treated with different concentrations of FP extract ((a) 5.00–500 µg mL−1 and (b) 5.00–100 µg mL−1) by MTT assay, compared with vehicle (PBS) treated cells. Results represent the mean ± standard deviation of seven replicates. The vehicle control (PBS) represents 100% cell viability. *Significantly different from negative control, ANOVA followed by Tukey’s test (p ≤ 0.05). PBS: phosphate buffered saline; ANOVA: analysis of variance; FP: Fridericia platyphylla.
Similar results were obtained in the neutral red assay (Figure 2), where the FP extract decreased normal cell viability starting at 50 µg mL−1 and tumor cell viability starting at 40 µg mL−1. EC50 values were 69.38 µg mL−1 (R 2 = 0.9394) for normal cells, 41.73 µg mL-1 (R 2 = 0.9185) for gastric tumor cells and 52.39 µg mL−1 (R 2 = 0.9171) for HepG2 cells. Considering that no difference in cytotoxicity was observed for non-metabolizing (gastric) and metabolizing (HePG2) cells, we performed the following experiments only on gastric cell lines.
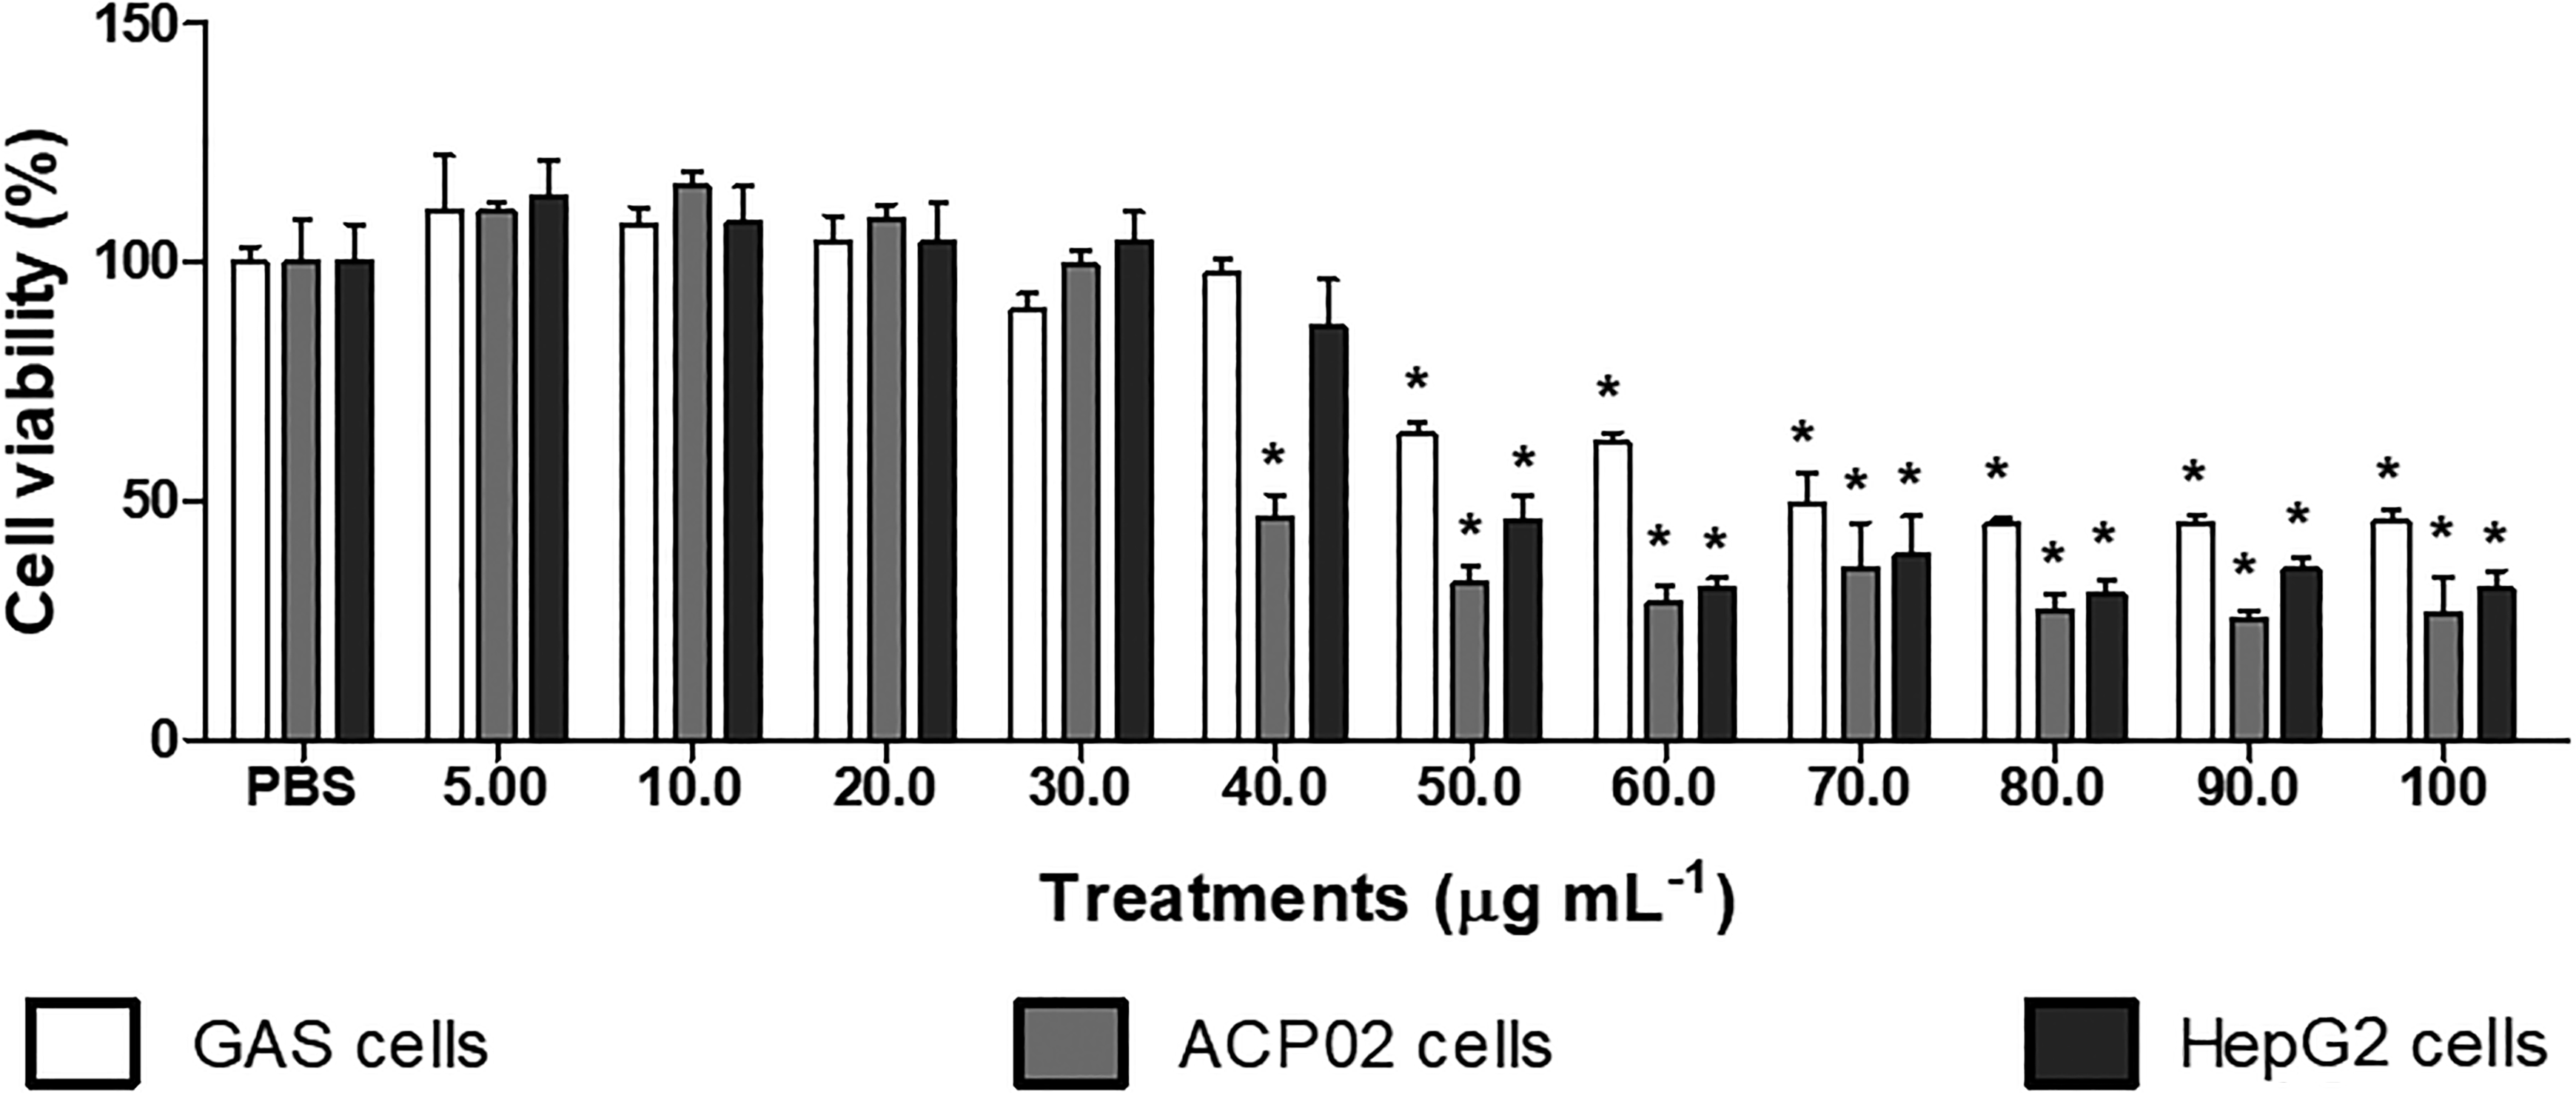
Percentage of viable normal, gastric tumor (ACP02), and hepatic cancer (HepG2) cells treated with different concentrations of FP extract (5.00–100 µg mL−1) by neutral red assay, compared with vehicle (PBS) treated cells. Results represent the mean ± standard deviation of seven replicates. The vehicle control represents 100% cell viability. *Significantly different from negative control, ANOVA followed by Tukey’s test (p ≤ 0.05). PBS: phosphate buffered saline; ANOVA: analysis of variance; FP: Fridericia platyphylla.
Interestingly, the LDH release assay yielded similar results for tumor cells, with a decrease in cell viability observed at 50 µg mL−1 FP extract. However, the cytotoxic effects of the extract were not observed toward normal cells below 100 µg mL−1 (Figure 3). Cells with damaged membranes release LDH into the extracellular medium, 15 making extracellular LDH activity a marker for cell death.
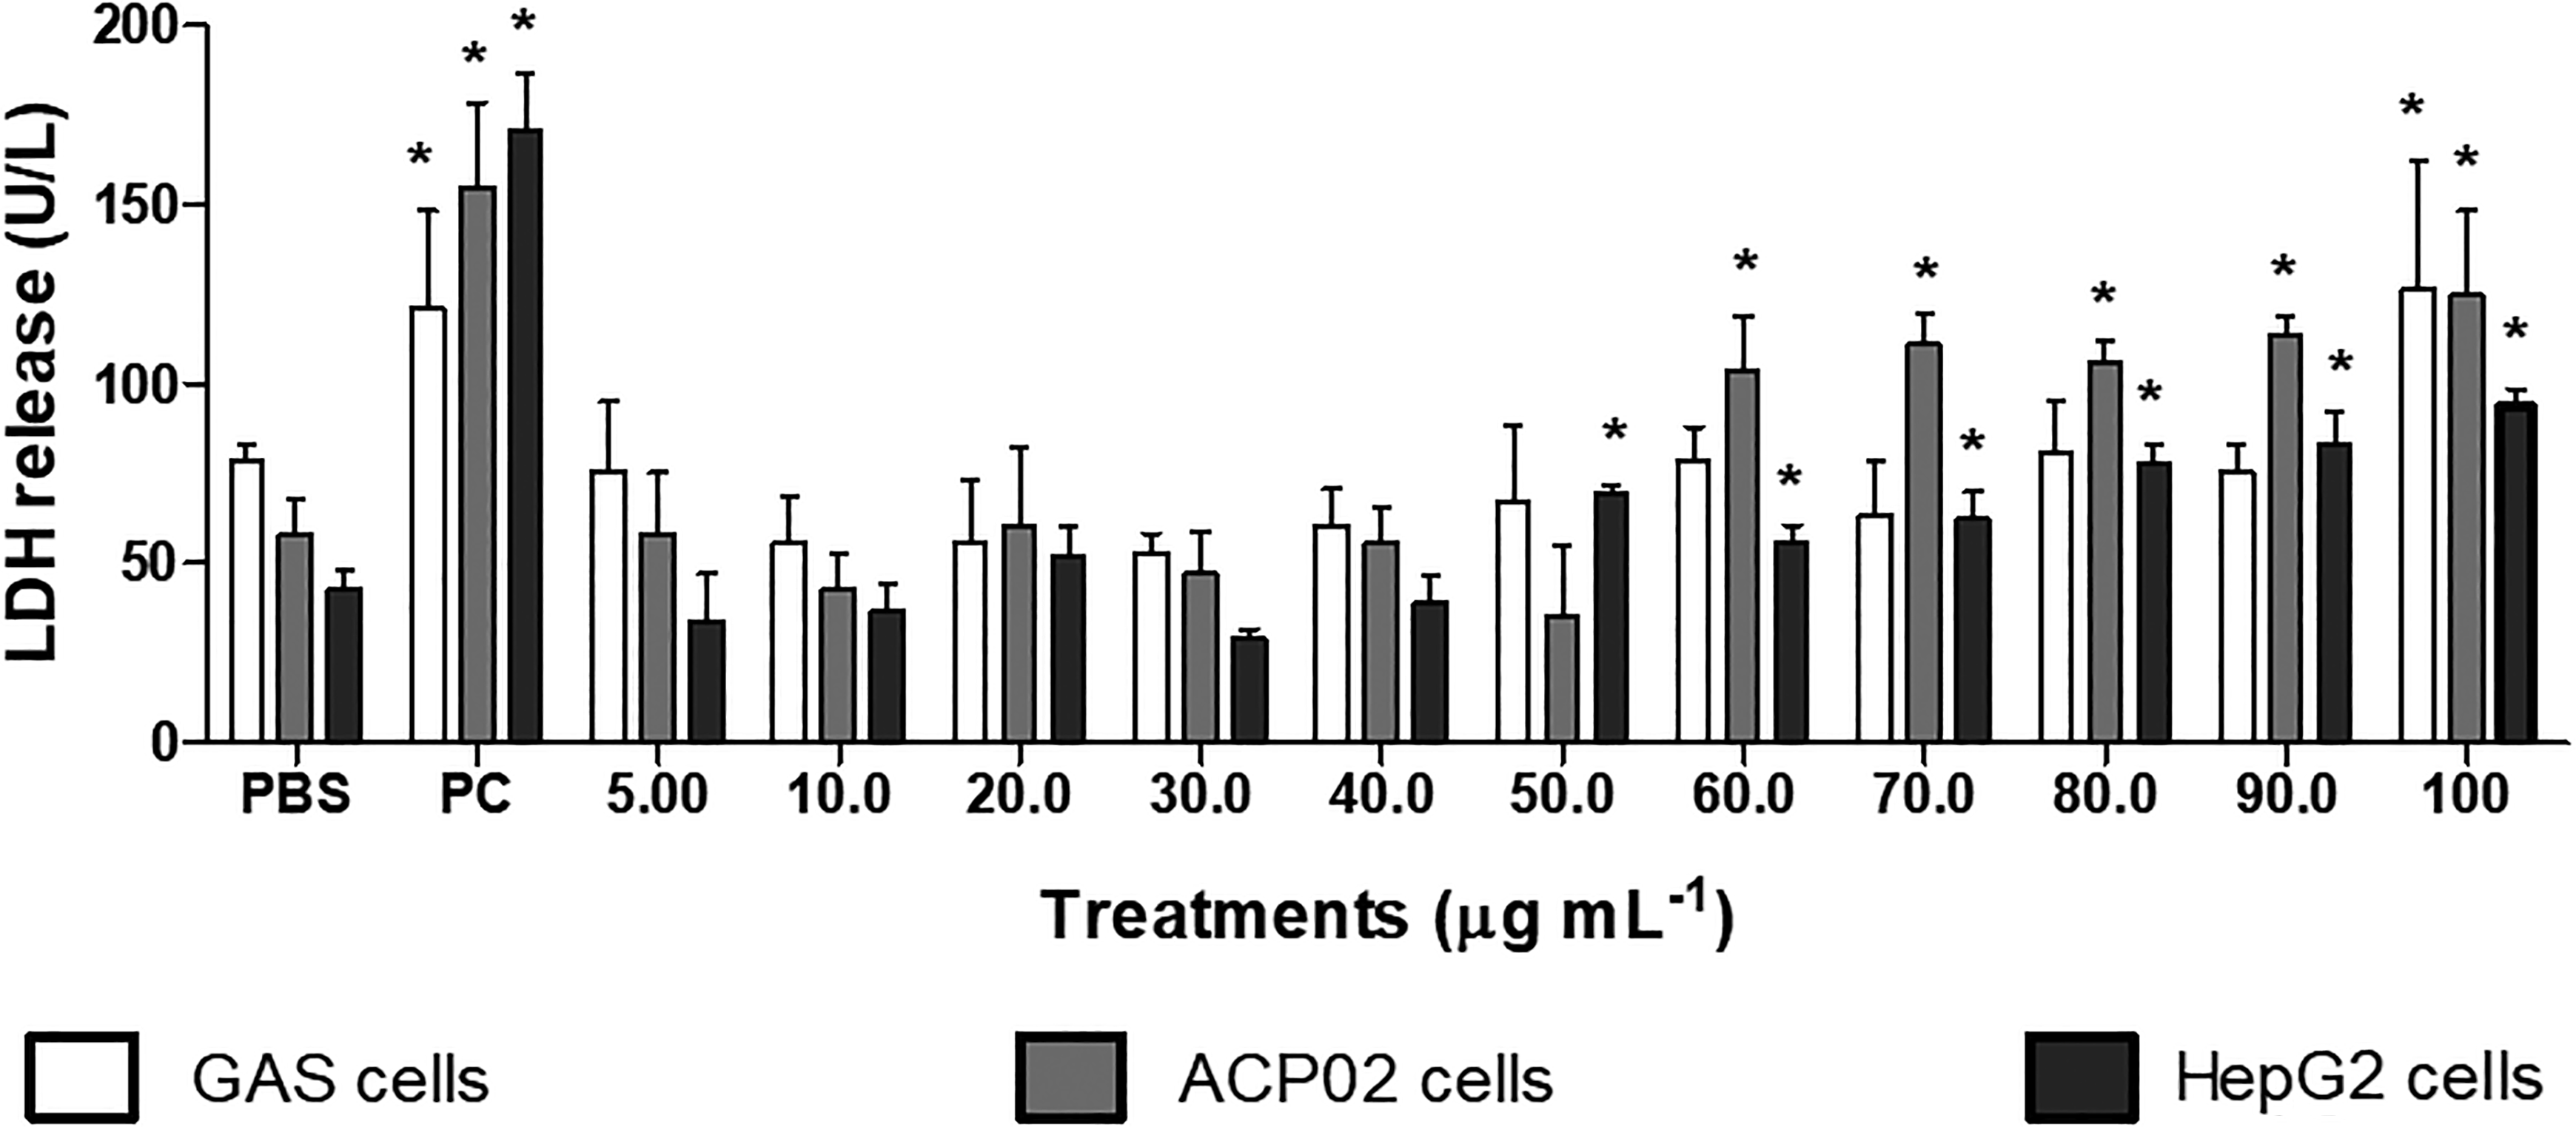
Lactate dehydrogenase activity of normal, gastric tumor (ACP02), and hepatic HepG2 cells treated with different concentrations of FP extract (5.00–100 µg mL−1) compared with vehicle (PBS) treated cells. Results represent the mean ± standard deviation of seven replicates. PC (1%, Triton 100×) *Significantly different from negative control. ANOVA followed by Tukey’s test (p ≤ 0.05). PBS: phosphate buffered saline; ANOVA: analysis of variance; FP: Fridericia platyphylla; PC: positive control.
To evaluate whether the FP extract induces cell death by apoptosis or necrosis, two additional tests were performed. In the AO/EB test, four concentrations of the extract were used. The two lower concentrations (5.0 and 30 µg mL−1) were non cytotoxic according to MTT assay, whereas the two higher concentrations (60 and 120 µg mL−1) were cytotoxic. As can be seen in Table 3, the two higher concentrations increased the frequency of necrosis among the gastric tumor cells. In both cell types, 120 µg mL−1 of FP extract induced such severe cytotoxicity that it was impossible to count cells after 3 h of treatment (data not shown).
Frequency of viable, apoptotic, and necrotic gastric tumor cells treated with FP extract at different concentrations (5.00, 30, and 60 μg mL−1) and their respective negative (PBS) and positive (DXR 0.2 μg mL−1) controls.a

PBS: phosphate buffered saline. DXR: doxorubicin (0.2 μg mL−1); ANOVA: analysis of variance; FP: Fridericia platyphylla.
a Cells were sampled at 1.0, 3.0, 6.0, 12, and 24 h after treatment.
b Significantly different from the negative control group (PBS), ANOVA, and Tukey’s test (p ≤ 0.05).
Data obtained by flow cytometry showed similar results (Figures 4(a) and (b) for normal and tumor cells, respectively) with more pronounced cytotoxicity in gastric tumor cells. The FP extract at 60 µg mL−1 induced cell death in both cell types mainly by necrosis, and at 30 µg mL−1, the extract induced necrosis only in tumor cells. DXR at 0.2 µg mL−1 induced cell death by necrosis and apoptosis in both cell types as was observed with cisplatin at 3.0 µg mL−1.

Frequency of viable, apoptotic (early and late apoptosis), and necrotic cells in cultures of (a) normal and (b) tumor gastric cells (ACP02) treated with FP extract (AB) (5.0, 30, or 60 µg mL−1), vehicle (PBS), or positive controls (0.2 µg mL−1 DXR or 3 µg mL−1 cDDP). *Statistically different from negative control group (PBS) relative to viable, % apoptotic and +necrotic cells. ANOVA followed by Tukey’s test (p≤0.05). PBS: phosphate buffered saline; DXR: doxorubicin, cDDP: cisplatin; ANOVA: analysis of variance; FP: Fridericia platyphylla.
Cytostatic effects of FP
Cell proliferation curves generated based on cell counting and protein content estimation in normal (Figures 5(a) and (b)) and tumor gastric cells (Figures 5(c) and (d)) showed that even a cytotoxic concentration of FP extract (60 µg mL−1) did not reduce cell growth. However, an antiproliferative effect was observed in both cell lines with a noncytotoxic concentration of DXR by both methods of analysis. The FP extract at 30 µg mL−1 caused a subtle reduction in NDI values. This reduction was most evident in tumor cells (Table 4).
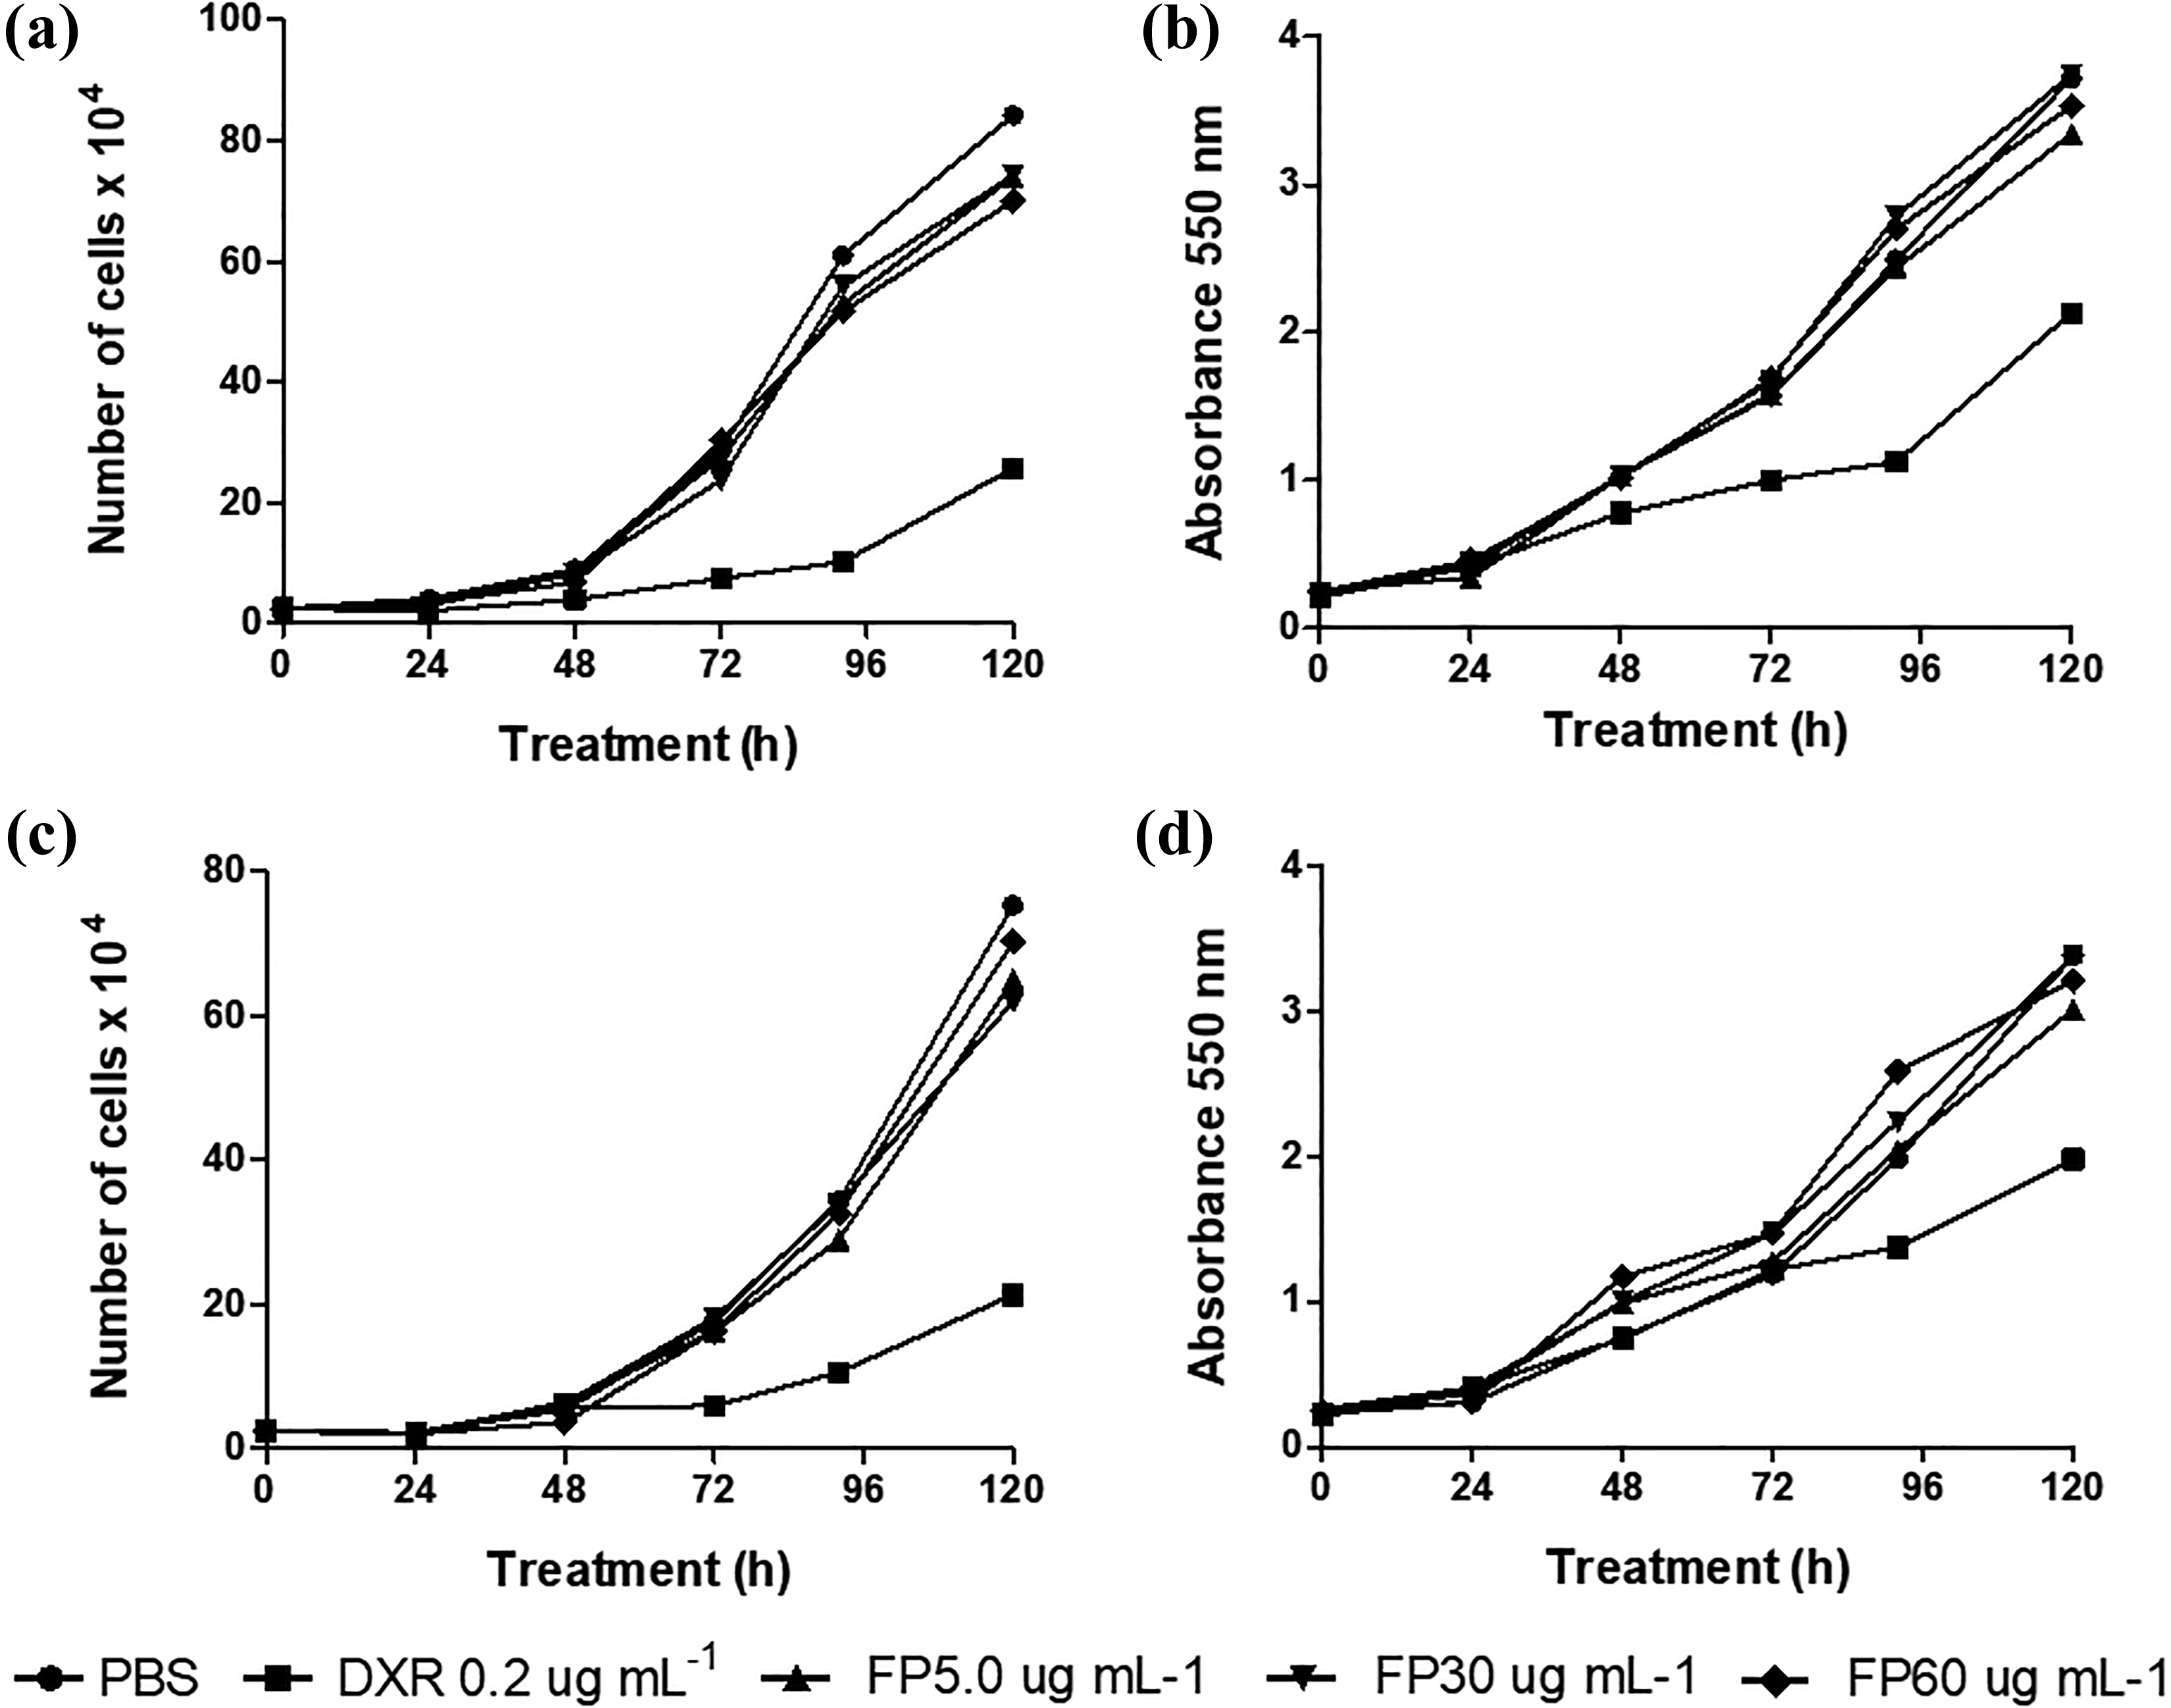
Proliferation curves of normal (a and b) and tumor (ACP02) (c and d) gastric cells based on cell counts (a and c) and total protein content (b and d) after treatment with FP extract (AB) compared to vehicle (PBS) and positive control (DXR 0.2 µg mL−1) treated cells. PBS: phosphate buffered saline; DXR: doxorubicin; FP: Fridericia platyphylla.
Frequency of MNis, NBUDs, and NPBs, percentage of BN, and NDI in normal and tumor gastric cells treated with different concentrations of FP.a

BS: phosphate buffered saline; DXR: doxorubicin (0.2 μg mL−1); ANOVA: analysis of variance; MNis: micronuclei; NDI: nuclear division index; NBUD: nuclear bud; NPB: nucleoplasmatic bridge; BN: binucleated cell; FP: Fridericia platyphylla.
a A total of 3000 binucleated cells were analyzed per group for all parameters except NDI (1500 cells per group). NDI = [N1 + 2(N2) + 3(N3) + 4(N4)]/N). N1–N4 = number of cells with 1, 2, 3 or 4 nuclei; N: total of cells analyzed. The data represent the mean ± standard deviation of three independent experiments.
b Significantly different from the negative control group (p ≤ 0.05).
The subG1 cell population reached 75% and 80% after 24 h of treatment with 60 µg mL−1 of the FP extract in normal and tumor cell lines, respectively. Interestingly, 30 µg mL−1 of the FP extract only increased the subG1 population (35%) in tumor cells. Treatment with DXR induced G2/M arrest only in normal cells (Figure 6).

Frequency of cells in subG1, G1, S, and G2/M phases in cultures of (a) normal and (b) gastric tumor cells (ACP02) treated with FP extract (AB). Equal signs indicate statistical difference from vehicle (PBS) control for a given cell type. SubG1(*), S(#), G1($), and G2/M(%). ANOVA followed by Tukey’s test (p ≤ 0.05). PBS: phosphate buffered saline; DXR: doxorubicin (0.2 μg mL−1); ANOVA: analysis of variance; FP: Fridericia platyphylla.
CBMN-cyt
Quantitative analysis of MNis, NPBs, and NBUDs in binucleated cells (Table 4) showed that none of the three concentrations of the FP extract changed the frequency of these parameters in normal cells. However, a selectively mutagenic effect was observed in the form of an increase in NBUD frequency in tumor (ACP02) cells.
Intracellular ROS levels
The CM-H2DCDA probe revealed that the FP extract, at the concentrations evaluated (5.0, 30, and 60 µg mL−1), did not change intracellular levels of ROS (Figure 7) suggesting that the cell death induced at high concentrations of the extract and the increase in NBUD frequency were not triggered by increased intracellular ROS levels.
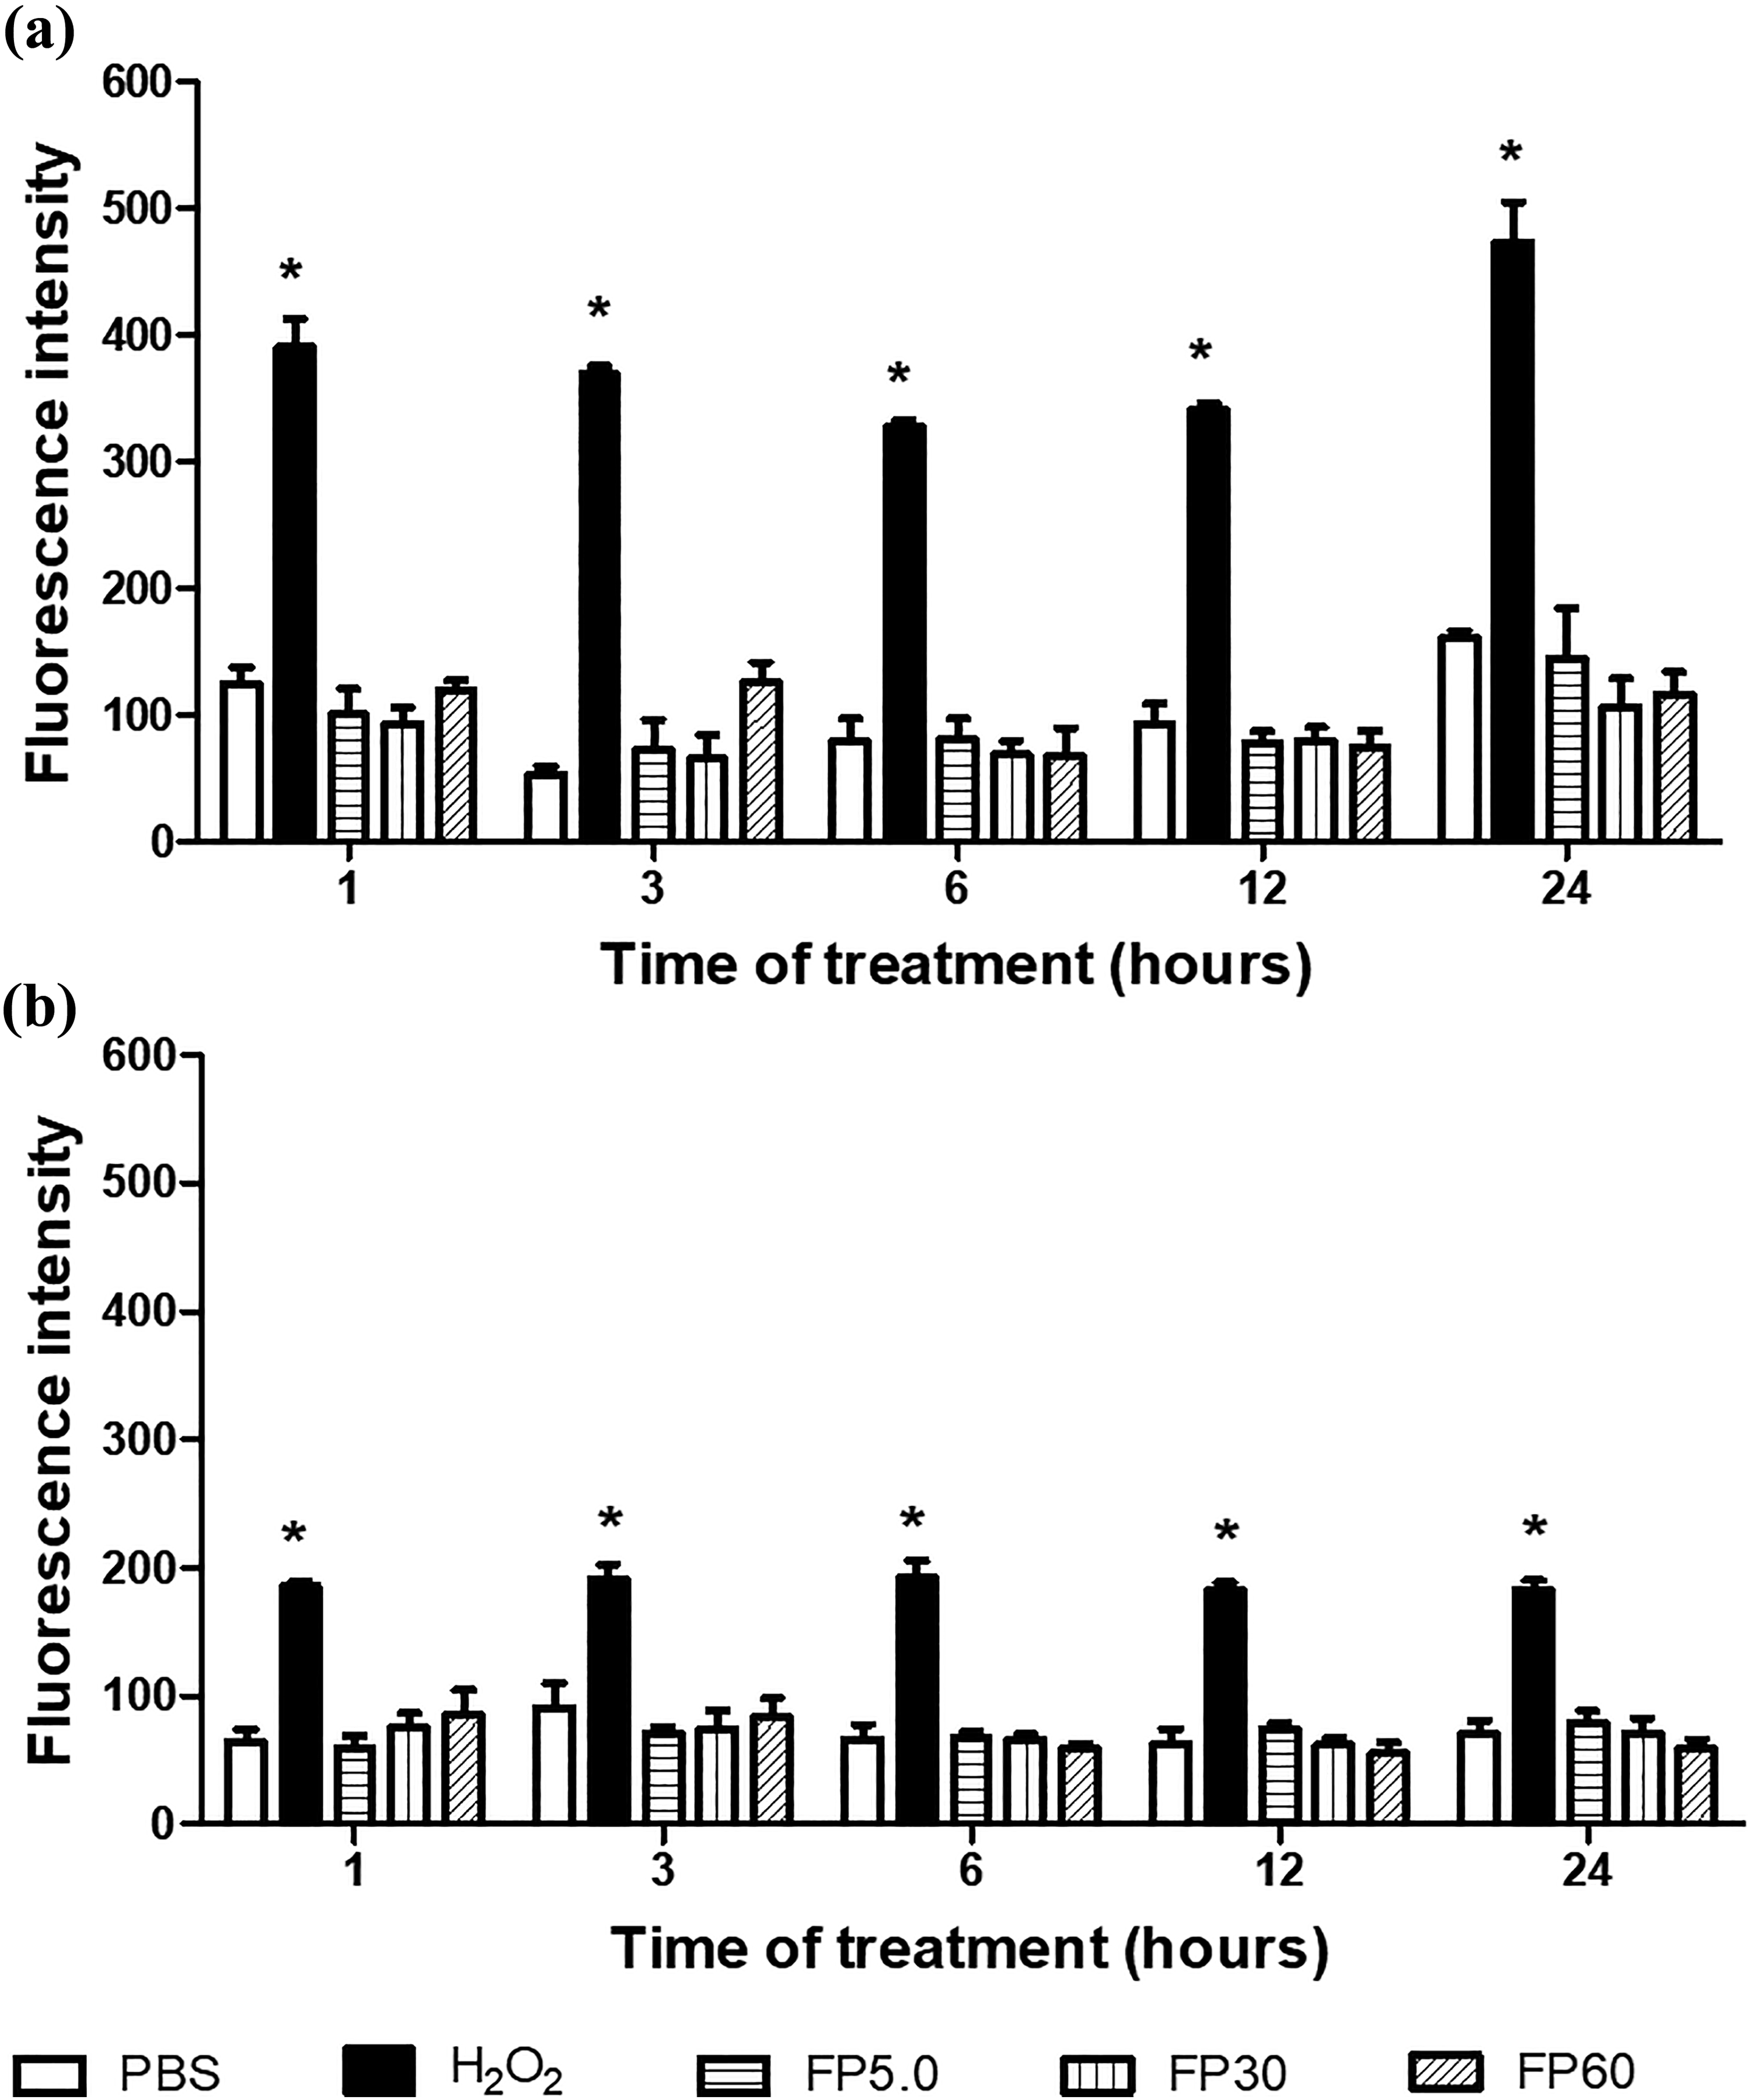
Spectrofluorimetric measurements of ROS levels in (a) normal and (b) gastric tumor cells (ACP02) with different concentrations of FP extract, vehicle (PBS), or 1 mM H2O2 (positive control) at different sampling time points (1.0, 3.0, 6.0, 12, or 24 h). *Significantly different from negative control (p ≤ 0.05). #Significantly different from positive control. ANOVA followed by Tukey’s test (p ≤ 0.05). PBS: phosphate buffered saline, H2O2: hydrogen peroxide (1 mM); ANOVA: analysis of variance; ROS: reactive oxygen species; FP: Fridericia platyphylla.
Gene expression
Finally, we analyzed gene expression using real-time quantitative polymerase chain reaction (RT-qPCR) (Figure 8) in normal (Figure 8a) and tumor cells (Figure 8b). In normal cells, the positive control (0.2 μg mL−1 DXR) and 60 µg mL−1 of FP upregulated CCND1 by approximately twofold and fourfold, respectively. In tumor cells, the expression levels of the antiapoptotic genes BCL-XL and BIRC5 and a gene related to the cell cycle, MET, were downregulated by 5.0 and 30 µg mL−1 of FP (approximately twofold), respectively. TP53 was downregulated only by 30 µg mL−1 of FP (approximately twofold).
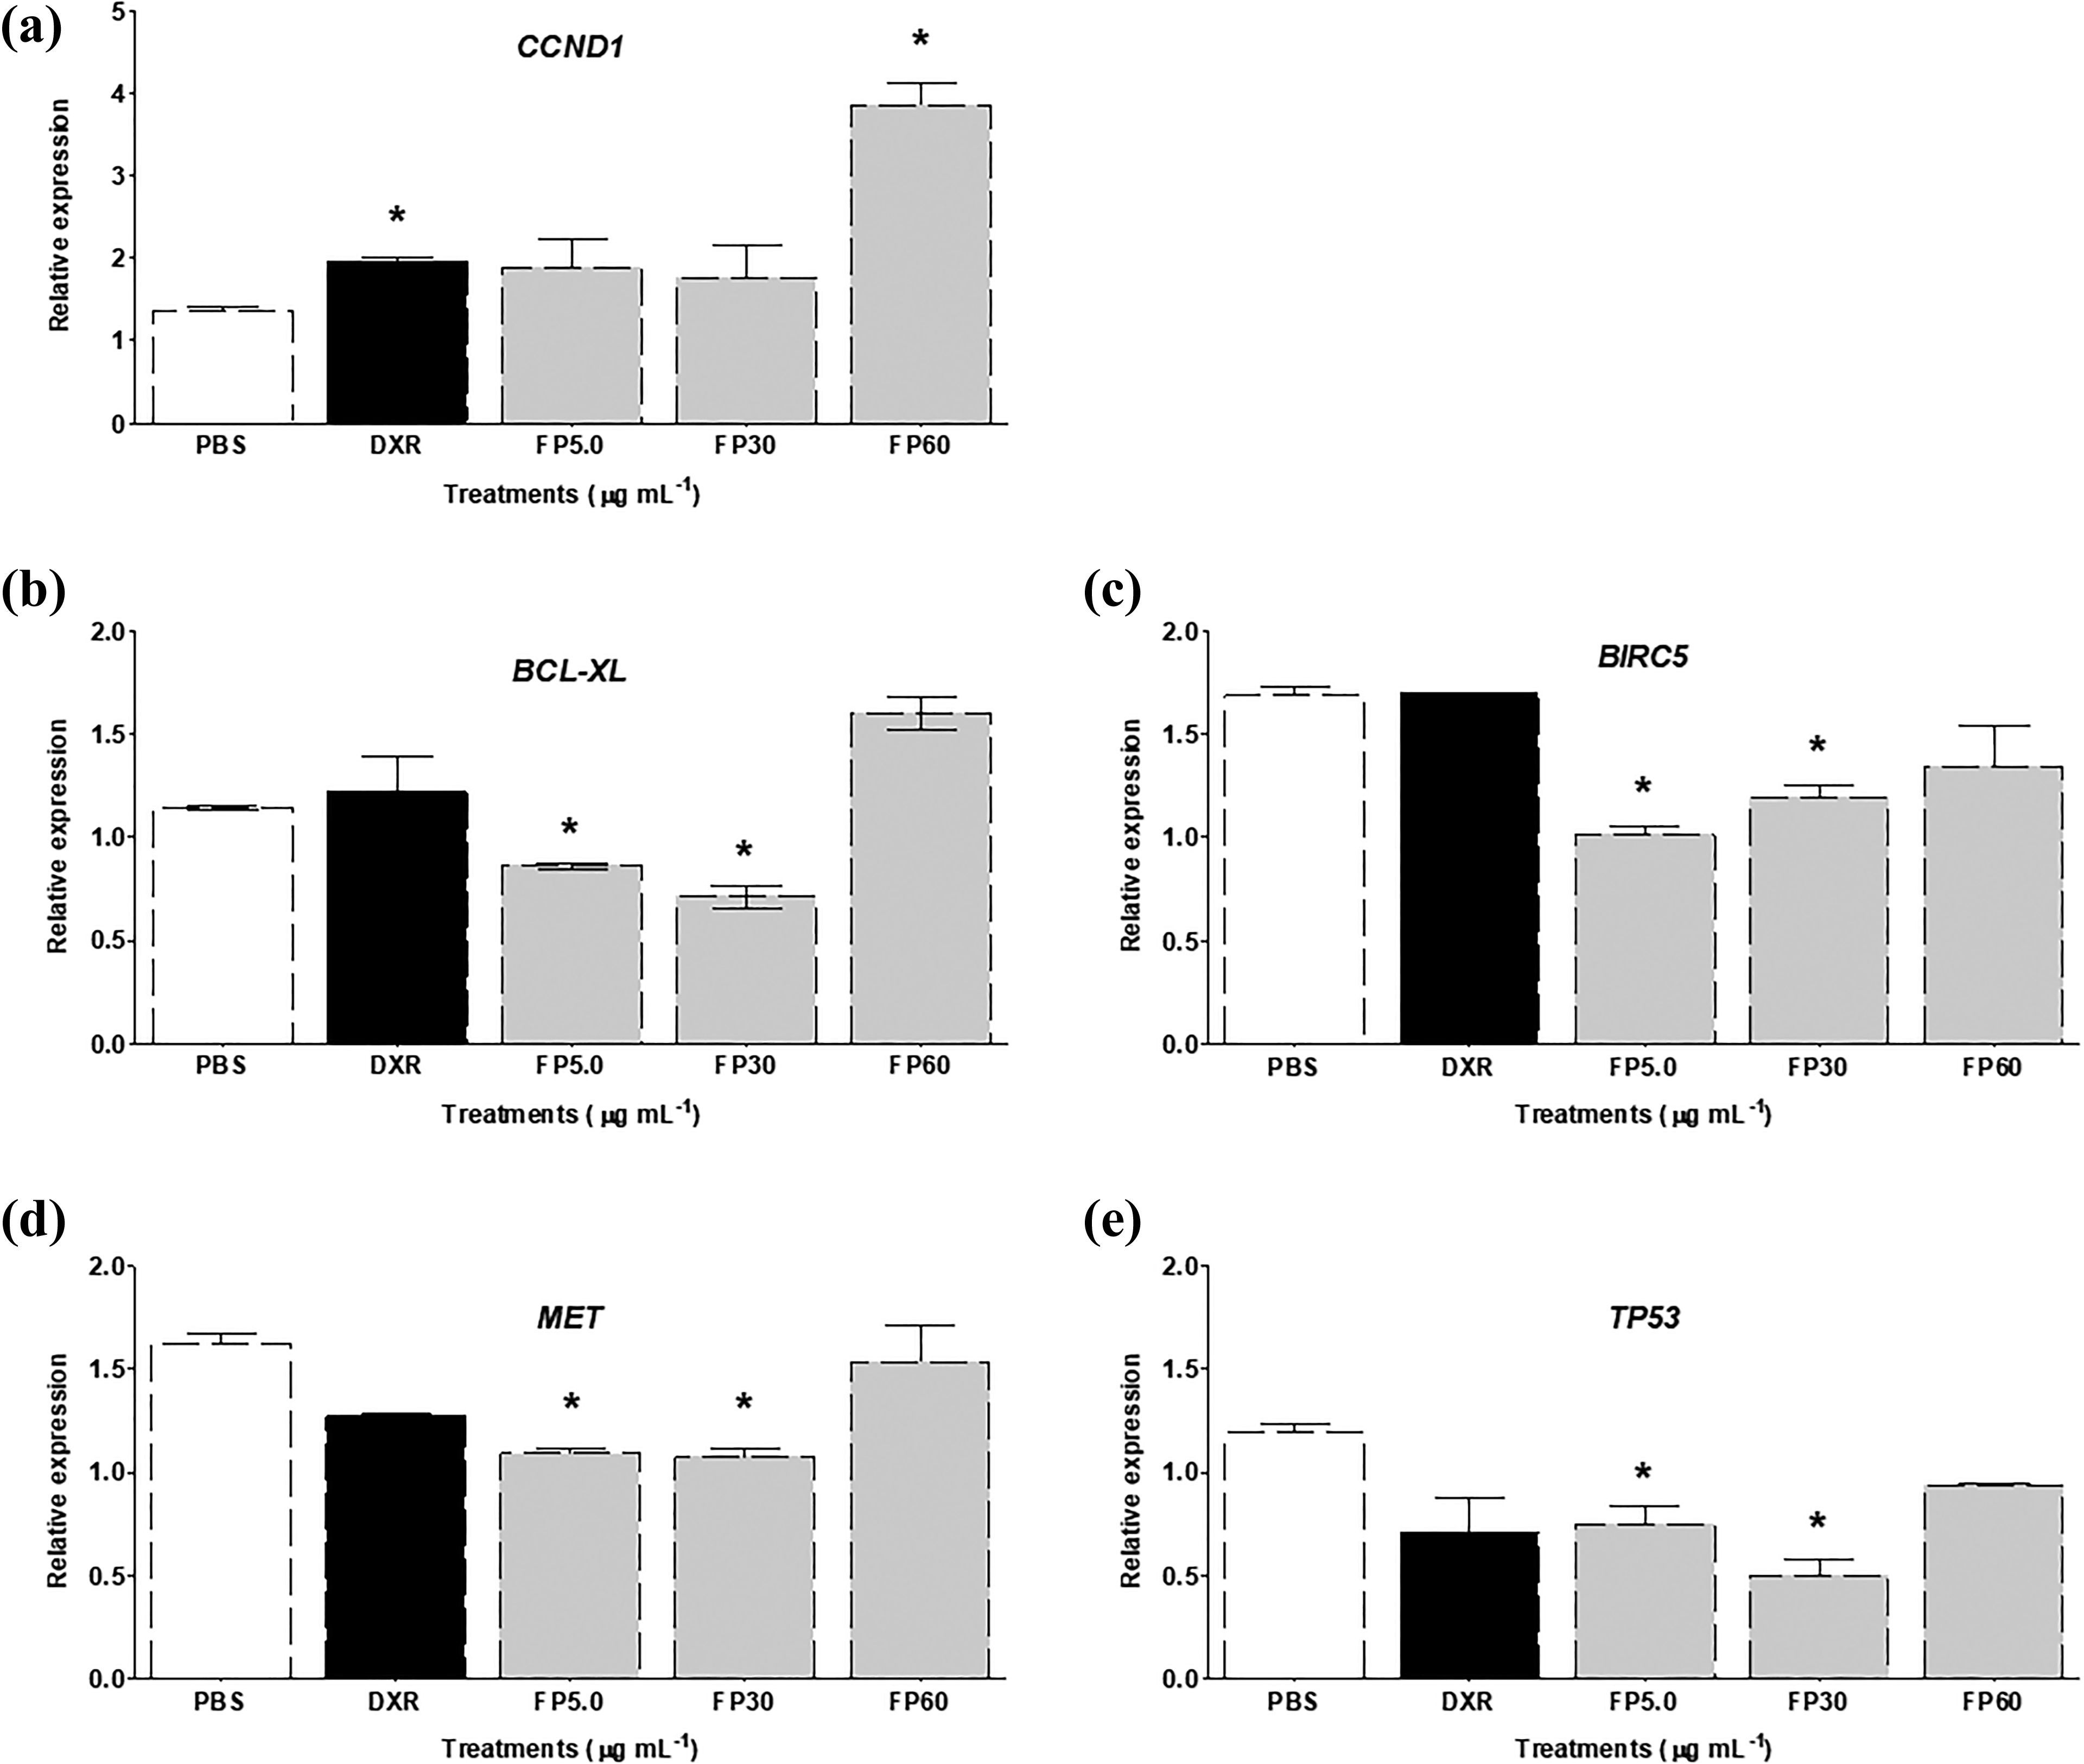
Expression of genes involved in the cell cycle and in apoptosis in normal (a) and tumor (ACP02) (b, c, d, and e) gastric cells after treatment with different concentrations of FP extract. The results are presented as expression levels relative to vehicle (PBS) controls. *Significantly different from negative control (PBS), Student’s t-test (p ≤ 0.05). PBS: phosphate buffered saline; DXR: doxorubicin (0.2 µg mL−1); FP: Fridericia platyphylla.
Discussion
Natural products are receiving increasing attention in both developing and industrialized nations, because of the harmful effects of exposure to synthetic additives. 23 Jain et al. 24 described how herbal medicines are now attracting attention as potential sources of anticancer agents due to good availability of the source material, affordability, and little or no side effects. The same authors reviewed medicinal plants with anticancer potential and highlighted more than 60 plant extracts possessing cytotoxic activities with different underlying mechanisms.
Anticancer drugs may exert their cytotoxic activities by different mechanisms of action, including DNA interaction, antimetabolite activity, and interference with tubulin functions. 25 Experimental methods to evaluate cytotoxicity are continuously being developed and improved; however, all the existing methods have their own drawbacks. 26 For this reason, the present study evaluated different cellular targets: electron transport chain activity (MTT), membrane integrity (LDH), and lysosomal activity (neutral red). 15 The relevant cytotoxicity of FP extract was also evaluated in the HepG2 hepatic cell line, which has drug metabolizing activity. 27,28 The activity of the components of FP extract apparently does not depend on cellular metabolism. The FP extract was slightly more cytotoxic in both tumor cell lines than in normal gastric cells, showing desirable selectivity for an anticancer agent.
In the cell death assays (AO/EB and flow cytometry), 30 µg mL−1 of the FP extracts caused necrosis in tumor cells, while 60 µg mL−1 of the extract was required to increase necrosis in normal gastric cells. These data highlight the selective cytotoxicity of 30 µg mL−1 of the FP extract and indicate that the primary mechanism of cell death is necrosis. These conclusions were confirmed by flow cytometry.
Phytochemical studies indicate that FP is a source of novel dimeric flavonoids. 7 The results of LC-ESI-IT-MS/MS and FIA-ESI-IT-MSn of hydroalcoholic extracts from the roots of FP identified a family of 10 known compounds (brachydin A-J). Two dimeric flavonoids isolated from FP extract, brachydin B and C, were cytotoxic, with IC values of 6.0 μM and 6.8 μM in trypomastigotes and 15.6 and 17.3 μM in murine macrophages, respectively. 9 Cytotoxicity toward trypomastigotes was also reported for compounds isolated from FP. 29
Doxorubicin cytotoxicity is due to DNA intercalation, free radical formation, and inhibition of topoisomerase II activity, which activates apoptotic pathways, making doxorubicin a first-line treatment for a wide range of cancers, including gastric cancer. 30 The cytotoxicity of classical platinum agents is due to their ability to inhibit DNA and RNA synthesis and the inability of cells to sense and repair platinum-induced lesions. 31 According to flow cytometry data, the level of cytotoxicity of FP falls between those of these two chemotherapeutic drugs.
Precise control of initiation and progression through the cell cycle is extremely important to cell proliferation. 32 The cell proliferation curves showed that 60 µg mL−1 of FP extract had no effect, in agreement with LDH assay results. However, 30 µg mL−1 of the FP extract decreased the % BN and the NDI values. Flow cytometry was used to further investigate these results, and 30 µg mL−11 of the FP extract selectively increased the subG1 population in tumor cells, indicative of apoptotic DNA fragmentation. This suggests that the observed growth inhibition by the FP extract was mediated by cell death rather than by cycle arrest.
The cell cycle kinetic data were able to distinguish between normal and tumor cells and predict the risk of tumor recurrence. 33 DNA damage checkpoints are regulated by p53, and its loss is the most common genetic defect in cancer, affecting several cell decisions including apoptosis. 34 In our results, DXR induced cell cycle arrest at G2/M only in normal gastric cells, indicating that FP-induced cell death is not solely due to p53, since ACP02 cells did not present alterations in cell kinetics and checkpoints (probably due to the absence of both functional copies of the TP53 gene).
Calgano et al. 35 demonstrated by conventional cytogenetic analysis that 21.2% (7/33) of samples of gastric tumor cells obtained by patient biopsy contained only one copy of TP53. In ACP02 cells, the number of TP53 copies was undetermined. Leal et al. 36 also showed that in ACP02, the most common alteration observed was the loss of one copy of TP53. This result is corroborated by our assessment of gene expression that showed TP53 amplification in ACP02 cells, indicating that at least one copy of the gene was still present in this cell line, at least in some cells within a culture.
Cancer therapies rely on the ability of chemotherapeutic drugs to cause death or profound damage in malignant cells. The formation of MNis in cancer cells being tested for a new treatment indicates the activity and specificity of the tested therapy. 37 A selectively DNA damaging effect was inferred by an increase in NBUD frequency only in tumor cells when treated with 30 µg mL−1 of the FP extract. MNis and NBUDs are nuclear anomalies mainly observed in postmitotic lymphocytes in vivo in the peripheral blood. 38 NBUDs are similar to MNis, 39 except for their greater nuclear proximity and physical connection to the nucleus through a narrow cytoplasmic passage. MNis are formed in response to lagging chromosomes or chromosome fragments 40 and NBUDs occur as a result of elimination of amplified DNA through breakage-fusion-bridge cycles or elimination of excess chromosomes in polyploid cells. 41 Previously, mutagenic activity was reported for the same FP extract in Salmonella typhimurium strains TA98, TA97a, TA100, and TA102 with and without metabolic activation. 42 This test detects point mutations, compared with chromosome aberrations detected by CBMN-cyt, and can provide results that reinforce the mutagenic activity of the extract.
When proliferating mammalian cells undergo DNA damage, they initiate cell cycle arrest to complete repair of the DNA damage before continuing with cellular division. 43 Greenwood et al. 44 showed that levels of induced aberrations were higher in p53 mutant cells due to failure to remove damaged cells by apoptosis. This point is also highlighted in the present study in which the FP extract induced cell death by necrosis, independent of the p53 pathway.
Besides functioning in cell cycle checkpoints, DNA repair, and cell death, p53 protein also protects cells against oxidative stress under physiological and mild stress conditions. CM-H2DCFDA is widely used as a hydrogen peroxide (H2O2) specific probe. 45 It may also detect hydroxyl radicals, carbonate radicals, and nitrogen dioxide. 46 ROS are known to cause DNA lesions, including base modifications, single- and double-strand breaks, and interstrand cross-links. 47 Under the conditions evaluated in the present study, no alterations in redox status were observed, demonstrating that mutagenic and cytotoxic effects probably were not related to oxidative stress. Chronic oxidative stress is a causative factor in multiple gastric diseases. At this point, we can conclude that the FP extract made no apparent contribution to the development of these diseases. In fact, the extract has been reported to be gastroprotective at various previously evaluated concentrations. 7
Gene expression analysis confirmed the selectivity of the FP extract in inducing cell death and antiproliferative effects preferentially in gastric tumor cells. In normal cells, altered gene expression was observed only for CCND1. CCND1 is a proto-oncogene involved in G1/S transition that is frequently deregulated in cancer. Its ability to activate CDKs is its main mechanism of oncogenic activity. 48 Overexpression of CCND1 tends to cause a rapid transition from G1 phase to S phase in normal fibroblasts, 49 corroborated by our cell cycle kinetic results, where only normal cells treated with DXR showed decreased G1 population. This increase in expression of CCND1 after DXR treatment was also demonstrated in HL-60 tumor cells. 50 Fraczkowska et al. 51 concluded that DXR interacts not only with proliferating cancer cells but also with healthy cells. This fact may explain the high toxicity of the drug at therapeutic concentrations and also encourages continued search for less toxic chemotherapeutics.
BCL-XL is frequently overexpressed, in comparison with that in normal tissue, in a significant number of common cancers. One of the primary means by which melanoma cells evade apoptosis induced by different stimuli is by upregulation of antiapoptotic proteins, including BCL-XL. 52 Recent studies have also demonstrated that this protein plays a role in cell death by necrosis. 53 Our results showed that, in gastric tumor cells, treatments with 5.0 or 30 µg mL−1 of the FP extract reduced BCL-XL expression, confirming that the extract could direct the cells to initiate cell death. BCL-XL overexpression also promotes some tumor progression-associated properties, including migration and invasion, maintenance of cancer stem cell phenotype, and vasculogenesis. 52 FP extract could also act in these pathways.
Five and 30 µg mL−1 of the FP extract also decreased survivin and MET expression. Gastric cancer cells avoid cell death by BIRC5 or survivin overexpression. 54 BIRC5 protein is expressed in embryonic tissues, and overexpressed in different types of cancer, such as gastric cancer, but is undetectable in normal adult tissues. 55 This tumor cell-specific expression makes it a strong candidate for development of survivin-based cancer therapeutics. 56 MET plays key roles in tumor survival, growth, angiogenesis, and metastasis, 57 and many inhibitors of RTKs have been investigated to identify potential targets for treatment of gastric cancer. 58 MET overexpression is linked to poor survival in advanced gastric carcinomas. 59
Taken together, the results of the present study demonstrate that crude extracts of FP roots display a trend to selective cytotoxicity toward tumor cells, mainly attributed to induction of necrosis, and decreased expression of genes involved in apoptosis (BCL-XL and BIRC5) and cell cycle (MET). However, cell analysis from different types of tumors has to be performed to provide more conclusive results. These results indicate that this medicinal plant and its secondary metabolites (dimeric flavonoids and glycosides derivatives) should be explored more actively for cytotoxic activities that could serve as novel chemotherapeutics. This study represents the first mechanistic study of the cytotoxic and antiproliferative effects of FP extract. Our results also highlight that even phytotherapies may present adverse effects and should be used with caution for ethnopharmacological purposes.
Footnotes
Acknowledgments
We are grateful to Katiuska Tuttis Rodrigues (Universidade Estadual de Londrina) for her technical assistance. We are also grateful to Prof. Dr. Lusânia Maria Greggi Antunes (FCFRP/USP) and Prof. Dr. Elza Tiemi Sakamoto Hojo (FFCLRP/USP) for providing support in their laboratories for flow cytometry analyses.
Declaration of conflicting interests
The author(s) declared no potential conflicts of interest with respect to the research, authorship, and/or publication of this article.
Funding
The author(s) disclosed receipt of the following financial support for the research, authorship, and/or publication of this article: This work was supported by São Paulo Research Foundation (FAPESP) (Grant Numbers 2009/52237-9 and 2012/01996-0) and the Foundation for Scientific and Technological Research and Development of Maranhão (FAPEMA) (Grant 00863/16).