
Abstract
Background:
A method is proposed as follows to establish the ultra-performance liquid chromatography quadrupole time-of-flight mass spectrometry (UPLC-QTOF-MS) fingerprinting and content determination for Fritillaria przewalskii Maxim. (FPM).
Materials and Methods:
The separation was developed using an Acquity UPLC CSH C18 column (2.1 mm × 100 mm, 1.7 µm). The gradient elution was carried out with acetonitrile solution with 0.1% acetic acid (containing 0.01 mol L−1 ammonium acetate) as the mobile phase, with the flow rate of 0.4 mL min−1, column temperature of 30°C, and injection volume of 2 µL. Fourteen batches of samples were analyzed under the above chromatographic conditions to ascertain the fingerprint of FPM sourced in different areas. A total of 45 common peaks were selected for analysis. Two chromatographic peaks were identified by comparison with the standard compound, and simultaneous content determination of the two compounds was carried out. These two compounds were identified as two alkaloids, peiminine and peimisine. SPSS 25.0 and SIMCA 14.1 were used for cluster analysis (CA), principal component analysis (PCA), and orthogonal partial least squares discriminant analysis (OPLS-DA) on the peak area of the 45 common peaks of FPM.
Results:
Results from this showed that samples sourced from different regions could be successfully divided into three groups based on their origin. The contents of peiminine and peimisine in different batches of FPM ranged from 57.92 to 76.01 µg/g and 118.12 to 167.39 µg/g. A quick and convenient identification using UPLC fingerprinting combined with PCA was then established to differentiate among FPM samples from different growing regions.
Conclusion:
This method may prove to be helpful for the quality evaluation and control of FPM and related medicinal plants in the future.
Introduction
Fritillaria przewalskii Maxim. (FPM) is a perennial herb of the genus Fritillaria in the lily family and is one of the main sources of the Chinese medicinal herb “Chuan Bei Mu”. According to the Chinese Pharmacopoeia 2020 Edition, “Chuan Bei Mu” includes Fritillaria cirrhosa D. Don, Fritillaria unibracteata Hsiao et K. C. Hsia, Fritillaria delavayi Franch., Fritillaria taipaiensis P. Y. Li, and Fritillaria unibracteata Hsiao et K. C. Hsia var. wabuensis. 1 As a Chinese medicinal herb of notable value, it tastes bitter and is slightly cold in nature, with the effect of clearing heat, moistening the lungs, relieving coughs, and resolving phlegm. 1 It is grown in southern Gansu, eastern and southern Qinghai, and western Sichuan, where it cultivates in the shrub or grassland at altitudes in the range of 2800–4400 m. 2 In addition to literature records, the newly emerged maximum entropy model (Maxent) technology combined with ecological and environmental data can also predict the theoretical spatial distribution of medicinal plants including FPM. 3 Up to now, more than 200 products containing “Chuan Bei Mu” have been marketed and used for the treatment and prevention of various symptoms and ailments such as coughing, asthma, and other conditions. 4 Many scholars, both domestically and internationally, have studied the chemical composition of the genus Fritillaria. However, it has been rarely reported about the chemical composition of FPM, one of the important base source herbs of “Chuan Bei Mu”. This work has summarized the chemical composition of “Chuan Bei Mu”, which includes alkaloids, saponins, nucleosides, organic acids, terpenoids, sterols, and so on. 5 Pharmacologically, it has cough suppressing, expectorating, asthma managing, sedating and pain-relieving, anti-inflammatory, antibacterial, and antioxidant properties. 6 Studies like this lay the foundation for the further clinical application of Fritillaria, for which the alkaloid component of it is considered to be the main active component.7–9 It is worth noting that the content of alkaloids in Fritillaria is very low, only about 0.05%−0.23%. 10
FPM, which is categorized under “Chuan Bei Mu”, is included in the Chinese Pharmacopoeia. Nevertheless, no studies proposing standards for fingerprinting them have been published. Evaluating the quality of medicinal plants by chromatographic fingerprinting techniques has been accepted by several international organizations and scientists around the world. 11 To obtain a comprehensive assessment of herbal medicines, in addition to fingerprinting, qualitative and quantitative analyses of their chemical components are required to control the intended medicines’ quality.12, 13
Ultra-performance liquid chromatography (UPLC) is based on solid particles with a diameter of 1.7 µm. It is a novel chromatographic analytical technology with short separation times, excellent high-resolution separation sensitivity, and low solvent consumption.14, 15 Also, it can be correlated with the pharmacodynamic index to screen key quality markers. 16 UPLC has the characteristics of super high efficiency, high separation degree and high sensitivity, and has been widely used in the analysis of components in traditional Chinese medicine, the establishment of fingerprint chromatograms, and so on. 17 UPLC was applied to analyze the alkaloid composition of Fritillaria unibracteata var. Wabuensis. 18 Although there are other methods for the analysis of Fritillaria alkaloids (HPLC-ELSD), these methods lack sensitivity and have high analytical costs. 19 In this paper, UPLC technology was proposed as the means to establish the fingerprint and content determination of FPM and fill the gap in the analytical method in Fritillaria. Furthermore, different batches of FPM samples underwent statistical analysis using a variety of chemometric analysis methods to provide a basis for maintaining quality control. This can lay the foundation for the technology’s continued in-depth development and utilization.
Materials and Methods
Materials and Reagents
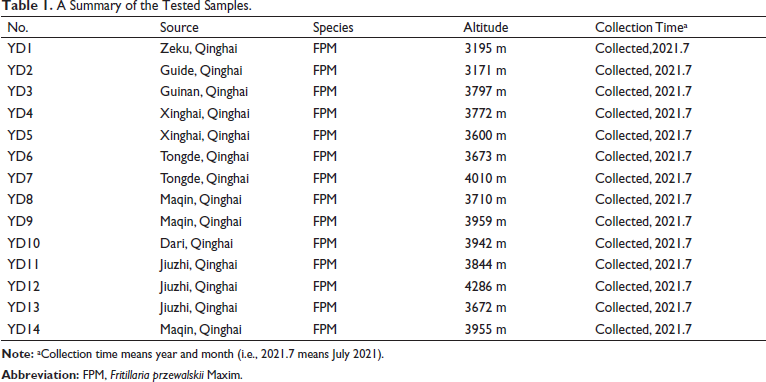
Exemplars for peimisine and peiminine were supplied by the National Institute for the Control of Chengdu Herbpurify Co., Ltd. (Chengdu, China), and the purity of each compound was greater than 98%. Ammonium acetate and acetic acid of mass-spectrometry grade and acetonitrile of HPLC grade were obtained from Merck (Darmstadt, Germany). Other chemicals used in this study were of analytical grade and sourced from Beijing Chemical Reagent Co. (Beijing, China). A total of 14 batches of crude FPM samples were collected from Qinghai Province (see Table 1). FPM was harvested in July, and the underground bulbs was selected to analyze the constituents. At this time, the phenological stage of the FPM is the last flowering stage and the alkaloid content is highest at this time. 20 The botanicals of the herbs were identified by Professor Zhi Chen. The voucher specimens were deposited at the School of Life Science, Qinghai Normal University (Xining, China).
A Summary of the Tested Samples.
Apparatus and Chromatographic Conditions
The UPLC analysis was carried out using a UPLC system (Agilent, CA, USA) equipped with a quaternionic pump, auto-sampler, and column oven, and the system was controlled via the Agilent Data Acquisition software. The chromatographic separations were performed on an Acquity UPLC CSH C18 column (2.1 mm × 100 mm, 1.7 µm, Waters, Milford, MA, USA) with the column heater set to 30°C. Ultra-pure water was produced from a Milli-Q® Reference System (Merck, Darmstadt, Germany), and samples and solid reagents were weighed on a Mettler Toledo AB265-S 1/100,000 electronic balance (Zurich, Switzerland). For the column, the mobile phase consisted of acetonitrile (B) and water (A) (0.1% acetic acid and 0.01 mol L−1 ammonium acetate) with a flow rate of 0.4 mL/min. The mobile phase gradient used in this study was 10%–20% B from 10 to 20 min, 20%–20% B from 20 to 30 min, 20%–95% B from 30 to 50 min, and 95%–95% B from 50 to 55 min. The composition then returned to the initial conditions and was held at 10% B for a further 10 min for equilibration. The mobile phase was filtered through a 0.22 µm Millipore filter membrane prior to being used. The column temperature was maintained at 30°C, and the injection volume for reference compounds and samples was 2 µL.
Mass spectrometry was performed on a quadrupole-time-of-flight mass spectrometer (6546 LC/Q-TOF, Agilent, Palo Alto, CA, USA), equipped with a source of electrospray ionization (ESI), and operated in positive ion mode. The mass data acquisition was set in the range of m/z 100–1000 Da, while the spectroscopic analysis was performed under the following conditions, 21 the atomizer temperature was set at 325°C; drying gas flow at 10 L/min; nebulizer at 35 psi; sheath gas temperature at 350°C; sheath gas flow at 10 L/min; V Cap at 4000 V; and the collision energy was −40 V.
Preparation of Standard Solutions
A stock standard solution was prepared by dissolving peiminine and peimisine in acetonitrile at a concentration of approximately 1.0 mg/mL each. Working mixed standard solutions were made daily by diluting the stock with acetonitrile to the desired concentration, which was based on the sensitivity of detection and the linear range of the study.
Preparation of Sample Solutions
Samples were prepared firstly, by weighing out 0.2 g of the powder (sieved by No. 4), which was put in a 100 mL round-bottom flask. A concentrated ammonia solution (1 mL) was added and the solution was stirred for 2 h. Then, 20 mL of trichloromethane–methanol (4:1) mixture was added, mixed in well, and refluxed in a water bath at 80°C for 2 h. This mixture was allowed to cool before being filtered. The filtrate was spun dry in a round-bottom flask, dissolved with methanol and transferred to a 1 mL measuring flask. Finally, methanol was added to the scale, the flask was shaken well, and the mixture passed through a 0.22 µm microporous filter membrane, thereby yielding the filtrate. 22
Data Analysis
Cluster analysis (CA) is a common unsupervised pattern recognition method that can sort samples by placing those with similar characteristics into separate categories. 23 The CA for this study was carried out by SPSS Professional Statistics version 25.0 (New York, USA). To establish clusters, Z-score was used for data normalization, while Ward’s method and squared Euclidean distance were also employed. UV was used for data normalization, and SIMCA 14.1 software facilitated principal component analysis (PCA) and orthogonal partial least squares discriminate analysis (OPLS-DA).
Results
Fingerprint Analysis of FPM
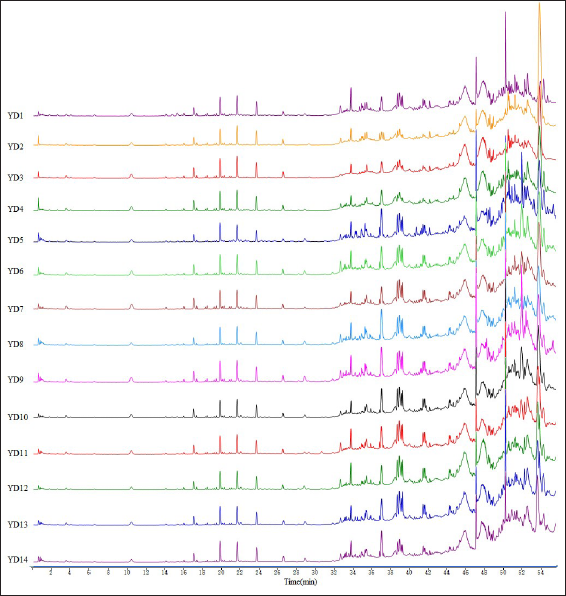
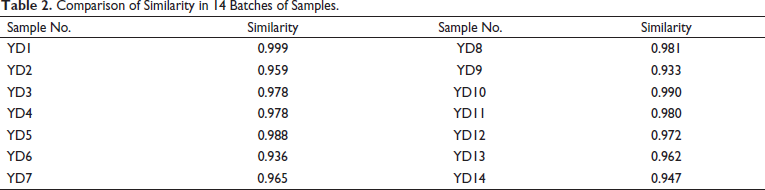
The 14 batches of FPM herbal samples were labeled YD1 to YD14. Take YD1 to YD14 batches of hawthorn core powder, and the test solutions were prepared according to the method as detailed in the Preparation of Sample Solutions section, while the chromatograms were recorded as per the steps laid out in the chromatographic Conditions section. The fingerprint similarity was evaluated based on the Euclidean distance, 24 with sample YD1 as the reference. The mean value of the peak area of YD1 was taken to serve as the control for the evaluation of UPLC fingerprints of FPM samples sourced from 14 batches. The peaks of these fingerprints all had good resolution (see Figure 1). Results showed the similarities between the samples YD1 to YD14 and the control fingerprints ranged from 0.935 to 0.999 (see Table 2). This indicated that there were some differences in the chemical composition of the FPM sampled from different areas.
Comparison of Similarity in 14 Batches of Samples.
Validation of Methodology
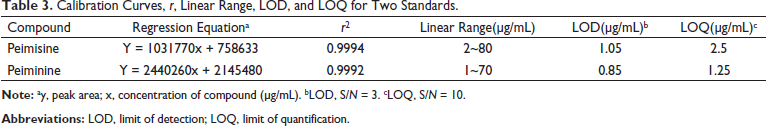
The UPLC method was validated for its linearity, lower limit of quantification (LOQ), lower limit of detection (LOD), accuracy, repeatability, stability, and recovery rate according to the literature review. 18 The standard solution prepared in the mixed solutions was taken and analyzed as the conditions stated in the chromatograms section and recorded according to the steps laid out in the chromatographic conditions. The linear regressions were carried out, with the concentrations of the two alkaloids as the x-axis and the peak areas as the y-axis, to obtain the corresponding standard curves and correlation coefficients. This process was repeated three times for different concentrations of the analyte standard solutions. Through incrementally diluting the standard solution, the LOD was calculated by the signal-to-noise ratio (S/N) of about three, and the LOQ by the S/N of about 10, as shown in Table 3. All analytes showed good correlation coefficients (r 2 > 0.9992), and the results are shown in Table 3.
Calibration Curves, r, Linear Range, LOD, and LOQ for Two Standards.
Six test solutions were prepared in parallel with the FPM sample according to the method provided in the sample Solutions Preparation section. The analysis was performed according to the chromatography-Mass Spectrometry Conditions section. The Residual Standard Deviation (RSD) of each component was 1.1% and 1.6%, respectively, which indicated that the method was reproducible. The results are shown in Table 4. One of the test solutions in the reproducibility test was analyzed at 0, 2, 4, 8, 12, and 24 h in accordance with the conditions listed in the Chromatographic section. The resulting RSD of each component was 1.2% and 1.8%, which indicated that the test solution was stable at room temperature within 24 h. The results are shown in Table 4.
Repeatability, Stability, Accuracy, and Recovery of Peimisine and Peiminine.
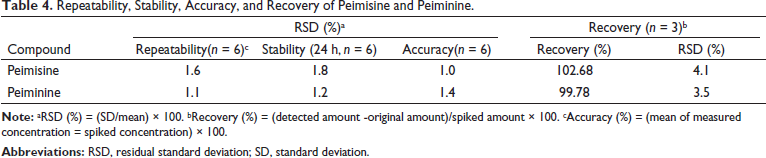
A certain concentration of the standard solution was taken, and the sample was repeatedly injected six times according to the conditions outlined in the chromatographic section. The RSD of the peak areas of the components were 1.0% and 1.5%, which indicated that the precision of the instrument was good. The results are shown in Table 4. About 0.10 g (six portions) of FPM samples with known content were weighed precisely, and a prescribed amount of each standard solution was added precisely to prepare the spiked recoveries of the test solutions based on the method detailed in the Preparation of Sample Solutions section, and the samples were analyzed in the same manner as provided in the Chromatographic section. The average recoveries of each component were calculated as 99.78% and 102.68%, while the RSD was 3.5% and 4.1%. The results were concluded as demonstrative of the method’s superior recovery performance, which is shown in Table 4.
Quantitative Analysis of FPM
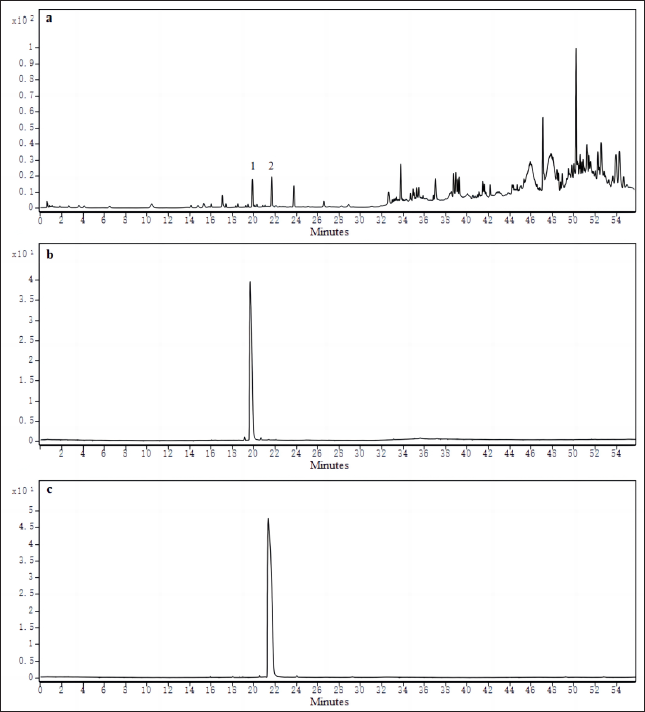
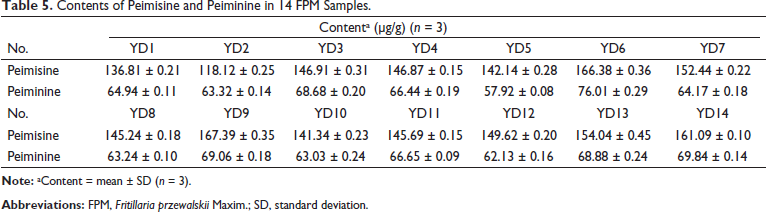
From the chromatography of the standards and samples shown in Figure 2, it can be seen that the components examined in the FPM were well separated from the other compounds using the established UPLC method. UPLC total ion chromatography (TIC) is shown in Figure 2a. The retention times of peimisine and peiminine were 19.876 min (Figure 2b, peak 1) and 21.674 min (Figure 2c, peak 2), respectively. Peimisine and peiminine in all of the 14 batches of FPM met this requirement, the quantitative analytical results are shown in Table 5. However, as the results illustrate, the content of peimisine and peiminine varied among batches of samples, with YD9 having the highest peimisine content and YD6 having the highest peiminine content. These results are particularly significant, peiminine and peimisine are the main alkaloids of Fritillaria and these compounds are considered biologically relevant to a variety of pharmacological activities which are consistent with the plant’s traditional medicinal use.25, 26
Contents of Peimisine and Peiminine in 14 FPM Samples.
Discussion
Statistical Analysis
Quality Evaluation by CA
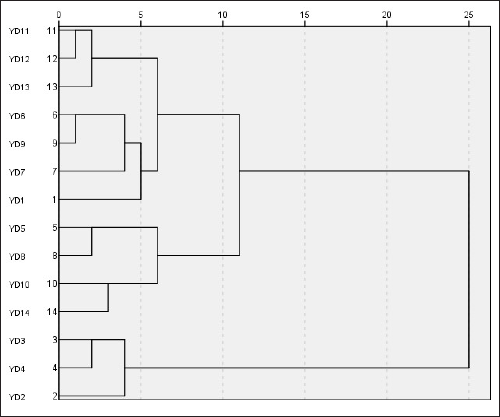
Based on the peak areas of the common chromatographic peaks of the FPM samples, CA was used to evaluate the differences among them, and the results of CA are shown in Figure 3. When the classification distance was 15, YD2, YD3, and YD4 were clustered into one group and the others clustered into another significantly larger group. From this, it was inferred the herbal samples of YD2, YD3, and YD4 (which originated from Guide County, Guinan County, and Xinghai County, respectively) were significantly different from the other group of herbal samples. Moreover, the herbal samples of YD5, YD8, YD10, and YD14 (which originated from Xinghai County, Machin County, Dari County, and Machin County, respectively) displayed an extent of similarity among them. In general, the variation observed among the FPM herbal samples, relative to their origins, was limited.
Quality Evaluation by PCA and OPLS-DA
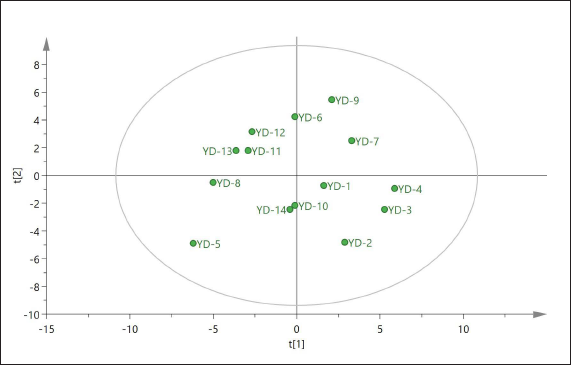
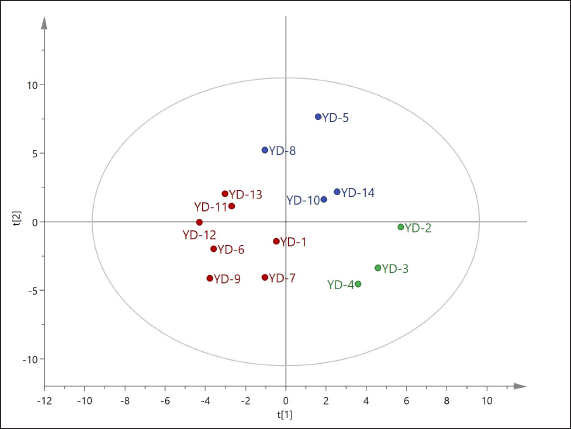
PCA is the most common data analysis method in multivariate statistical analysis, which can simplify a large amount of correlated data via “dimensionality reduction”, describe the samples by using uncorrelated variables representing data characteristics and analyze them according to data characteristics in an “unsupervised” mode. To better reflect the variability among FPMs, the peak area results of the common peaks of the 14 batches of FPM samples were imported into SIMCA 14.1 software for PCA analysis. The model has fitted automatically to the PCA model after data normalization using UV (see Figure 4). Through the PCA analysis, it was shown that the R 2 X (cumulative explanatory power parameter) value was 0.666 in terms of variance contribution. From Figure 4, it is clear that the samples can be classified into three categories: YD2, YD3, and YD4 as category I; YD5, YD8, YD10, and YD14 as category II; and the remaining as category III. This categorization shows that there are some differences among those samples from different batches. OPLS-DA is a supervised pattern recognition method that can be used to further search for differences among samples. On the basis of PCA analysis, to further analyze the differences among different batches of FPM samples, a new model was constructed on PCA to perform OPLS-DA analysis by using SIMCA 14.1 software. The results were consistent with the PCA and further highlighted the inter-group distinctions among the samples (see Figure 5).
Conclusion
In this study, a UPLC fingerprinting method and a chemometric method were developed for the quality control of FPM from different regions. The results showed that the UPLC analytical method can qualitatively and quantitatively determine the content of the main alkaloids in FPM with good accuracy and precision. Further analysis indicated that the proposed fingerprinting method is reliable and practical for general and comprehensive quality evaluation. Though the UPLC fingerprints obtained in this study were basically similar, there were still many variations in the samples’ chemical compositions. The chromatographic fingerprint of FPM and its characteristics, combined with Euclidean distance, the statistical methods of CA, PCA, and OPLS-DA, contribute to the accurate identification and quality control of FPM. Overall, this provides a new approach to the basis of quality control for FPM, providing a methodological reference for quality research of other Chinese herbal medicines.
Footnotes
Abbreviations
Acknowledgment
Qinghai Provincial Key Laboratory of Tibetan Medicine Pharmacology and Safety Evaluation, Northwest Institute of Plateau Biology, Chinese Academy of Sciences for providing the facilities in the Natural Product Laboratory. School of Geography Science and School of Life Science, Qinghai Normal University to carry out the present research work.
Declaration of Conflict of Interests
The authors declared no potential conflicts of interest with respect to the research, authorship, and/or publication of this article.
Funding
This work was supported by the Basic research on antitussive and antiasthmatic substances and the development of extracts from Fritillaria unibracteata (2022-SF-142)and the Key Laboratory of Medicinal Animal and Plant Resources of the Qinghai-Tibetan Plateau (2020-ZJ-Y04).
Statement of Ethical Approval and informed consent
This work does not involve animal testing and does not require ethical approval. Informed consent of all authors has been obtained for this work.
Summary
At present, there are few studies on the FPM, and the UPLC fingerprint and content determination of Fritillaria need to be explored. The chromatographic fingerprint of FPM and its characteristics, combined with the statistical methods, contribute to the accurate identification and quality control of FPM. This provides a new approach to the basis of quality control for FPM and a methodological reference for quality research of other Chinese herbal medicines.