
Abstract
Background
Pistacia integerrima (PI) galls, being rich in polyphenolic compounds, owing to its high restorative worth and restricted assets and exorbitant utilization lead to the overexploitation of the species and availability issues. It is expected to categorise under the red list of threatened taxa. Ayurveda text Bhaishajaya Ratnavali mentioned Quercus infectoria (QI) as ‘pratinidhi’ or substitute of PI and Yogaratnakara (abhavvarga) text reference indicated Terminalia chebula (TC) having the same therapeutic character as in PI. Hence, this study was focused on the comparative quantification of major polyphenolic compounds in aqueous and hydro-alcoholic extracts of PI, QI and TC by liquid chromatography and tandem mass spectroscopy (LC-MS/MS).
Objectives
The LC-MS/MS method was used for the determination of polyphenolic compounds in aqueous and hydro-alcoholic extracts of PI, QI and TC.
Materials and Methods
The LC-MS/MS method was developed for the quantification of targeted polyphenolic compounds and validated in terms of linearity, accuracy, precision, limit of detection and limit of quantification. Analysis performed by LC-MS/MS 6460 C triple quad coupled with Agilent HPLC. The chromatographic separation was performed on the RP C18 column with gradient elution.
Results
The developed method of LC-MS/MS was used for the quantitative estimation of gallic acid, corilagin acid, caffeic acid, syringic acid, rutin hydrate, ellagic acid, quercetin and morin hydrate in PI, QI and TC. As per method validation parameters, calibration plots were found to be linear, accurate, precise and specific for LC-MS/MS. The calibration plot exhibited an excellent coefficient of determination (R2 ≥ 0.99), and extraction recovery was found 96.20%–103.71%. Gallic acid and ellagic acid are the most abundant compound among eight targeted polyphenolics in all extracts.
Conclusion
The finding of LC-MS/MS analysis of polyphenolic compounds in aqueous and hydro-alcoholic extracts indicates that PI, QI and TC are having phytochemical similarities up to an extent in polyphenolic compounds as a secondary metabolite; however, a firmer opinion can be formed after a comparative efficacy study and the evaluation of all three extracts.
Introduction
Pistacia integerrima Linn. (PI) which belong to the Anacardiaceae family are deciduous aromatic shrubs and trees, slightly bitter and astringent with terebinthine in odour. 1 It is native to Asia and has a vast range of distribution from East Afghanistan to Pakistan and the Himalayas in the Northwest and West, as well as Kumaon. 2 The majority of phytochemicals in PI are polyphenolic compounds. 1 Along with essential oil, alkaloids, saponins and sterols, these are thought to be responsible for the majority of the plant’s therapeutic activities. 3
PI galls were traditionally used to treat stomach and dental problems, sickle cell anaemia, skin issues (psoriasis, vitiligo, etc.), asthma and fever. Polyphenolic compounds have been demonstrated to exhibit a wide range of biological and pharmacological activity, including insecticidal, anthelmintic, anti-plasmodial, anti-sickling, cytotoxic, anti-inflammatory, and antibacterial activity, hepatoprotective, and anticonvulsant properties.4–12 PI galls are extensively used as a herbal medicinal in the formulation of Ayurvedic and Chinese medicines and are said to provide therapeutic activity for a variety of respiratory ailments. High medicinal/therapeutic value and commercial demand of PI galls in the national and international market leads to overexploitation of the species. In some countries, PI has been categorised under the list of threatened, critically endangered species and its vulnerable conservation status due to overexploitation and habitat degradation.13, 14
Quercus infectoria Oliv. (QI) galls (family- Fagaceae) are the spherical shaped gallnuts formed by the gall wasp, Cynips gallae-tinctoriae Oliv in small shrub or trees. 15 Galls are recommended as representative of PI in the Ayurveda textbook Bhaishajaya Ratnavali (Abhavparkaran). Traditionally, QI galls are used as a substitute in formulations (Karkatadichurna, Balachaturbhadra, Kantkaryavaleha, Shringyadichurn).16, 17 These are recommended for the treatment of allergic and infectious diseases such as asthma, dysentery, skin infections and anti-inflammatory diseases. 18 The screening of QI galls predominantly shows that it is rich in polyphenolic compounds such as tannins (50%–70%), gallic acid, ellagic acid and flavonoids. Alkaloids, carbohydrates, glycoside, saponins, sterols, triterpenes are also reported as part of phytoconstituents.19, 20 Polyphenolic compounds in QI galls pharmacologically showed significant activity as anti-inflammatory, astringent, anti-diabetic, anti-tremorine, anti-viral, anti-fungal, antioxidant, nephroprotective and chemopreventive activities.15, 21–32
Terminalia chebula Retz. (TC) belonging to the family Combretaceae is a medium-to-large size deciduous tree; it is regarded as ‘King of Medicine’ by ayurvedic apothecaries and traditional medicinal practitioners. TC significantly contains 32%–34% of tannins, gallic acid, ellagic acid, chebulinic acid, flavonol glycosides, triterpenoids and other phenolic compounds such as ethyl gallate, luteolin, protein, amino acids and minerals. 33 Similar to QI and PI, TC fruits are also rich in high phenolic components. They are actively used in various classical and proprietary formulations. They have been traditionally used for different therapeutic benefits and proved pharmacologically to be active as antioxidant, anti-bacterial, anti-fungal, anti-viral, anti-protozoal, anti-carcinogenic, radioprotective, anti-mutagenic, anti-arthritic, chemopreventive, hepatoprotective, cardioprotective, cytoprotective, anti-ulcer, anti-diabetic, anti-inflammatory, hypolipidemic, antispasmodic, wound healing, purgative, anti-allergic, immunomodulation, bronchial asthma and atopic dermatitis.34–36
In the Ayurveda textbook, Yogratnakar (The First Schedule) in ‘Abhavvarga’ mentions ‘PI’ as having the same therapeutic character as that of TC. 37 Polyphenolic compounds of various plants and species are therapeutically proven to be active against various diseases. PI, QI and TC are rich in various polyphenolic compounds. However, there have been no previous published data on the ‘comparative study of polyphenolic compounds’ as a secondary metabolite. A vast amount of literature are available for the identification and quantification of polyphenolics in P. integerrima, Q. infectoria and T. chebula. Hence, the present study has been designed for the comparative analysis of polyphenolic compounds in aqueous and hydro-alcoholic extracts of QI galls and TC fruits with PI galls by using the liquid chromatography and tandem mass spectroscopy (LC-MS/MS) technique.
The study involves the identification of targeted polyphenolic compounds in the aqueous and hydro-alcoholic extracts of the PI galls, QI galls and TC fruits using LC-MS/MS. Targeted polyphenolic compounds were identified through multiple reaction mode (multi-MRM) scanning by using the MS/MS analysis technique. Hence, the study provides a reference data of common compounds as ‘polyphenolic compounds’ in QI galls and TC fruit with respect to PI galls.
Materials and Methods
Gallic acid (99%), corilagin (99%), caffeic acid (99.5%), syringic acid (95%), rutin hydrate (95%), ellagic acid (99.8%), quercetin (97%) and morin hydrate (90%) were purchased from Sigma Aldrich, India. HPLC grade Methanol, LC-MS grade acetonitrile and formic acid were procured from Merck Life Science Pvt. Ltd., Mumbai, India. Ultrapure water was obtained by using a Milli-Q Advantage® A10 and Millipore Elix® (Elix Technology) LC Pack water purification system.
Plant Materials
Dried galls of PI, QI and dried fruit pericarp of TC were arranged from the approved inventory of Dabur India Ltd., Sahibabad (Ghaziabad), India, and authenticated by Dr C. S. Rana (Taxonomist) of the Bio Resource Development Department, against the Voucher Nos. DRDC-1256-BRD/P. Integerrima L., DRDC-1257-BRD/QI and DRDC-1255-BRD/TC.
Preparation of Aqueous Extracts
Dried galls of PI, QI and fruit pericarp of TC were pulverised to get coarse ground powder. For the aqueous extraction of each drug, the decoction method (classical method) was adopted. Demineralised water (DM) was added in the coarse ground powder in a stainless-steel extractor and boiled for 2 hours and filtered off through (60 mesh) 149 µm nylon cloth. The process was repeated twice for complete extraction. The obtained filtrate was concentrated in a vacuum tray drier at 45°C under reduced pressure. After drying, lumps and flakes of dry extract were grounded under controlled conditions of temperature (25°C ± 2°C) and relative humidity (45% ± 5% RH) to obtain a fine powder. The same process was implemented for all three drugs to obtain an aqueous extract.
Preparation of Hydroalcoholic Extracts
Dried galls of PI, QI and fruit pericarp of TC were pulverised to obtain the coarse ground powder. The coarse ground powder was taken in a round bottom flask fitted with a condenser and refluxed for 5 hours using water alcohol (50:50) as a solvent ratio. Then it was filtered through (60 mesh) 149 µm nylon cloth to get the filtrate. The process was repeated twice after 3 hours by using a fresh solvent till the drug appeared exhausted. The obtained filtrate volume was concentrated by a vacuum tray drier at 45°C and under reduced pressure. After drying, the extract was scrapped from the tray in the form of hard lumpy mass and flakes. Lumps/flakes of the extract were crushed under controlled conditions 25°C ± 2°C/45% ± 5% RH into a fine powder. All aqueous and hydroalcoholic extracts were stored in airtight containers for further use. The same process was implemented for all three drugs to obtain the hydro-alcoholic extract.
Preparation of Standard Solutions
Accurately about 2 mg of each reference standard (caffeic acid, corilagin, ellagic acid gallic acid, morin hydrate, quercetin, rutin hydrate and syringic acid) of known purity was weighed in 15 mL of methanol and sonicated for 5 min to dissolve the content completely. The volume was made up with methanol up to 25 mL. Before analysis, all the stock solution was mixed to obtain a concentration of 200 µg/mL for each marker and filter using a 0.2 µm polytetrafluoro ethylene (PTFE) membrane filter.
Preparation of Sample Solutions
An accurately weighed dry extract of 500 mg in the powder form of the plant material was taken in a 25 mL volumetric flask, with a little amount of methanol, and sonicated for 10 min at 25°C. After solubilisation, the volume was made up to 25 mL with methanol to obtain a concentration of 20 mg/mL. The extract solution was filtered through the AXIVA–ETO-sterile PTFE membrane filter (0.45 µm) and filled in sample vials prior to injection. These vials were injected in triplicate into the HPLC-MS/MS system to determine the content of compounds.
LC-MS/MS Instrumentation and Chromatographic Conditions
Agilent Technologies was used to conduct the LC-MS/MS-6460 analysis of the polyphenolic compounds with a triple quad coupled with the Alliance HPLC system (e2695 Separation module, Waters, United States) equipped autosampler attached with a PDA detector (Waters 2998). The separation was carried out on an Agilent Eclipse plus reversed phase C18 column (3.5 µm, 4.6 × 100 mm2). The temperature of the column was set to 40°C. The elution gradient contains mobile phases A (0.1% v/v formic acid in acetonitrile) and B (0.1% v/v formic acid in water). The flow rate was set to be 0.6 mL/min, and the injection volume was 4 µL for gallic acid and 10 µL for other compounds and samples. The elution gradient was carried out in the following programme using a mixture of mobile phases A and B: 0–7 min, 98% B; 7–9 min, 80% B; 9–15 min, 50% B; 15–20 min, 30% B; 20–21 min, 5% B; 21–25 min, 5% B; 25–26 min, 98% B; 26–35 min, 98% B.
The Agilent LC-MS/MS 6640 model triple quadrupole mass spectrometer equipped with a jet stream electrospray (AJS-EIS) was used for MS detection in both positive and negative ionisation modes. To quantify the analytes, multiple reaction mode (MRM) was used: the assay of studied substances was done after two or three transitions, the first for quantitative reasons and the second and/or third for confirmation. For AJS-ESI-QQQ, the set parameters are as follows. Nitrogen gas was used as collision gas. The capillary voltage was 3.5 kV in positive and negative modes, the nozzle voltage was 0.6 kV, the ion source/gas temperature was set to 325°C, the gas flow was 10 l/min, the nebuliser pressure was 35 psi, the drying gas temperature was 350°C and the sheath gas flow was 11 l/min. 38
Validation of the LC-MS/MS Method
Linearity, the Limit of Detection and the Limit of Quantification (LOQ)
A calibration study was conducted over a wide concentration range of 0.1–0.2 µg/mL for 1–8 compounds (by using a stock solution of mix standards). Limit of detections (LODs) and limit of quantifications (LOQs) for each standard substance were acquired, while the signal-to-noise ratios were 3 and 10, respectively.39, 40
Precision and Recovery
The precision was analysed using standard solutions with six replicates, and each standard compound’s peak area’s percentage relative standard deviation (%RSD) was calculated. Standard addition to a specified extract was used to test the method’s accuracy.39, 40 The recovery was calculated using the following equation: recovery (%) = (amount found – original amount)/amount spiked × 100%.
Robustness
The robustness of the new LC-MS/MS technique was evaluated by changing the mobile phase flow rate and column temperature. The method’s robustness was determined by calculating the %RSD of the peak region.39, 40
Determination of Selected Polyphenolic Compounds in Extracts
The developed LC-MS/MS method was applied to analyse gallic acid, corilagin acid, caffeic acid, syringic acid, rutin hydrate, ellagic acid, quercetin and morin hydrate content in the aqueous and a hydro-alcoholic extract of PI, QI and TC. The corresponding concentration was determined using the standard curve’s regression equation.
Results and Discussion
Optimisation of LC-MS/MS Conditions
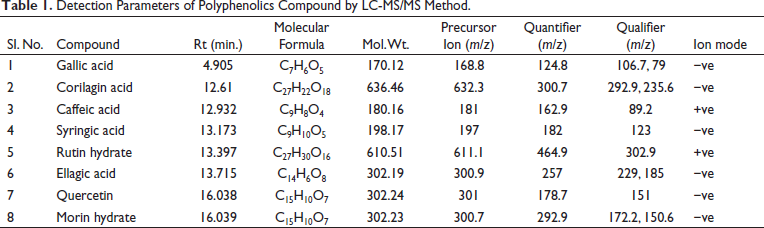
The LC-MS/MS analysis conditions were used for the simultaneous and comparative quantification of the eight targeted polyphenolic markers found in aqueous and hydro-alcoholic extracts of PI, QI and TC. The comparative analysis was performed with a reversed-phase C18 column (3.5 µm, 4.6 × 100 mm2) at 40°C of column temperature. Elution gradient consisted of mobile-phase systems A and B as 0.1% v/v formic acid in acetonitrile and 0.1% v/v formic acid in water, respectively, at a flow rate of 0.6 mL/min with 10 µL injection volume of each sample. Compounds 1–8 were detected in 35 min using the LC-MS/MS technique (Table 1, Figure 1).
Detection Parameters of Polyphenolics Compound by LC-MS/MS Method.
LC-MS/MS Representative Chromatograms of the Polyphenolics Compound.
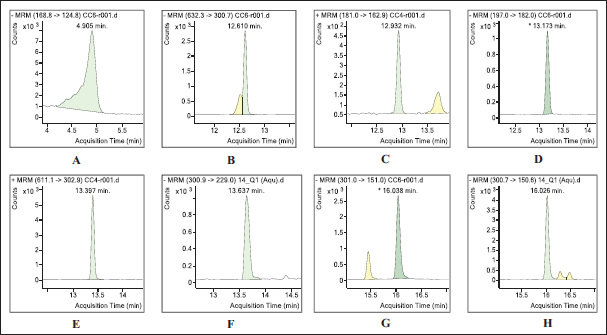
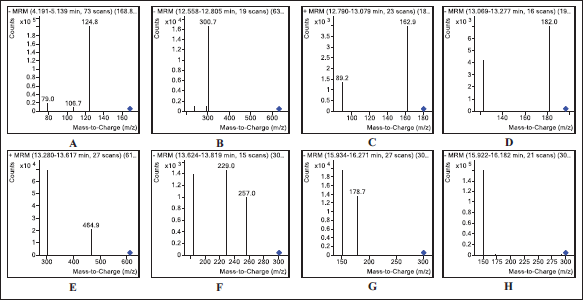
Figure 1 shows the comparative analysis of LC-MS/MS for polyphenolic compounds. The ESI source was used in the MRM (negative and positive ion modes). Precursor ions for compounds 1 and 7 were detected at m/z 168.8 and 301 in the positive ion mode [M + H]+, respectively, whereas compounds 2, 3, 4, 5, 6 and 8 were detected at m/z 632.3, 181, 197, 611.1, 300.9 and 300.7 in the negative ion mode [M – H]–, respectively (Figure 2). MRM conditions optimised for LC-MS/MS are provided in Table 1.
Mass Spectra Showing the Transitions from Precursor to Daughter Ions for Polyphenolics Compound.
Validation of LC-MS/MS Method
Calibration Curve
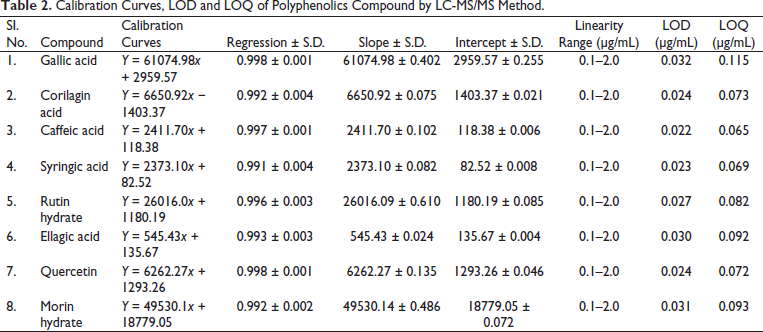
The calibration graph’s linear regression data revealed a good linear relationship between the peak area and a wide range of selected concentrations. The linear regression calibration curves were plotted between the peak area against the concentration and were linear from 100 to 2,000 ng/mL for all selected targeted markers, namely gallic acid, corilagin acid, caffeic acid, syringic acid, rutin hydrate, ellagic acid, quercetin and morin hydrate with good linear relationships of 0.998 ± 0.001, 0.992 ± 0.004, 0.997 ± 0.001, 0.991 ± 0.004, 0.996 ± 0.003, 0.993 ± 0.003, 0.998 ± 0.001, and 0.992 ± 0.002, respectively (Table 2).
Calibration Curves, LOD and LOQ of Polyphenolics Compound by LC-MS/MS Method.
Precision
Precisions were calculated and reported in %RSD. Precision data comprise inter-day, intra-day and inter-analyser measurements. The %RSD less than 2 showed that the precision measurement yields satisfactory results and confirmed that the method can be used in any laboratory for the estimation of caffeic acid, corilagin, ellagic acid, gallic acid, morin hydrate, quercetin, rutin hydrate and syringic acid (Table 3). The precision acceptance criteria were based on ICH guidelines and industry-accepted practices. 41
Precision and Recovery of the Polyphenolics Compound by the LC-MS/MS Method.
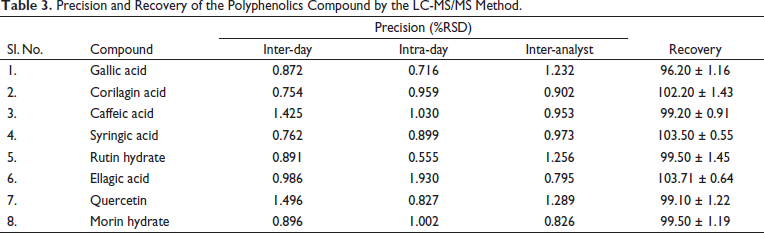
Accuracy
The method has proved that the recoveries of the gallic acid, corilagin acid, caffeic acid, syringic acid, rutin hydrate, ellagic acid, quercetin and morin hydrate in samples were within the range of 96.20 ± 1.16, 102.20 ± 1.43, 99.20 ± 0.91, 103.50 ± 0.55, 99.50 ± 1.45, 103.71 ± 0.64, 99.10 ± 1.22, and 99.50 ± 1.19, respectively (Table 3). The recovery of markers in analysed samples was assessed by comparing the area of respective peaks with the area of corresponding peaks in marker solutions.
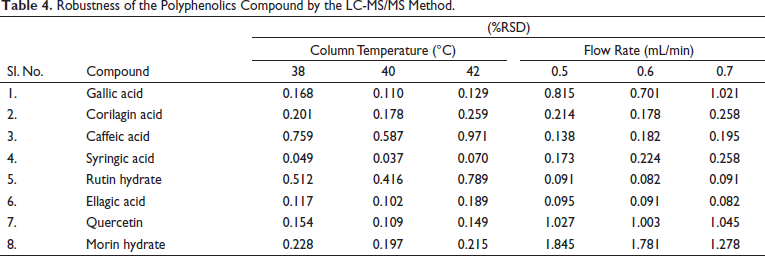
Robustness
The robustness of the LC-MS/MS method was optimised by variations in the column temperature and the solvent flow rate. The effect of the robustness condition on the result is shown in Table 4. The result was reported as %RSD.
Robustness of the Polyphenolics Compound by the LC-MS/MS Method.
Sensitivity
The proposed LC-MS/MS method, LOD and LOQ of gallic acid, corilagin acid, caffeic acid, syringic acid, rutin hydrate, ellagic acid, quercetin and morin hydrate were 0.032, 0.024, 0.022, 0.023, 0.027, 0.030, 0.024 and 0.031 µg/mL and 0.115, 0.073, 0.065, 0.069, 0.082, 0.092, 0.072 and 0.093 µg/mL, respectively (Table 2).
Determination of Compounds 1–8 in Extracts by LC-MS/MS Analysis
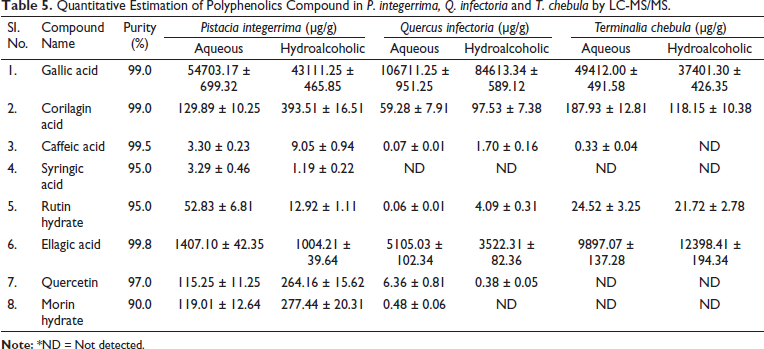
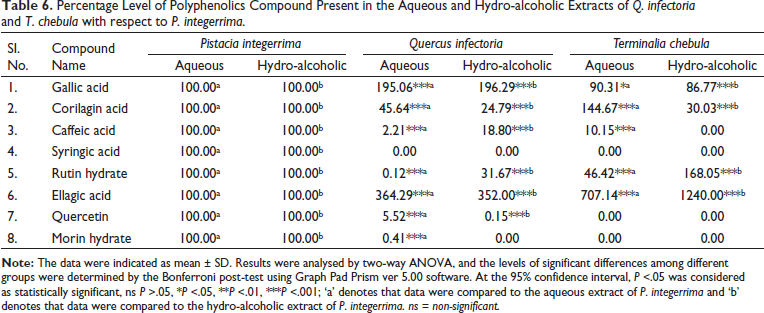
The developed and validated LC-MS/MS analysis method was used to quantify components 1–8 in the PI, QI and TC extracts. The retention times of gallic acid, corilagin acid, caffeic acid, syringic acid, rutin hydrate, ellagic acid, quercetin and morin hydrate in the sample were 4.90, 12.61, 12.93, 13.17, 13.39, 13.71, 16.038 and 16.039 min, respectively as shown in Table 1, an analysis of the aqueous and hydro-alcoholic extracts of PI, QI and TC under the optimized MRM conditions. Among these markers, compounds 1 (gallic acid) and 6 (ellagic acid), the major constituents of aqueous and hydro-alcoholic extracts of PI, QI and TC, were found to be present in the highest amount (Table 5). Previous studies also reported that gallic acid and ellagic acid are the important polyphenolics in PI, QI and TC.19,39, 42–44 The percentage levels of the marker compound present in the aqueous and hydro-alcoholic extracts of QI and TC with respect to PI are summarised in Table 6. Gallic acid and its derivatives were also reported earlier by several authors in PI, but the content of gallic acid was lower than that in our study.38, 45 Previously, Ou et al. 40 reported and identified two polyphenolic compounds (ellagic acid and gallic acid) in QI through HPTLC. One of the most abundant compounds, that is, ellagic acid in QI was also identified by Onal et al. 46 It is also reported that gallic acid and ellagic acid were the major polyphenolic compounds present in TC.47, 48 Kumar et al. reported three polyphenolic compounds (gallic acid, rutin and quercetin) in TC by HPLC, but the content of these polyphenolics was lower than that in our study. 49
Quantitative Estimation of Polyphenolics Compound in P. integerrima, Q. infectoria and T. chebula by LC-MS/MS.
Percentage Level of Polyphenolics Compound Present in the Aqueous and Hydro-alcoholic Extracts of Q. infectoria and T. chebula with respect to P. integerrima.
Conclusion
As per the best knowledge of the authors, using the selected markers, a sensitive and accurate LC-MS/MS analysis method for quality control of PI, QI and TC was developed for the first time in this study. The approach was validated by evaluating the parameters of linearity, precision, accuracy and robustness, and it was successfully applied to sample analysis. Gallic acid and ellagic acid were found to be the most abundant polyphenolic components in the aqueous and hydro-alcoholic extracts of PI, QI and TC, as per the LC-MS/MS data. This approach exhibited that phytochemical profiling of aqueous and hydro-alcoholic extracts of PI was found similar to QI and TC, and they can be considered as substitutes for each other as per the Ayurveda texts. The developed LC-MS/MS analysis will be useful for assessing the quality of the PI, QI and TC, and further comparative efficacy evaluation study will be required to conclude the substitute.
Footnotes
Acknowledgements
Authors would like to show their gratitude to Dabur Research and Development Centre, for their support during the course of this research.
Summary
The developed method was accurate, precise, specific and good level of recovery.
The present study focused on liquid chromatography–mass spectrometry/mass spectrometry (LC-MS/MS) method development for determination of targeted polyphenolic compounds in aqueous and hydro-alcoholic extracts of PI, QI and TC.
The developed method is suitable for routine analysis of polyphenolic compounds in herbal extract.
Declaration of Conflicting Interests
The authors declared no potential conflicts of interest with respect to the research, authorship and/or publication of this article.
Funding
The authors received no financial support for the research, authorship and/or publication of this article.
Statement of Informed Consent and Ethical Approval
Necessary ethical clearances and informed consent was received and obtained respectively before initiating the study from all participants.